Research Article
Dietary Intake in a Cohort of HIV Patients at the Time of Diagnosis: Comparison
with a Matched Control Cohort and with Italian National Reference Values
Barbara Zanini
1*, Paola Rodari
2, Monica Marullo
1, Francesco Castelli
2, Maurizio Castellano
3, and Eugenia
Quiros-Roldan
2For the Nutri-Care Group
41Gastroenterology Unit, Department of Clinical and Experimental Sciences, University of Brescia, Italy
2University Department of Infectious and Tropical Diseases, University of Brescia and ASST Spedali Civili of Brescia, Italy 3Medicine Department, University of Brescia and ASST Spedali Civili of Brescia, Italy
4The Nutri-Care Group included the following: Alberto Lanzini and Chiara Ricci, Gastroenterology Unit, University of Brescia and ASST Spedali
Civili of Brescia, Brescia, Italy; Chiara Pezzoli, Department of Infectious and Tropical Diseases, ASST Spedali Civili of Brescia, Brescia, Italy; Nigritella Brianense, Alice Ferraresi, Emanuele Focà, Paola Lanza, University Department of Infectious and Tropical Diseases, University of Brescia and ASST Spedali Civili of Brescia, Brescia, Italy; Elena Raffetti, Francesco Donato, Unit of Hygiene, Epidemiology and Public Health - Department of Medical and Surgical Specialties, Radiological Sciences and Public Health, University of Brescia, Brescia, Italy *Corresponding Author: Barbara Zanini, Department of Clinical and Experimental Sciences, University of Brescia, Brescia, Italy.
Received: August 12, 2019; Published: August 26, 2019
Abstract
Keywords: HIV Diagnosis; Nutritional Status; Dietary Intake, Healthy Diet
The advent of combination antiretroviral therapy has improved life-expectancy in HIV patients, increasing the occurrence of other chronic diseases, mostly preventable with health promoting behaviours. The aim of this study was to assess the dietary intake in a co-hort of HIV patients (HC) at the time of diagnosis and to compare it with that of a coco-hort of healthy subjects (CC) and with the Italian guidelines. Dietary intake from both cohorts was collected using a 7-day food record and analysed by Microdiet©. Thirty-three HIV patients were enrolled (82% males, median age 41 years old). The contribution of carbohydrates to energy in HC was higher than in CC: 48.5 ± 5.2% vs 42.7 ± 6.6%, p = 0.0002. The proportions of total fats (34.2 ± 5.3% vs 36.6 ± 3.6%, p = 0.0322), mono-unsaturated fat acids, (14.0 ± 3.4% vs 17.3 ± 2.5%, p < 0.0001) and alcohol (1.5 ± 2.7% vs 5.9 ± 4.0%, p < 0.0001) were lower in HC than in CC. Both cohorts consumed more simple sugars, total fat, and saturated fat and less fibre than the recommendations. HC reported lower consumption of some vitamins and minerals and of omega fats than CC. HIV-infected patients need dietary counselling since the time of diagnosis and should be enrolled in nutritional surveillance plans in order to prevent emerging comorbidities.
Introduction
The introduction, and widespread use, of combination antiretroviral therapy (cART) in the mid-1990s has dramatically improved the health status of HIV-infected individuals with a life expectancy now approaching that seen in the general population. This has led to an increase in the occurrence of other chronic conditions (i.e. diabetes, hypertension, chronic kidney disease or osteoporosis [1], which are among the most common, costly, and preventable of all health problems in the developed countries and now accounting for almost 70% of all deaths worldwide in the general population [2]. Despite its clinical benefits, cART can also lead to important metabolic changes,
imbalance in sugar and lipid metabolism, (such as glucose intolerance and dyslipidemia) and bone mineral density reduction [1]. Most of those chronic illnesses could be delayed, and the quality of life improved, through health promoting behaviours, including a healthy diet, physical activity, avoidance of tobacco, and other types of lifestyle changes aimed to reduce risk factors [3].
The use of nutritional therapy for HIV-infected persons has received little attention, even though such patients often express interest in this issue. Many HIV-infected persons use dietary supplements, including herbal remedies, vitamins and chemical supplements, and protein drinks without dietary counselling [4,5]. Since the end of the nineties, several guidelines have been developed and published by different organizations concerned with HIV infection [6-9]. Few studies have focused on nutritional features among HIV patients in deve-loped countries, and most of them have studied nutritional intake in patients on stable cART when metabolic changes and clinical benefits due to cART could have modified the nutritional status [10-12].
A basic nutritional assessment is desirable for all persons infected with HIV. The 7-day diary-record (7d-DR) is the accepted reference method for the assessment of nutrient intake [13] but to our knowledge, no study so far has evaluated the macro- and micro-nutrient intake of HIV-infected patients using the 7d-DR.
Aim of the Study
The aim of the present study was to compare the intake of energy, macronutrients and micronutrients assessed by 7d-DR, in HIV-in-fected patients at the time of HIV diagnosis with healthy sex-aged matched controls and with the recommended dietary allowance for the healthy Italian population.
Materials and Methods
Patient selection
We identified a cohort of HIV patients (HC) consecutively referring to the Infectious Diseases Clinic of the University of Brescia (Italy) from July 2013 to September 2015. During the first encounter for HIV infection evaluation just after the diagnosis, the following data were collected directly from the patients: risk factors, country of origin, education level, employment, marital status, smoking, weight, height, body mass index (BMI) and waist circumference. All patients underwent a complete medical evaluation and the following labora-tory parameters were collected: complete cell blood count, glycaemia, total cholesterol and triglycerides, albumin, calcium, phosphorus, vitamin D, CD4+ blood count and HIVRNA level. A 7d-DR was administered to the HIV-infected patients with detailed written compilation instructions and delivered by a dietician. HIV-infected patients with concomitant opportunistic infections or other severe diseases were excluded. All patients signed a written informed consent to participate in the study and were asked to return the 7d-DR when compiled. All returned diary records were collected and reviewed by a skilled dietician to evaluate adequate fulfilment. Only adequate 7d-DRs were included in the study. Nutrient intake was calculated by using the computer programme Microdiet© Software (Downlee System Ltd. Chapel-en-le-Frith, High Peak, UK). Data were introduced in the software by a skilled dietician, and the transfer was supervised by two other investigators. A sex and aged (± 3 years) matched cohort of healthy subjects (CC) was identified for nutrient intake comparisons. The 7d-DRs of the CC were extracted from a prospectively maintained database belonging to the Gastroenterology Unit.
Nutritional Assessment and nutrient intake
We estimated the intake of energy and nutrients including proteins, fats, carbohydrates (CHO), vitamins (A, B1, B2, B6, C, D, niacin and folates), minerals (calcium, phosphorus, sodium, iron and zinc), fatty acids (oleic, linoleic and linolenic) and total dietary fibre according to the McCance composition of food tables supplied by the programme Microdiet© Software. CHOs were computed as total and simple sugars. Fats were classified as either saturated, monounsaturated (MUFA), polyunsaturated (PUFA) and trans-fatty acids. Estimation of the energy requirement to sustain minimal physical activity (basal metabolism) according to age, sex, weight and height was calculated for every participant by the Harris and Benedict formula [14]. Energy balance was then calculated as the difference between reported energy intake and calculated basal metabolism; we estimated the proportion of patients under or over reporting energy intake using a
threshold of ± 20% according to the Harris and Benedict formula [14]. The daily level of macronutrients and micronutrients intake (com-puted by Microdiet©) was compared to the two cohorts and to Italian Reference Values [15]. LARN includes different dietary reference values. i) Average Requirement (AR), which is the level of (nutrient) intake that is adequate for half of the people in a population group; ii) Population Reference Intake (PRI) which defines an adequate nutrient intake level that most individuals of a population group (97,5%) should obtain to satisfy their requirements; iii) Adequate Intake (AI) which is set when there are insufficient scientific data to establish an AR or a PRI; iv) Reference Intake range for macronutrients (RI), which is used for fats and carbohydrates; v) Suggested Dietary Target (SDT) which is the level to reduce the risk of chronic diseases in the general population.
Statistical analysis and ethical aspects
Continuous measures were expressed as mean ± SD, and categorical variables were described as absolute number and percentages. Differences in nutrient intake between the two cohorts were tested for statistical significance using unpaired t test or Mann Whitney test as appropriate, after testing normality with D’Agostino and Pearson omnibus normality test. A p value of < 0.05 was used to reject the null hypothesis. Differences from the Italian National recommendations between the two cohorts were tested with the Fisher Exact test. Linear regression was performed to test i) association between CD4 cell count and HIVRNA level at baseline (dependent variables) and main macro- and micronutrients intake (independent variables) and ii) between energy intake and BMI. The GraphPad Prism 5 statistical package (GraphPad Software, La Jolla, CA, USA) and STATA 14.2 (StataCorp LP, College Station, Texas, USA) were used for statistical analy-sis and graphs. Our Institutional ethical committee approved of the study protocol on 4 June 2013 (NP n.1404).
Results and Discussion
A total of 73 7d-DRs were delivered to HIV+ patients during the first visit after HIV-infection diagnosis; 36 HIV DRs were sent back to the dietician and 3 were excluded for inappropriate fulfilment. Therefore, 33 HIV-infected patients were included and were matched with the same number of healthy controls (Figure 1). Eighty-two percent of participants in the study were males, with a median age of 41 years (range: 20-59).
Figure 1: Flow diagram of the study. 7d-DR: Seven days - Diary Records.
The main demographic, social and clinical characteristics of HIV-infected patients at the time of diagnosis are reported in table 1. Mean BMI was 23.0 ± 3.6 (range 17.5 - 35.8) among HIV-infected patients and 25.3± 2.7 (range 21.5 - 30.3) among control subjects (p = 0.0019). Subject distribution among the BMI WHO classes is reported in figure 2. Among HIV-infected patients, 6% (n = 2) were underweight, 67% (n = 22) had a normal BMI, 24% (n = 8) were overweight and 3% were obese. No statistical differences between the two cohorts were found.
Characteristics Number (%) or Media ± SD Main risk factor for HIV acquisition
Heterosexual promiscuity Homosexual promiscuity Intravenous drug use
17 (52) 14 (42) 2 (6) Country of origin Italy Other country 27 (82)6 (18) Education completed Primary or none Secondary Tertiary 16 (49) 11 (33) 4 (12) Unemployed 5 (15) Marital status Not married Married 24 (73)9 (27) Smoking 16 (49) HCV testing positive 3 (9) BMI 23.0 ± 3.6 Waist circumference, cm 83.6 ± 9.1 Leukocyte blood count, /μL 5094 ± 1473 Neutrophil blood count, /μL 2560 ± 1080 Lymphocyte blood count, /μL 1846 ± 850 CD4 blood count, /μL [median, range] < 200 200-349.99 ≥350 378 ± 289 [328, 16-1210] 9 (27) 9 (27) 15 (46) Haemoglobin, g/dL 14.03 ± 1.36
Platelet blood count, 103/μL 185 ± 58 Total cholesterol, mg/dL Under ULN (200) 165 ± 41 25 (76) Triglycerides, mg/dL Under ULN (150) 111 ± 54 28 (85) Glucose, mg/dL Under ULN (110) 87 ± 12 31 (94) Albumin, g/dL 4.0 ± 0.4 Calcium, mg/dL 9.1 ± 0.4 Phosphorus, mg/dL 2.7 ± 0.3 Vitamin D, ng/mL Inadequacy (20-29.99) Deficiency (< 20) 23.8 ± 10.5 5 (15) 12 (36) HIV viremia, UI/mL
[median, range] [50780, 156-443700]90218 ± 108778
Figure 2: BMI distribution according to WHO classes in both cohorts. No significant statistical
difference was computed. HC: HIV Cohort; CC: Control Cohort.
Nutrient intake
The mean total energy intake was 1949 ± 373 Kcal in HIV-infected patients and 2280 ± 619 Kcal in controls (p = 0.0073). The energy balance was adequate in 61% of HIV-infected patients and 79% of controls (p = 0.18): 12% of HIV-infected patients and 3% of healthy controls under-reported and 27% of HIV-infected patients and 18 % of healthy subjects over-reported their nutrient intake (p = 0.355 and p = 0.558, respectively). Energy balance was inversely correlated to BMI among HIV patients (coeff.: -0.0033359, 95%CI -0.0060986; -0.0005733, p = 0.020), but not among healthy controls (p = 0.396).
Comparison of macronutrients dietary intake between HIV-positive patients and controls
The contribution of carbohydrates to energy in HIV-infected patients was significantly higher than in controls (48.5 ± 5.2% vs 42.7 ± 6.6%, p = 0.0002). The contribution to energy by total fats (34.2 ± 5.3% vs 36.6 ± 3.6%, p = 0.0322), MUFA, (14.0 ± 3.4% vs 17.3 ± 2.5%, p < 0.0001) and alcohol (1.5 ± 2.7% vs 5.9 ± 4.0%, p < 0.0001) was significantly lower in HIV-infected patients than in controls. No statistically significant differences between the two groups were found for rate of daily energy intake of simple sugars (14.2 ± 5.0% vs 15.2 ± 4.0%, p = 0.38), proteins (15.4 ± 2.7% vs 14.4 ± 2.9%, p = 0.16) and PUFA (3.8 ± 1.9% vs 4.0 ± 0.7%, p = 0.16). The mean dietary intake of dietary fibre was similar in the two groups (15.0 ± 4.0 grams per day vs 14.1 ± 4.0 grams per day, p = 0.56). Despite the national recommendations against trans fat consumption (SDT), we observed in our study that 33% of HIV-infected patients vs. 6% of controls introduced trans-fat into the diet (0.050 g/die vs. 0.022 g/die respectively, p = 0.012).
Comparison of macronutrients dietary intake in the two cohorts with Italian reference values
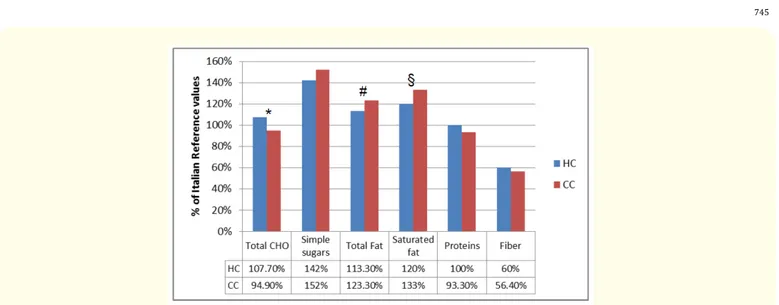
Both HIV-infected patients and controls consumed more simple sugars, total fat, and saturated fat and less fibres than the LARN recom-mended. Statistically, HIV patients consumed significantly less total and saturated fats (113.3% vs 123.3%, p = 0.032 and 120% vs 133%, p = 0.02 of Italian reference value, respectively) and more total CHO than controls (107.7% vs 94.9% p = 0.0002 of Italian reference value). In table 2 the proportions of participants in the two cohorts in whom the recommended levels of macronutrients were achieved are reported. Energy intake of most macronutrients was within the LARN guidelines in less than 25% of participants, without differences between both cohorts, except for CHO. CHO comprising 45-50% of energy intake (LARN recommended value) was achieved in 76% of HIV-infected patients vs 42% of controls (p = 0.011).
Figure 3: Macronutrients intake compared to Italian reference values (LARN). 100% correspond to Italian reference values.
Symbols above the bars show significant differences between HIV cohort (HC) and Control Cohort (CC): * p = 0.0002; # p = 0.0322; § p = 0.0276. CHO: Carbohydrates.
Energy as, reference value HC n (%) CC n (%) p
Total fat, < 30% (RI) 6 (18) 1 (3) 0.1048
Saturated fat, < 10% (SDT) 7 (21) 2 (6) 0.0878
Total PUFA, 5-10% (RI) 4 (12) 5 (15) 1.0000
PUFA n-6, 4-8% (RI) 5 (15) 4 (12) 1.0000 PUFA n-3, 0.5-2% (RI) 1 (3) 2 (6) 1.0000 CHO, 45-60% (RI) 25 (76) 14 (42) 0.0116 Simple sugars, < 10% (SDT)>25% (SDT)* 6 (18) 2 (6) 1 (3) 1 (3) 0.1048 1.0000 Fiber, 12,6-16,7g/1000Kcal 0 (0) 0 (0)
-Protein, 50-63/43-54g/die (AR men/women) 7 (21) 3 (9) 0.3034
Table 2: Comparison of energy intake of macronutrients in both cohorts with national daily reference value (LARN).
*Exceeding this level is potentially linked to adverse events. HC: HIV Cohort; CC: Control Cohort; RI: Reference Intake range for macronutrients; SDT: Suggested Dietary Target; AR: Average Requirement; PUFA: Polyunsaturated Fatty Acids; CHO: Carbohydrates.
Comparison of micronutrients dietary intake between the two cohorts and with Italian reference values
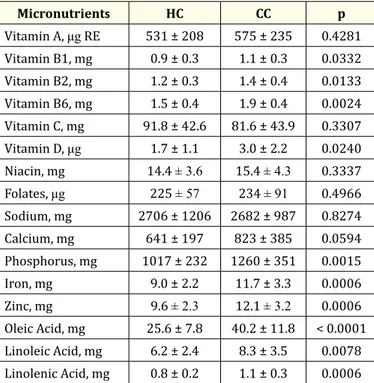
Except for Vitamin A, Vitamin C, Niacin, folates, sodium and calcium, HIV-infected patients reported lower consumption levels for vita-mins, minerals and omega fats than matched controls (p < 0.05). Detailed amount of intake is reported in table 3.
Comparing micronutrients intake in HIV-infected and reference daily values, we found that more than half of HIV patients did not meet national criteria for dietary intake level of Vitamin A (82%), Vitamin B1 (82%), vitamin B2 (91%), vitamin D (100%), folates (97%), so-dium (82%) and zinc (70%). Details are reported in table 4.
Micronutrients HC CC p Vitamin A, μg RE 531 ± 208 575 ± 235 0.4281 Vitamin B1, mg 0.9 ± 0.3 1.1 ± 0.3 0.0332 Vitamin B2, mg 1.2 ± 0.3 1.4 ± 0.4 0.0133 Vitamin B6, mg 1.5 ± 0.4 1.9 ± 0.4 0.0024 Vitamin C, mg 91.8 ± 42.6 81.6 ± 43.9 0.3307 Vitamin D, μg 1.7 ± 1.1 3.0 ± 2.2 0.0240 Niacin, mg 14.4 ± 3.6 15.4 ± 4.3 0.3337 Folates, μg 225 ± 57 234 ± 91 0.4966 Sodium, mg 2706 ± 1206 2682 ± 987 0.8274 Calcium, mg 641 ± 197 823 ± 385 0.0594 Phosphorus, mg 1017 ± 232 1260 ± 351 0.0015 Iron, mg 9.0 ± 2.2 11.7 ± 3.3 0.0006 Zinc, mg 9.6 ± 2.3 12.1 ± 3.2 0.0006 Oleic Acid, mg 25.6 ± 7.8 40.2 ± 11.8 < 0.0001 Linoleic Acid, mg 6.2 ± 2.4 8.3 ± 3.5 0.0078 Linolenic Acid, mg 0.8 ± 0.2 1.1 ± 0.3 0.0006
Table 3: Mean level of micronutrients intake in both cohorts.
HC: HIV Cohort; CC: Control Cohort; RE: Retinol Equivalents.
Reference value for deficient
intake recommendation n (%)HC not meeting LARN recommendation, n (%)CC not meeting LARN p
Vitamin A < 700 μgRE ♂< 600 μgRE ♀ (PRI) 27 (82) 24 (73) 0.5580
Vitamin B1 < 1.2 mg ♂< 1.1 mg ♀ (PRI) 27 (82) 23 (70) 0.2696 Vitamin B2 < 1.3 mg ♂< 1.1 mg ♀ (AR) 30 (91) 22 (67) 0.0326 Vitamin B6 < 1.3 mg (PRI) 10 (30) 5 (15) 0.2396 Vitamin C < 75 mg ♂< 60 mg ♀ (AR) 11 (33) 16 (48) 0.3167 Vitamin D < 10 μg (AR) 33 (100) 33 (100) -Niacin < 14 mg (AR) 16 (48) 14 (42) 0.8050 Folates < 320 μg (AR) 32 (97) 30 (91) 0.6132 Sodium >1500 mg (AI) 27 (82) 31 (94) 0.2576 Calcium < 700 mg (AR) 18 (55) 14 (42) 0.0283 Phosphorus < 700 mg (AI) 3 (9) 1 (3) 0.6132 Iron < 7 mg ♂< 10 mg ♀ (AR) 7 (21) 4 (12) 0.3478 Zinc < 11 mg ♂< 8 mg ♀ (PRI) 23 (70) 10 (30) 0.0028
Table 4: Proportion of HIV-infected patients and controls with deficient intake of
micronutrients according to national reference range (LARN). HC: HIV Cohort; CC: Control Cohort; RE: Retinol Equivalents; PRI: Population
After performing linear regression analysis between CD4 count and HIVRNA level (dependent variables) and all analysed macro and micronutrients, we found a statistical inverse correlation between CD4 count and amount of simple sugars in diet (coeff. = -0.9775071, 95% CI = -1.927213--.0278009, p = 0.044).
Discussion
This study showed that nutrient intake, in both cohorts (HIV-infected patients and controls) did not meet Italian dietary intake gui-delines for simple sugars, total and saturated fats, fibre and for almost all micronutrients. Moreover, our study highlights that nutritional choices were healthier among HIV-infected patients at the time of HIV diagnosis than in controls for lower levels of saturated fats (12% vs 13.3%; p = 0.02), MUFA (14% vs 17.3%; p < 0.001) and quantity of alcohol (1.5% vs 5.9% p < 0.001). However, HIV-infected patients reported a higher level of trans-fatty acids intake and a lower level of intake of most minerals, vitamins and omega fats than controls.
In the collective imagination, HIV infection is often associated with weight loss and wasting and probably at the time of HIV diagnosis, the fear of disease may lead to favourable changes in regard to healthy lifestyle habits as diet and alcohol consumption that patients think may interfere with disease progression. To our knowledge, no dietary data are present in literature on eating habits at the time of HIV diagnosis. Several studies have highlighted how patients frequently received health advice, including dietary information, after a life-thre-atening diagnosis [16-18]. No nutritional support is usually provided to HIV-infected patients in clinical practice at the first HIV-specialist visit. Therefore, patients probably search for information on healthy life-style out of the medical setting, and not always receive correct advice. Studies performed in HIV-infected patients on stable cART showed that only 12-23% of them have a healthy diet [12,19].
In our study, 61% of HIV-infected patients showed a correct energy balance (difference between dietary energy intake and basal metabolism) and almost one third of patients over-reported their nutrient intake. Data are congruent with the BMI distribution among HIV-infected patients (67% of HIV-infected patients had a normal BMI). Energy balance was inversely correlated to BMI in HIV-infected patients but not in controls. Under- and over-reporting of energy intake is strongly associated with BMI and attitudes about body weight [20]. More studies are needed to understand if over-reporting of energy intake by HIV-infected patients with low BMI at time of HIV dia-gnosis was transitory and due to the desire for weight increase in that critical moment of their life (HIV-infection diadia-gnosis).
The majority of HIV-infected individuals gains weight with cART initiation, reflecting a slowing down of resting energy expenditure with suppressed virus level, as well as a signal of return to health [21]. Koethe., et al. described in a cohort of HIV-infected patients that 22% of HIV-infected patients with a normal BMI (18.5 - 5) at cART initiation become overweight after 3 years of treatment, and 18% of those overweight become obese [22]. Continued weight gain over time has resulted in an increased prevalence of obesity among HIV-in-fected persons in both resource-rich and resource-limited settings [23,24] and weight gain among normal weight HIV-inHIV-in-fected individuals may exacerbate risk of comorbidity [25]. Obtaining a balance between healthy weight and high quality dietary habits among HIV-infected may be a challenge among HIV patients.
Energy contribution of macronutrients in the control group was similar to a recent Italian food consumption survey that confirms that, in Italy, as in other industrialized countries, fat intake is too high whereas the intake of complex carbohydrates is low [26]. However, HIV patients at the time of HIV diagnosis seem to pay attention to their nutrition, especially regarding quantity of total fats and alcohol intake, although this care is probably not sufficient to provide them with a complete, balanced and healthy diet.
Focusing on fats, HIV-infected patients reached the goal of lowering saturated fats in their diet, probably because the information is easily available in facts sheets, but they increased the intake of trans-fat acids, which are strongly associated with many negative effects on health (risk of cardiovascular disease, metabolic disorders, insulin resistance and even cancer) [27]. Moreover, they reported low intake of omega fat acids, which are clearly associated to a reduction of cardiovascular risk [28]. Ninety percent of HIV patients in this study had a low educational level, which is associated with unhealthy dietary choices in the general population [29].
Another error in dietary habits emerging in our study and present in both HIV and controls, is the inadequate fibre intake: no one in both cohorts reached the reference recommended values. The well-known protective impact of dietary fibre against functional and orga-nic gastrointestinal diseases, including colon cancer, obesity, diabetes, stroke, hypertension and other cardiovascular diseases, must be taken into account in both HIV and non-HIV subjects for its impact on quality and expectancy of life [30].
Regarding micronutrients intake, HIV-infected patients and controls consumed a similar amount of sodium but exceeding by far the LARN recommendation [15] (2706 ± 1206 mg/day and 2682 ± 987 mg/day respectively vs SDT level of 2000 mg/die). Eighty-two percent of HIV infected patients and 94% of controls consumed more sodium than recommended, which represents a potential risk factor for hypertension, osteoporosis, stroke and cardiovascular diseases [31,32].
An inappropriate calcium, phosphorus and vitamin D intake (lower than reference values) has been previously described in patients on stable cART [33,34]. The presence of suboptimal dietary intake of these micronutrients before they even started cART, as our data supported, can emphasize the adverse effects of therapy when started and can contribute to the high prevalence of low bone mineral density in HIV patients [35,36]. Implementation of nutritional intervention targeted at increasing calcium-rich foods intake is mandatory as well as more awareness among care-givers in reducing dairy products with high lipid content to counteract increasing cardiovascular risk [37]. According to recent reviews on the connection between vitamin D and health, the available evidence supports a role of vitamin D deficiency in skeletal problems, but not in extra-skeletal chronic diseases [38]. Even if the current guidelines do not support treatment of chronic diseases with supplementation of vitamin D, the treatment of vitamin D deficiency is suggested for the prevention of chronic diseases [39]. The role of vitamin D supplementation in HIV patients in order to reduce the risk of skeletal and extra-skeletal chronic co-morbidities is an open issue that should be addressed in further clinical trials.
In general, the multiple micronutrient deficiencies both in HIV-infected patients and controls, as highlighted in our study, are a part of the global problem of “hidden hunger” among the population [40]. This problem must be addressed as a national health priority and detailed strategies are needed for its prevention and control.
In the interpretation of our results, the following limitations should be considered. Firstly, all dietary data were self-reported, there may be some misclassification due to inadequate reporting and no evaluation was made of individual energy expenditure due to physical activity. No information was available on dietary habits before HIV diagnosis and we were unable to explore the influence of HIV diagnosis on dietary practices. Lastly, the study is based on a small sample size.
Our study also has several strengths. Firstly, to our knowledge, this is the only nutritional study on HIV-infected patients using a 7d-DR, which can minimize the intake pattern variation from day to day. Secondly, we compared nutritional intake of patients at the time of HIV diagnosis with a group of sex-aged matched healthy subjects and National guidelines. Finally, this is the first study that evaluates nutri-tional habits among HIV patients in a clear-cut and peculiar moment of their illness: the time of diagnosis. The psychological distress of receiving an HIV diagnosis was previously studied [41]: the awareness of previous incorrect behaviours may lead to a new consciousness and the pursuit of healthy life-style changes.
Conclusion
In conclusion, nutritional assessment and personally addressed dietary advice should be part of HIV care and counselling, starting from the time of diagnosis. A healthy diet can modify the risk factors related to many of the chronic emerging illnesses in patients with HIV infection as obesity, diabetes, hypertension or osteoporosis, improving both life quality and expectancy. On the whole, our data sug-gest that HIV-infected patients should be enrolled in a nutritional surveillance plan starting from the time of diagnosis in order to prevent comorbidity with correct dietary advice.
Acknowledgements
We kindly thank Mirna De Gregori for her valuable help and kind assistance. The study was partly funded by Gilead Fellowship Pro-gram, 2015 edition.
Bibliography
1. Smit M., et al. “Future challenges for clinical care of an ageing population infected with HIV: a modelling study”. The Lancet Infectious Diseases 15.7 (2015): 810-818.
2. Noncommunicable diseases and their risk factors.
3. Dietz WH., et al. “Chronic Disease Prevention: Tobacco Avoidance, Physical Activity, and Nutrition for a Healthy Start”. JAMA 316.16 (2016): 1645-1646.
4. Lorenc A and Robinson N. “A review of the use of complementary and alternative medicine and HIV: issues for patient care”. AIDS Pa-tient Care and STDSs 27.9 (2013): 503-510.
5. Carter GM., et al. “Probiotics in Human Immunodeficiency Virus Infection: A systematic review and evidence synthesis of benefits and risks”. Open Forum Infectious Diseases 3.4 (2016): ofw164.
6. Fields-Gardner C and Ayoob KT. “Position of the American Dietetic Association and Dietitians of Canada: nutrition intervention in the care of persons with human immunodeficiency virus infection”. Journal of the American Dietetic Association 100.6 (2000): 708-717. 7. Fields-Gardner C and Campa A. “American Dietetics Association. Position of the American Dietetic Association: Nutrition Intervention
and Human Immunodeficiency Virus Infection”. Journal of the American Dietetic Association 110.7 ( 2010): 1105-1119. 8. Winnick A., et al. “Guidelines for nutrition support in AIDS”. Nutrition 5 (1989): 39-46.
9. Krales E. “Setting standards”. Body Positive 13 (2000): 4.
10. Klassen K and Goff LM. “Dietary intakes of HIV-infected adults in urban UK”. European Journal of Clinical Nutrition 67.8 (2013): 890-893.
11. Abioye AI., et al. “Gender differences in diet and nutrition among adults initiating antiretroviral therapy in Dar es Salaam, Tanzania”. AIDS Care 27.6 (2015): 706-715.
12. Duran AC., et al. “Diet quality of persons living with HIV/AIDS on highly active antiretroviral therapy”. Journal of Human Nutrition and Dietetics 21.4 (2008): 346-350.
13. Willet W. “Nutritional epidemiology”. Chapter 4. Oxford University Press. Third edition (2013).
14. Harris JA and Benedict FG. “A biometric study of basal metabolism”. Proceedings of the National Academy of Sciences of the United States of America 4.12 (1918): 370-373.
15. Società Italiana di Nutrizione Umana (SINU). Livelli di Assunzione di Riferimento di Nutrienti ed Energia per la Popolazione Italiana (LARN). IV revisione. Milan, SICS, Italy (2014).
16. Molfino A., et al. “Effect of intensive nutritional counseling and support on clinical outcomes of hemodialysis patients”. Nutrition 28.10 (2012): 1012-1015.
17. DeBusk RF., et al. “A case-management system for coronary risk factor modification after acute myocardial infarction”. Annals of In-ternal Medicine 120.9 (1994): 721-729.
Conflict of Interest
The authors declare no conflict of interest. The founding sponsors had no role in the design of the study; in the collection, analyses, or interpretation of data; in the writing of the manuscript, and in the decision to publish the results.
18. Kassianos AP., et al. “Perceived influences on post-diagnostic dietary change among a group of men with prostate cancer”. European Journal of Cancer Care 24.6 (2015): 818-26.
19. Kruzich LA., et al. “HIV-infected US youth are at high risk of obesity and poor diet quality: a challenge for improving short- and long-term health outcomes”. Journal of the American Dietetic Association 104.10 (2004): 1554-1560.
20. Johansson L., et al. “Under- and over-reporting of energy intake related to weight status and lifestyle in a nationwide sample”. The American Journal of Clinical Nutrition 68.2 (1998): 266-274.
21. Yuh B., et al. “Weight change after antiretroviral therapy and mortality”. Clinical Infectious Diseases 60.12 (2015): 1852-1859.
22. Koethe JR., et al. “Rising obesity prevalence and weight gain among adults starting antiretroviral therapy in the United States and Canada”. AIDS Research and Human Retroviruses 32.1 (2016): 50-58.
23. Crum-Cianflone N., et al. “Increasing rates of obesity among HIV-infected persons during the HIV epidemic”. PLOS ONE 5.4 (2010): e10106.
24. Boodram B., et al. “Prevalence and correlates of elevated body mass index among HIV-positive and HIV-negative women in the Wom-en’s Interagency HIV Study”. AIDS Patient Care and STDs 23.12 (2009): 1009-1016.
25. Herrin M., et al. “Weight Gain and Incident Diabetes among HIV Infected-Veterans Initiating Antiretroviral Therapy Compared to Un-infected Individuals”. JAIDS Journal of Acquired Immune Deficiency Syndromes 73.2 (2016): 228-236.
26. Sette S., et al. “The third Italian National Food Consumption Survey, INRAN-SCAI 2005-06--part 1: nutrient intakes in Italy”. Nutrition, Metabolism and Cardiovascular Diseases 21.12 (2011): 922-932.
27. Calder PC. “Functional Role of Fatty Acids and Their effects on Human Health”. Journal of Parenteral and Enteral Nutrition 39 (2015): 18S-32S.
28. Khaw KT., et al. “Plasma phospholipid fatty acid concentration and incident coronary heart disease in men and women: the EPIC-Norfolk prospective study”. PLOS Medicine 9.7 (2012): e1001255.
29. De Irala-Estevez J., et al. “A systematic review of socio-economic differences in food habits in Europe: consumption of fruit and veg-etables”. European Journal of Clinical Nutrition 54.9 (2000): 706-714.
30. Otles S. “Health effects of dietary fiber”. Acta Scientiarum Polonorum, Technologia Alimentaria 13.2 (2014): 191-202.
31. Park SM., et al. “Effect of high dietary sodium on bone turnover markers and urinary calcium excretion in Korean postmenopausal women with low bone mass”. European Journal of Clinical Nutrition 69.3 (2015): 361-366.
32. Rust P and Ekmekcioglu C. “Impact of Salt Intake on the Pathogenesis and Treatment of Hypertension”. Advances in Experimental Medicine and Biology 956 (2016): 61-84.
33. Ziegler TR., et al. “Habitual nutrient intake in HIV-infected youth and associations with HIV-related factors”. AIDS Research and Human Retroviruses 30.9 (2014): 888-895.
34. Sales SH., et al. “High frequency of deficient consumption and low blood levels of 25-hydroxyvitamin D in HIV-1-infected adults from São Paulo city, Brazil”. Scientific Reports 5 (2015): 12990.
35. Brown TT and Mallon PW. “Editorial: Working towards an understanding of bone disease in HIV”. Current Opinion in HIV and AIDS 11.3 (2016): 251-252.
Volume 14 Issue 9 September 2019
©All rights reserved by Barbara Zanini., et al.
36. Escota GV., et al. “High Prevalence of Low Bone Mineral Density and Substantial Bone Loss over 4 Years Among HIV-Infected Persons in the Era of Modern Antiretroviral Therapy”. AIDS Research and Human Retroviruses 32.1 (2016): 59-67.
37. Galli L., et al. “Optimal dietary calcium intake in HIV treated patients: no femoral osteoporosis but higher cardiovascular risk”. Clinical Nutrition 33.2 (2014): 363-366.
38. Al Nozha OM. “Vitamin D and extra-skeletal health: causality or consequence”. International Journal of Health Sciences 10.3 (2016): 443-452.
39. Muscogiuri G., et al. “Vitamin D and chronic diseases: the current state of art”. Archives of Toxicology 91.1 (2016): 97-107.
40. Nair MK., et al. “Food-Based Interventions to Modify Diet Quality and Diversity to Address Multiple Micronutrient Deficiency”. Fron-tiers in Public Health 3 (2016): 277.
41. Nightingale VR., et al. “The Impact of Receiving an HIV Diagnosis and Cognitive Processing on Psychological Distress and Posttrau-matic Growth”. Journal of TrauPosttrau-matic Stress 23.4 (2010): 452-460.