Implementing DFSS to increase the performance
level of an extrusion process
Francesco Aggogeri* and Marco Mazzola
Department of Mechanical and Industrial Engineering,University of Brescia, via Branze 38, 25123 Brescia, Italy Fax: 00390303702448 Email: [email protected] Email: [email protected] *Corresponding author
James O’Kane
Business School, Staffordshire University, Leek Road, Stoke-on-Trent, ST4 2DF, UKEmail: james.o’[email protected]
Abstract: A company that wants to compete in the market must operate
deploying flexibility, minimising production costs, speeding up processes and assuring a high-quality level of output. For these reasons it is necessary to apply innovative and structured methodologies able to suggest techniques and methods to design, organise and manage industrial processes. Design for Six Sigma (DFSS) represents one of the most effective methods to attain increases in business performance and customer satisfaction using a smart problem-solving method (DMADV). This paper shows an implementation of a DFSS project in a SME to improve the performance level of the extrusion process. The authors demonstrate an effective approach that is able to design and reach Six Sigma level process, by applying project management, brainstorming and statistical (ANOVA, DOE) tools. The economical analysis justifies the application of this method in order to improve the performance level of a manufacturing process.
Keywords: DFSS; DMADV; extrusion process; design of experiment. Reference to this paper should be made as follows: Aggogeri, F., Mazzola, M.
and O’Kane, J. (2009) ‘Implementing DFSS to increase the performance level of an extrusion process’, Int. J. Six Sigma and Competitive Advantage, Vol. 5, No. 1, pp.10–28.
Biographical notes: Francesco Aggogeri, graduated in Industrial Engineering,
is currently Assistant Professor at University of Brescia. He is certified Six Sigma Black Belt. His research subjects are implementation of improvement methodologies (Six Sigma, Lean Six Sigma and Scor), production systems and quality management. He teaches Operations Management at Mechanical and Industrial Engineering Faculty of University of Brescia.
Marco Mazzola is Research Assistant at the Department of Mechanical and Industrial Engineering of the University of Brescia. His main research subjects are reliability & maintainability analysis, micro-manufacturing and development of methodologies for process improvement.
James O’Kane is Faculty Director of Staffordshire University Business School, Staffordshire University, UK, and he is a Professor of Operations Management. His main research interests are business modelling, quality management and automotive supply chain management.
1 Introduction
The current dynamism and competition of the manufacturing market have imposed high performance levels. Quality standards, prompt delivery, elevated customer satisfaction and introduction of new innovative products and services are basic for business company success (Juran and Godfrey, 1999). Design for Six Sigma (DFSS) can be a strategic methodology to gain all these goals. Nevertheless, the implementation of these management philosophies means a wide reorganisation of a company, by adopting a continuous improvement logic and assuring severe changes in fields (Mazzola et al., 2007).
The application of DFSS attempts to create an output, exactly as desired by the customer, by internally removing all the potential source of defects and reducing non-value activities from the value stream. The major goal of DFSS is to ‘design it right the first time’ to avoid painful downstream experiences (Yang and El-Haik, 2003). The term ‘Six Sigma’ defines the metric and the goals that a company should reach to obtain excellent results. The goal is ‘to produce at least 99.99966% “quality” at “the process step” or part level within assembly’ (Stamatis, 2002a; Basu and Wright, 2004). This means no more than 3.4 defects per million parts or process steps if the process has a shift of as much as 1.5 in the long run. The Six Sigma metric is that the quality level of a process/system assures indicator values for Pp and Ppk requirement of 2.0 and 1.5, respectively. In order to undertake this, a company should ‘put the customer first and use data and facts to drive a better solution’ (Pande and Holpp, 2002; Pyzdek, 2003). However, there are several differences between the well-known Six Sigma methodology (Adams et al., 2003) and DFSS (Yang and El-Haik, 2003). It is possible to use the Six Sigma methodology, following the DMAIC (define, measure, analyse, improve and control) problem-solving method, when the processes or the systems are already existing, while it is preferable to apply DFSS in designing processes capable of reaching Six Sigma levels; thus it is considered a more aggressive quality approach design process (Shahin, 2008). DFSS focuses on the creation of new value, with inputs from customers, suppliers and business needs. A traditional Six Sigma application develops improvement actions on existing processes but does not design new processes or systems in order to reach excellence results. For these reasons DFSS can be considered an emerging business-process management methodology that is able to design or modify processes, products or services meeting customer requirements and driving down COPQs (Cost of Poor Quality) (De Feo and Barnard, 2004). The DFSS implementation is developed by a project and is coordinated by a heterogeneous team that can involve the
whole organisation in order to reach decelerated goals. DFSS follows a rigorous problem-solving method characterised by five phases: define, measure, analyse, design and verify – DMADV (Yang and El-Haik, 2003).
2 DMADV roadmap
DFSS represents one of the more dynamic and innovative programmes of management to improve quality of products and efficiency of manufacturing processes.
DFSS is a disciplined and rigorous technique that guarantees significant changes of company results using effective tools for operations and organisational activities. This approach has not only the goal to design new processes, but also to create awareness, in every employee, of a new technique to act upon and to consider industrial improvement (Stamatis, 2002b; Yang and El-Haik, 2003).
The key methodology concept is to design new processes and avoid defects with a high-performance level using information data provided by existing processes (George, 2002).
In this section, the DMADV features are explained briefly. The DMADV is a five-step method for designing new processes, products or services, or completely redesigning ones that already exist (Ginn and Varner, 2004).
The first phase (define) is to develop a clear definition of the project that includes economical impact, risk management plans and possible organisational change activities. It is also important to draft a project charter that highlights business care, goals and objectives, involved processes, milestones, team memberships and a project timetable. The need of DFSS implementation should rise from a detailed study of market requirements in order to understand the VOC (Voice of the Customer). The identification of the VOC can seem a simple step. Nevertheless it is a difficult and decisive step to reach the goals. For example, a necessary milestone, often neglected, is to define the client of the process or system that we want to improve. The customer is not only the final user, but represents the totality of entities that are downstream of a department or a process that we are analysing. Therefore, a customer can be a person, a company, a function, a process or an activity that can be located in different positions of a supply chain. VOC enables one to know those features of an organisation that have an immediate impact on customer satisfaction. If an organisation discovers its weak points, it can design and plan priorities of improvement and, as a consequence, create a significant increase of the level of satisfaction in a short time. However, in a global evaluation it is necessary to compare the VOC analysis with the VOP (Voice of the Process), when processes or the systems are already in existence. The deliverables of the define phase are a list of critical aspects (CTQs) that are the input of the measurement step (Aggogeri and Gentili, 2008).
In fact, the second phase of the DFSS implementation is to collect information and data concerning the manufacturing systems, if they are already existing, or similar processes if we want to create a new system/product. In this step, the team project has to define the main KPIs (Key Performance Indicators) and effective data collection sheets.
The analysis phase is based on the evaluation of data information to generate a range of concepts, as well as ideas of solutions for the process, product or service that best meet the CTQs related to budget and resource constraints. The project team can use qualitative tools (i.e. brainstorming sessions or advanced statistical analysis) to identify the main variability or defect factors (Montgomery, 1990a; Montgomery, 1990b; Oakland, 2003).
In the light of theses considerations the team members can answer questions such as: ‘how every design element is needed’ or ‘how every design element should performed to help to select the most appropriate design alternatives and combinations for implementation’. Design of Experiment (DOE), response surfaces, failure mode and effects analysis or reliability design are the main effective tools for reaching these results. In particular, this paper focuses on the power of DOE in developing a DFSS project. It uses a statistical method to find the cause-and-effect relationship between ‘response’ (output) and ‘factors’ (inputs). This relationship is derived from empirical modelling of experimental data. DOE can also be used to conduct data analysis to get other valuable information such as identification and ranking of factors. The roadmap to design the experiments is divided into the following steps: selection of response variable, choice of factors, levels and ranges, selection of an experimental design, perform the experiment and analysis of DOE data (Montgomery, 1990b; Schmidt and Launsby, 1997).
The last phase is to verify that the obtained results satisfy the defined goals. This part should be supported by a creation of a storyboard of projects and a sharing of the results with process owners and operators.
3 Project statement
This project has been developed in a manufacturing SME that is a known leader in brass extruded and drawn pieces. The company has invested in innovation technologies and human resources in order to increase its product portfolio, persevering in supplying special products suitable for different requirements and applications. The SME has two manufacturing sites, located in the northeast of Italy and has 110 employees of which 80 are operators. The production volume is 33,000 tons per year of brass bars. In 2006, sales were 79 millions of Euro. Its main brass and scrap suppliers are located in East Europe and Asia while it has customers in different parts of the world. Its integrated manufacturing systems are characterised by a significant number of mechanical processes and activities.
This project rose from a significant need of the company top management to review and design the manufacturing system to satisfy new customer requirements. In particular, a change of production volume per item suggested the application of a methodology that was able to discard the existing processes and substitute them with radical new ones in terms of machine parameters, conditions, operators, methods and raw materials. The utilisation of the DMAIC (i.e. traditional Six Sigma approach) did not guarantee the achievement of these results focusing on constant and continuous incremental improvements (Chowdhury, 2003). In this case, it was felt that the best solution was to apply a methodology that was capable of analysing and reviewing historical data and information leading to redesigning and modifying the system towards Six Sigma levels. For this reason DFSS represented the most appropriate programme that would satisfy company needs. The main critical manufacturing process was the billet extrusion characterised by a significant number of parameters and variables. Using a DFSS programme it was possible to investigate, understand and design a new extrusion process reaching Six Sigma levels. The definition of the project goals has been supported by creation of a heterogeneous team constituted by a group of employees with a positive attitude for continuous improvement. The team included the production manager, a person of quality department, the maintenance manager, two operators and a financial
analyst. These staff were namely change agents and should be the reference for the organisation during the deployment of the project. The project has taken 10 months to complete.
3.1 Define
The core business of the project company is the realisation of brass bars with different profiles (rectangular, square, hexagon and round). Brass bars are the main raw material of the complex manufacturing system. Starting with a brass bar it is possible to obtain a significant number of final products. The main technical customer requirements are dimensional tolerance satisfaction, correct chemical features and absence of scratches and general damages on bars. The first step of the project was a global review of the manufacturing system in order to understand the main Critical to Quality features. Using effective tools (i.e. correlation matrix, Process FMEA) it was possible to identify that extrusion represented the main process on which the team had to focus for increasing the performance levels.
Extrusion is defined as the process of shaping material by forcing it to flow through a shaped opening in a die. Extruded material emerges as an elongated piece with the same profile as the die opening. Press size determines how large of an extrusion can be produced. The quality of the final product (brass bar) is defined by different factors, in particular the temperature of the billet and the speed, the feed, the maintenance or the temperature of the die. In fact, in extrusion a wide variety of shapes can be extruded, but there are limiting factors to be considered. These include size, shape, alloy, extrusion ratio, tongue ratio, tolerance, finish, factor and scrap ratio. If a part is beyond the limits of these factors, it cannot be extruded successfully (Davis and Semiatin, 1989; El Wakil, 1989; Kalpakjian and Schmid, 2006). The SME had a 2800 ton indirect extrusion press. Indirect extrusion is a process in which the billet remains stationary while the die assembly located on the end of the ram, moves against the billet with an appropriate speed creating the pressure needed for metal to flow through the die.
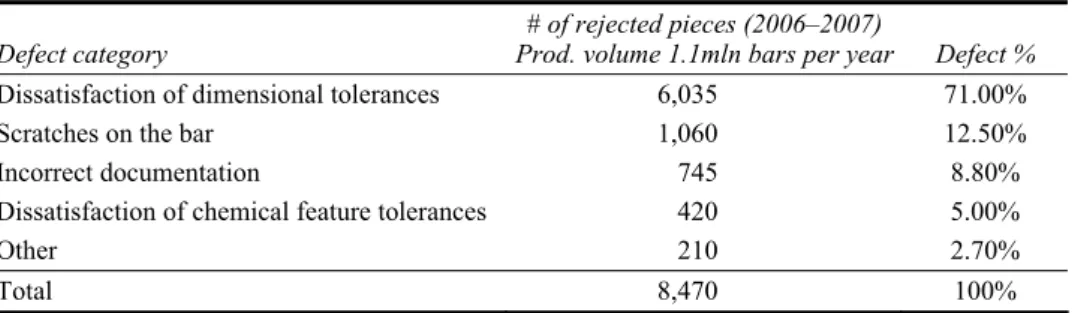
A rigorous definition of the VOC of the extrusion process represented a fundamental step to understand ‘how’ the extrusion process may be modified and redesigned. Using internal company reports and complaints a collection of the main defect categories was developed. With a typical production volume of 1.5 million of bars from January 2006 to June 2007, the DFSS team highlighted the following Critical to Customer (CTCs) features: dissatisfaction of dimensional tolerances, scratches on the bar, incorrect documentations and dissatisfaction of chemical feature tolerances. In particular, analysing data and information the team calculated the total yield and the different defect percentages, as shown in Table 1 and Figure 1.
Table 1 VOC vs. VOP
Defect category Prod. volume 1.1mln bars per year# of rejected pieces (2006–2007) Defect %
Dissatisfaction of dimensional tolerances 6,035 71.00%
Scratches on the bar 1,060 12.50%
Incorrect documentation 745 8.80%
Dissatisfaction of chemical feature tolerances 420 5.00%
Other 210 2.70%
Based on the complaint analysis, the yield was 89.3%. However, using a melting process at the top of the value stream, this company could reuse the scraps covering a significant part of costs due to rejected pieces.
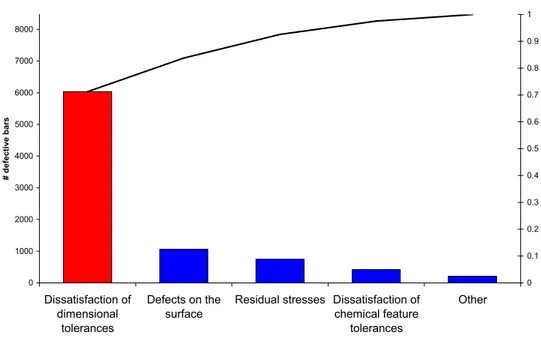
Figure 1 Pareto diagram of defect categories (see online version for colours)
0 1000 2000 3000 4000 5000 6000 7000 8000 Dissatisfaction of dimensional tolerances Defects on the surface
Residual stresses Dissatisfaction of chemical feature tolerances Other # d ef ect ive b ar s 0 0.1 0.2 0.3 0.4 0.5 0.6 0.7 0.8 0.9 1
In order to deploy an effective performance-level analysis, it was important to define the main critical items on which the team had to focus to calculate process capability (Montgomery, 1990a; Oakland, 2003). In fact, the company uses different items of brass bars and a prioritisation was fundamental in order to develop the DFSS tools and obtain an immediate increase of the system performance level. In particular, the top management had defined a significant increase of the production volume for T26. For this reason the team has developed the improvement tools considering the item ‘T26’.
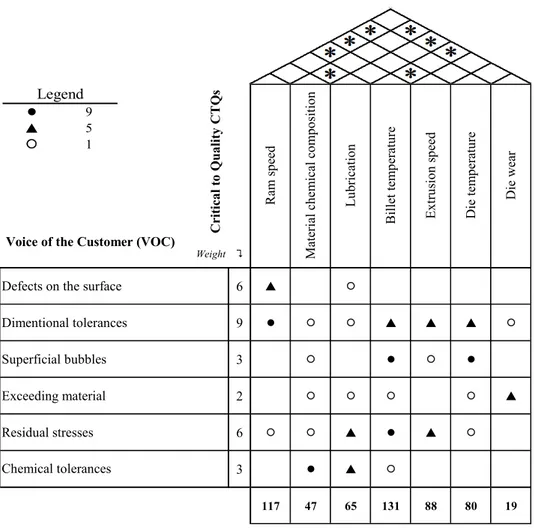
In order to deploy an effective measurement activity, it was necessary to qualitatively identify the main critical aspects of the extrusion process. Following this, the DFSS team implemented the Quality Function Deployment (QFD) methodology (Re Velle et al., 1998), resulting in a correlation matrix (Figure 2).
The QFD followed four phases:
• the presentation of the project to other involved staff using the historical collected data and information already available
• the identification of the Customer Axis: the team determined market requirements using the voice of the customer analysis
• the determination of the Technical Axis by applying process mapping tools and capability indicators. The team identified those technical features that were critical to satisfy the customer targets
• the calculation of Critical to Quality features by adopting the relationship matrix. This step was fundamental to create a prioritisation to increase the performance level of the system. The relationships are shown at the intersection of the ‘what’ and ‘how’, using different symbols. The team calculated ‘how much’ for each ‘how’ by multiplying every symbol rank with the importance of weightings in each column. In this way, the team identified two main CTQ features.
Figure 2 Correlation matrix
Weight " 6 S { 9 { { S S S { 3 { { 2 { { { { S 6 { { S S { 3 S { 117 47 65 131 88 80 19 Chemical tolerances L ubri cat io n Dimentional tolerances Superficial bubbles Residual stresses Ma te ria l c he m ic al c om position Exceeding material Cr it ic al t o Q u ality CTQ s
Voice of the Customer (VOC)
Ram
sp
ee
d
Defects on the surface
Di e t em perat ur e Bi lle t te m pe ra ture Die wea r E xtr us ion s pe ed 9 S 5 { 1 Legend 3.2 Measure
The second step of the DMADV roadmap was the Measure phase. The team focused on the extrusion process verifying the performance level and mapping the main activities. IPO of Figure 3 shows the main inputs of the extrusion process.
Figure 3 Extrusion process IPO (see online version for colours)
In order to study and analyse the extrusion process, the DFSS team developed an efficient data collection sheet. From the beginning of the DFSS project, it was fundamental to know the main factors that should be monitored. Involving the operators and the main staff of the production department in a brainstorming meeting, the team defined a data sheet considering new elements and variables and eliminating obsolete data from the old format. The DFSS team focused on four fundamental aspects of the process: die, temperature, ram speed and billet material. Other process variables are strictly correlated or dependent to these critical four (Davis and Semiatin, 1989). To assess the behaviour of the extrusion process, the team collected a significant number of data following the extrusion process sheet. For each rod the team asked the inspectors to check the diameters at the head and end of the bars, using precise micrometers and digital gauges. The diameter of the bar is the critical feature from a customer perspective, as seen previously when looking at the criticality of the dimensional tolerances. No improvement actions and suggestions have been introduced in this phase, because the measurement must focus on the as-is state of the process. Then, on the evidence following the subsequent Analyse phase, it is possible to design architecture to improve the process, moving towards excellence (Yang and El-Haik, 2003). The team collected information on T26 diameter, an item commonly scheduled. The data having been recorded in the datasheet, which lists the values of potential critical factors.
Four events were considered. Every event grouped a series of observations. It was common practice to collect the mean diameter values of the last two pressings and to assess the capability on those samples. For every event, the billet temperature, the ram speed, the die identifier and the material can vary between different levels. It was a common practice to substitute the die after four extrusions. The diameters are measured after every cycle, when the die is changed and cleaned too. The team externally observed the industrial flow and collected statistics. When the observation period ended, the data are gathered together, managed and analysed using Minitab statistical software (Henderson, 2006).
In Figure 4, the histogram shows how the data can be considered as normally distributed around a mean value equal to 26.702 mm with a standard deviation equal to 0.052 mm.
Figure 4 Histogram and main statistics for diameter T26 (see online version for colours) 26.80 26.75 26.70 26.65 26.60 Median Mean 26.715 26.710 26.705 26.700 26.695 26.690 1st Quartile 26.672 Median 26.705 3rd Quartile 26.740 Maximum 26.800 26.690 26.713 26.690 26.714 0.046 0.062 A-Squared 0.53 P-Value 0.169 Mean 26.702 StDev 0.052 Variance 0.003 Skewness -0.426412 Kurtosis 0.004709 N 84 Minimum 26.570 Anderson-Darling Normality Test
95% Confidence Interval for Mean
95% Confidence Interval for Median
95% Confidence Interval for StDev
95% Confidence Intervals
The Anderson and Darling test (D’Agostino and Stephens, 1986) refers to a p-value equal to 0.169, confirming the goodness of fit for a normal distribution. Using the I-MR Chart shown in Figure 5, the process did not highlight the presence of relevant specific causes (Oakland, 2003). However, the team had to study this data in order to discover potential instability sources and, similarly, the team then had to perform a capability analysis.
Figure 5 I-MR Chart of diameter T26 (see online version for colours)
81 73 65 57 49 41 33 25 17 9 1 26.8 26.7 26.6 Observation In d iv id u al V a lu e _ X=26.7015 UCL=26.8361 LCL=26.5670 81 73 65 57 49 41 33 25 17 9 1 0.16 0.12 0.08 0.04 0.00 Observation Mo vi n g R a ng e __ MR=0.0506 UCL=0.1653 LCL=0 5 5 6 2 2
These results, as seen in Figure 6, showed an unacceptable performance of the extrusion process in satisfying the customer requirements of T26 item, when specification limits are imposed (LSL equal to 26.60 mm, USL equal to 27.04 mm and Target equal to 26.80 mm). In fact, the Ppk is equal to 0.64 and Sigma level is less than 2 with a dpm of 26,524 (Figure 6). It is interesting to note how the mean value is close to the LSL and the defects are scraps due to unsatisfactory machining allowance.
Figure 6 Process capability of diameter T26 (see online version for colours)
27.000 26.925 26.850 26.775 26.700 26.625 LSL Target USL LSL 26.6 Target 26.8 USL 27.04 Sample Mean 26.7015 Sample N 84 StDev(Within) 0.0448603 StDev(Overall) 0.052492 P rocess Data Z.Bench 2.26 Z.LSL 2.26 Z.USL 7.54 Cpk 0.75 Z.Bench 1.93 Z.LSL 1.93 Z.USL 6.45 P pk 0.64 Cpm 0.59 Overall Capability P otential (Within) Capability
PP M < LSL 26523.62 PP M > USL 0.00 PP M Total 26523.62 Exp. Overall Performance
Within Overall
3.3 Analyse
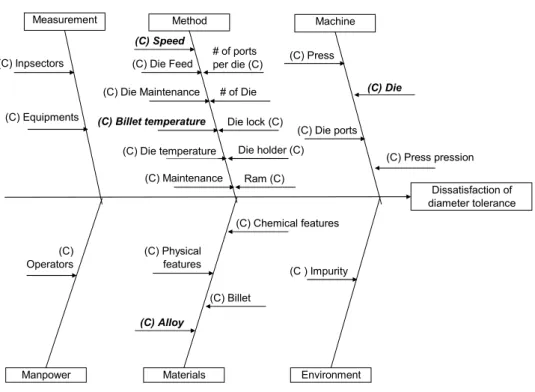
In the Analyse phase, the particular goals were to collect statistics from the database completed during Measure, show the overall process capability with respect to prescribed tolerances and understand what would influence the capability indexes. The first step of the analysis was a critical assessment of the possible variability sources of the bar diameter dimensions using a Cause – Effect diagram (Juran and Godfrey, 1999). The DFSS team involved the main figures of the extrusion process department in a meeting. Using an Ishikawa diagram, it divided the different variability sources into six classes: Method, Measurement, Machine, Material, Man and Mother Nature.
For every class, the DFSS team listed a number of defect causes on which to focus on in order to obtain an immediate improvement:
• Machine: it was indisputable the significant contribution of the press and its components on the variability of the whole system. For example the functionality of the press engine, the die ram, the main cylinder of the billet, the container, the die lock, the die holder or the press/billet oven could impact directly on the value of the bar diameter.
• Method: the setting of the main press parameters has a fundamental effect on the performance level of the extrusion process. In fact extrusion speed varies directly with metal temperature and pressure developed within the container. Temperature and pressure are limited by the alloy used and the shape being extruded. The preferred billet temperature should be that which provides acceptable surface and tolerance conditions and, at the same time, allows the shortest possible cycle time.
At high billet temperatures and extrusion speeds, metal flow becomes more fluid. Excessive extrusion temperatures and speeds cause tearing of metal at thin edges or sharp corners. It was also important to consider the maintenance of the main process components. There is a direct correlation between the extrusion ratio, the press setting (billet temperature and ram speed) and the flow parameters (extrusion temperature and speed above all). The ram speed and the billet conditions were controllable and can be maintained almost constant.
• Man: the experience of the extrusion process operators could impact on the variability of the diameter values of a bar. In fact they could intervene in order to change the process parameters if the extrusion did not satisfy the requirements. A definition of a clear and rigorous procedure might be necessary.
• Materials: the chemical and physical features of the raw material were fundamental in order to satisfy the customer requirements. These characteristics of the alloy could influence the other process parameters and therefore the performance level of the system. For this reason a further study of the casting process data could be important.
• Measurement: the unacceptable measurement system (inspectors, equipments) could affect the performance level of the whole system maintenance, therefore a study of the measurement system reliability was suggested and implemented during the Measure phase.
• Mother Nature: the last important aspect of the extrusion process was the presence of impurities inside the die during the extrusion process activities. This fact was due to the environmental conditions of the department.
Figure 7 highlights the Ishikawa diagram resuming the Cause–Effect analysis. The DFSS team associated a letter (i.e. C, N, or X) to classify every cause. The main causes are ‘C’; therefore, it was possible to study and eliminate them in order to improve the performance level of the process.
For this reason the DFSS team studied and interpreted different diagrams. In order to deploy an effective quantitative analysis of the extrusion process, the DFSS team studied the main process parameters using different tools, such as run-charts, box-plots, control charts or histograms. The main voice of the customer was the tolerance satisfaction of the diameter of the extruded bar.
First of all, the quantitative analysis began by stratifying the data collected in the Measure phase, grouping with different criteria and maintaining at least one factor unaltered. Thus, considering the material, ram speed, temperature and die as the potentially relevant factors that could influence the diameter value and the capability indexes, an Exploratory Data Analysis (EDA) has been performed. For every stratified group of data, the main statistics, the distribution assessment and the capability indexes have been collected. The goal of this phase was to quantify the main factors impacting on the process variability, and to set the process parameters in order to increase the process capability.
EDA is a collection of qualitative and quantitative tools, graphs and methods used to obtain useful information from a set of data (Montgomery, 1990b). In this analysis, EDA refers to a qualitative and visual representation of the data, a collection of process statistics, up to a modelling attempt through analysis of variance.
Figure 7 Ishikawa diagram
Measurement Method Machine
Manpower Materials Environment
Dissatisfaction of diameter tolerance (C) Inpsectors (C) Equipments (C) Die temperature (C) Maintenance (C) Billet temperature (C) Die Maintenance (C) Die Feed (C) Speed Ram (C) Die holder (C) Die lock (C) # of Die # of ports per die (C) (C) Press pression (C) Die ports (C) Die (C) Press (C) Operators (C) Alloy (C) Billet (C) Chemical features (C) Physical features (C ) Impurity
Every factor varies between levels; according to the company experience and practice, the ram speed can vary between 20 mm/s (low) and 40 mm/s (high), the temperature of the billet varies in a range between 650°C and 700°C. It is company common practice to consider as high temperature every value greater than 675°C, low temperature likewise. The speed is considered high if it exceeds 30 mm/s. Three dies (A, B and C) are alternatively used to extrude T26 and, finally, two different brass materials are extruded (M1 and M2). Material alloy M2 is composed by less copper (close to 58% against the close to 60% of M1) and lead concentrations, against a greater percentage of zinc and tin.
For every level the data have been grouped, the main statistics collected and simple statistical tests conducted. Furthermore for every group the Anderson and Darling (AD) test is introduced to verify the data follow a normal distribution.
A t-test was performed to assess differences between level mean values, whereas the Levene’s test verifies differences between relative standard deviations. Table 2 shows the main statistics for the stratified data. For statistical tests, the p-values are quoted. The p-values greater than 0.05 confirm that null-hypothesis cannot be rejected.
A lot of information can be traced from the statistics. Generally, by dividing the data between two (or three as in the case of die factor) homogeneous samples, the normality is not affected; in fact, the p-values quoted for the AD tests are generally greater than 0.05. An exception is noted for die A, where a Weibull distribution (scale factor 739.53, shape factor 26.7274, AD adjusted equal to 0.997) seems to better fit the data. Another significant information has been obtained: Levene’s tests showed how the variances between samples are not statistically different; instead differences between level means are noticed for Temperature, Speed and Material factors. This information was completed
by evaluating multiple stratifications, modelled through the analysis of variance (ANOVA), considering a fixed effect, unbalanced general linear model. This is an opportune statistical method to quantify the influence of every perturbed factor and of every interaction between them on the response variable, the diameter (Montgomery, 1990b).
Table 2 Main statistics and statistical tests for stratified data
Factor Level Obs. Mean [mm] St. Dev. [mm] AD normality test equal means T-test for
Levene’s test for equal variances A 28 26.708 0.045 0.019 B 28 26.703 0.061 0.099 Die C 28 26.694 0.052 0.265 0.619 0.631 Low 36 26.681 0.050 0.432 Temperature High 48 26.717 0.049 0.217 0.002 0.904 Low 26 26.661 0.054 0.448 Speed High 58 26.720 0.041 0.382 0.000 0.154 M1 30 26.717 0.048 0.530 Material M2 54 26.693 0.053 0.057 0.038 0.748 Overall - 84 26.702 0.052 0.169 - -
The main effect of every factor on the response variable is plotted in Figure 8, whereas the complete results of ANOVA are shown in Table 3, where the p-values greater than 0.05 mean significant effects of the factor(s). The analysis of the residuals confirm that the model is correctly able to statistically represent the experiment (with an R-Sq = 45.39%). The results confirm that changing the ‘settings’ of the Speed, Temperature or Material, significant effects on the diameter mean value are detected. This kind of analysis allows us to quantitatively understand how the diameter measurement varies and why and how the process capability can be influenced as a consequence. If the range and the variance do not significantly vary during observations, the capability indexes are influenced by the position of the mean.
Table 3 Analysis of variance table
Source DoF Sum of Square Mean Square F-test P-value
Material 1 0.016932 0.016932 10.03 0.002 Die 2 0.001371 0.000685 0.41 0.668 Temp 1 0.010199 0.010199 6.04 0.016 Speed 1 0.039264 0.039264 23.26 0.000 Temp*Speed 1 0.000457 0.000457 0.27 0.604 Material*Temp 1 0.000110 0.000110 0.07 0.799 Material*Speed 1 0.000933 0.000933 0.55 0.459 Material*Temp*Speed 1 0.003014 0.003014 1.79 0.186 Error 74 0.124897 0.001688 Total 83
Figure 8 Main effects plot M 2 M 1 26.72 26.70 26.68 26.66 C B A Low High 26.72 26.70 26.68 26.66 Low High Material M ea n Die Speed Temp
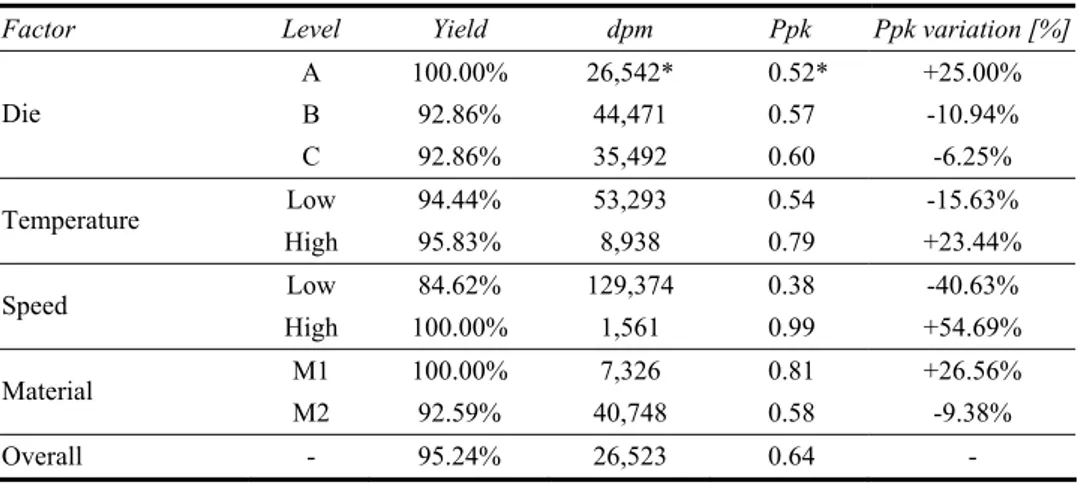
The stratifications are maintained to calculate capability sub-indexes for every group of data. Table 4 shows the capability indexes Ppk and a percentage of variation from specific Ppk to the overall performance. A strong correlation between the results of the ANOVA and those of the capability breakdown can be observed.
Table 4 Capability indexes and variations for stratified data
Factor Level Yield dpm Ppk Ppk variation [%]
A 100.00% 26,542* 0.52* +25.00% B 92.86% 44,471 0.57 -10.94% Die C 92.86% 35,492 0.60 -6.25% Low 94.44% 53,293 0.54 -15.63% Temperature High 95.83% 8,938 0.79 +23.44% Low 84.62% 129,374 0.38 -40.63% Speed High 100.00% 1,561 0.99 +54.69% M1 100.00% 7,326 0.81 +26.56% Material M2 92.59% 40,748 0.58 -9.38% Overall - 95.24% 26,523 0.64 -
Note: *From Weibull distribution.
In particular, the greatest value of the capability indexes has been detected for a combination of temperature High, speed High and material M1, with a Ppk equal to 1.04 corresponding to an increasing of 62.5% from the overall one. The Analyse phase output provided useful suggestions to be implemented in the Design phase. In fact, looking at the diameter means and capability indexes for every combination of factors, the team planned an experimental test, in order to improve the overall capability of the extrusion process.
3.4 Design and verify
In the Design phase, the team intended to impose the process variables which were critical from the previous analysis. In this manner, it has been possible to build an experimental environment by varying three factors on two levels each. The strategy for the changeover of the dies has been maintained unaltered, even if two dies are considered instead of three. The number of pressings has been fixed too. For the analysis, the Die factor has been maintained as a block, in order to assess a potential noise factor (Montgomery, 1900b). By involving three factors variable between two levels and a bloc k, in accordance with DOE theory, the structure of the experiment becomes a 23 full
factorial complete plane with a randomised block. The diameter of the extruded bars has been measured after the last two replications and overall the team collected 48 data items.
The design phase considered a renewal of the process, strictly based on the results previously achieved. For this reason, the materials varied between M1 and M2, but it is interesting to deal into the ram speed and the temperature, by setting them close to their high levels. At the early beginning of the Design phase, the team decided to test the performances of the process by varying the temperature from 675°C (Low Designed level, LowD) to 700°C (High Designed level, HighD) and the speed from 30 mm/s (LowD) to 40 mm/s (HighD). The experimental architecture and the mean detected diameter for every combination of factors can be represented trough a cube plot (Montgomery, 1900b). DOE techniques are unmatched to quantify the effect of every factor and interaction on the response variable.
The effect is calculated as the mean difference between different levels. The relevance of the effect is generally observed taking into account the p-value. Table 5 and Figure 9 show how the factor Temperature and, to some degree, Speed have a relevant impact on the diameter mean value. The regression model adequately represents the reality, denoting a large standardised residuals and an R-Sq index equal to 63.10%.
Figure 9 Normal plot of the standardised effects (see online version for colours)
5 4 3 2 1 0 -1 -2 -3 99 95 90 80 70 60 50 40 30 20 10 5 1 Standardised Effect P ercen t A Speed B Temp C Material Factor Name Not Significant Significant Effect Type B Less Significant A
Table 5 Estimated effects and coefficients for diameter T26
Term Effect Coefficient SE Coef. T P-value
Constant 26.7318 0.006424 4160.97 0.000 Block 0.0014 0.006424 0.21 0.834 Speed 0.0248 0.0124 0.006424 1.93 0.066 Temp 0.0640 0.0320 0.006424 4.98 0.000 Material -0.0145 -0.0073 0.006491 -1.12 0.274 Speed*Temp -0.0198 -0.0099 0.006424 -1.54 0.137 Speed*Material -0.0058 -0.0029 0.006491 -0.45 0.659 Temp*Material 0.0195 0.0098 0.006491 1.51 0.146 Speed*Temp*Material 0.0033 0.0016 0.006491 0.25 0.802
Although in the Analyse phase it was noticed that the material and the speed influence the diameter behaviour, for higher settings, this impact becomes less significant. Furthermore, the experimental procedure confirms that the die (Block) does not represent a noticeable noise factor. By closing the range between the variable levels, the detected effects are lower than those noticed in the Analyse phase. In this case, the material does not to seem to affect the variability; therefore, in a sense high settings determine a more standardised process.
The contour plot of Figure 10 suggests that setting the process on high temperature and high speed values, it is possible to obtain a diameter meanly close to the target. This leads to an increasing of the capability indexes. The overall Ppk of the designed experiment is equal to 0.87. The verification of the designed improvements has been assessed looking at the capability indicators. By considering all the values recorded with the temperature set at HighD level, a Ppk equal 1.06 is calculated, meaning a significant increasing of the process effectiveness and potential savings, as a consequence.
Figure 10 Contour plot of diameter T26 vs. Temperature and Speed (see online version
for colours) Speed value [mm/s] T em pera tu re v al ue [ °C ] 40 38 36 34 32 30 700 695 690 685 680 675 > – – – – < 26.68 26.68 26.70 26.70 26.72 26.72 26.74 26.74 26.76 26.76 Diameter
Table 6 lists the capability index Ppks and the relative expected defects per million detected during the development of the DMADV roadmap.
Table 6 Comparison of capability indicators after the Analyse and Design phases
Capability
indicator Overall Analyse Analyse High T Δ [%] Overall Design Δ [%] HighD T Design Δ [%]
Ppk 0.64 0.78 +21.88% 0.87 +35.94% 1.06 +65.63%
dpm 26,523 9,822 −62.97% 4,452 −83.21% 715 −97.30%
The Ppk and dpm variations (Δ) are considered as the percentage of the same indicators calculated from the entire data collection of the Analyse phase. In this way, one can appreciate the capability improvement from the previous practice after the implementation of Design specifications. In fact, the team calculated from the as-is process a Ppk equal to 0.64 and a Ppk equal to 0.78 if referred to those values with the temperature higher than 675°C. The to-be process obtained from the factorial DOE should permit an increase of Ppk up to +65.63%, with a consequential conspicuous reduction of the defects due to unsatisfactory machining allowance. Additionally, the Process Sigma Capability index grew from 3.4 to 4.7. The new setting of the process permits a reduction of COPQs equal to 184,281.10 €/year (considering reworks, scraps, controls, management, lost sells and penalties).
4 Conclusions
This project attempts to demonstrate the effectiveness of the DFSS methodology in designing new process learning applied to an extrusion system. Using a case study approach, it is possible to appreciate the consequential use of many qualitative and quantitative tools. The authors used the DMADV approach in order to obtain consistent improvements: after a deep knowledge of the customers and processes from the define phase activities, the key process of the company was measured, by introducing appropriate KPIs. During the analysis of the collected data and the design of an improved process, the project highlights the power of some statistical tools, used to quantify the influence of parameter perturbations on quality and performance level of the product.
Following the Six Sigma metrics, the hierarchical approach evaluated the variation of the capability indexes due to data stratification and designed improvements. In particular, from a Ppk equal to 0.64 at the end of the Analyse phase, after the Design and Verify phases, a Ppk equal to 1.06 was detected for the suggested parameter levels. In order to verify the results, it should be necessary to extend the verification phase, assessing if the changes affect other CTCs. Ultimately, after a medium-period observation, the stability and capability of the process must be re-analysed and then an economical evaluation of the DFSS project can be completed.
5 Managerial implications
Improving the performance level of a process is a tantalising goal for most manufacturing managers. When the process is particularly complex, typically involving many parameters, it is very important to have an understanding of how the process behaves
under different conditions. This paper has described a methodology that is based on an empirical analysis of a case study. The paper gives some insights into how the performance levels of a manufacturing extrusion process can be explored and improved through the use of a DFSS approach.
The study outlines a DMADV roadmap that allows manufacturing managers to follow a series of experimental steps which cover fundamental aspects of quality improvement. It demonstrates that a careful consideration of VOC, VOP, Pareto analysis, QFD, Ishikawa and statistical techniques can deliver valuable insights into process and material behaviour. This ultimately provides managers with potentially a better understanding and ultimately new process learning when applied to a simple extrusion process example. In essence, the DFSS approach used in this study can be used to test alternative scenarios that provide manufacturing managers with alternative policy implications for different types of manufacturing processes.
References
Adams, C., Gupta, P. and Wilson, C. (2002) Six Sigma Deployment, Butterworth-Heinemann, New York.
Aggogeri, F. and Gentili, E. (2008) ‘Six Sigma methodology: an effective tool for quality management’, International Journal of Manufacturing Technology and Management, Vol. 14, Nos. 3/4, pp.289–298.
Basu, R. and Wright, J.N. (2004) Quality Beyond Six Sigma, Butterworth Heinemann, Woburn, MA.
Chowdhury, S. (2003) The Power of Design For Six Sigma, Dearborn Trade Publishing, A Kaplan Professional Company, La Crosse, WI, pp.35–48.
D’Agostino, R.B. and Stephens, M.A. (1986) Goodness of Fit Techniques, Dekker, New York, NY. Davis, J.R. and Semiatin, S.L. (1989) ASM Metals Handbook, Vol. 14, Forming and Forging,
9th ed., ASM International, Materials Park, OH.
De Feo, A. and Barnard, W. (2004) Juran Institute’s Six Sigma, McGraw-Hill, New York, NY, pp.25–70.
El Wakil, S.D. (1989) Processes and Design for Manufacturing, Prentice Hall, Lebanon, IN. George, M. (2002) Lean Six Sigma, McGraw-Hill, New York, NY.
Ginn, D. and Varner, E. (2004) The Design For Six Sigma Memory Jogger, GOAL/QPC, Salem NH, pp.21–24
Henderson, G.R. (2006) Six Sigma Quality Improvement with Minitab, John Wiley & Sons, Chichester, UK.
Juran, J.M. and Godfrey, B.A. (1999) Juran’s Quality Handbook, McGraw-Hill, New York, NY. Kalpakjian, S. and Schmid, S. (2006) Manufacturing Engineering & Technology, 5th ed.,
Prentice Hall, Englewood Cliffs, NJ.
Mazzola, M., Gentili, E. and Aggogeri, F. (2007) ‘Scor, Lean and Six Sigma for a complete industrial improvement’, International Journal of Manufacturing Research, Vol. 2, No. 2, pp.188–197.
Montgomery, D.C. (1990a) Design and Analysis of Experiments, John Wiley & Sons, New York, NY.
Montgomery, D.C. (1990b) Introduction to Statistical Quality Control, John Wiley & Sons, New York, NY.
Oakland, J.S. (2003) Statistical Process Control, Butterworth-Heinemann, Oxford, UK. Pande, P. and Holpp, L. (2002) What is Six Sigma?, McGraw-Hill, New York, NY.
Pyzdek, T. (2003) The Six Sigma Handbook, McGraw- Hill, New York, NY.
Re Velle, J.B., Moran, J.W. and Cox, C.A. (1998) The QFD Handbook, John Wiley & Sons, New York, NY.
Schmidt, S.R. and Launsby, R.G. (1997) Understanding Industrial Designed Experiments, Air Academy press & Associates, Colorado Springs, CO.
Shahin, A. (2008) ‘Design for Six Sigma (DFSS): lessons learned from world-class companies’,
International Journal of Six Sigma and Competitive Advantage, Vol. 4, No. 1, pp.48–59.
Stamatis, D.H. (2002a) Six Sigma and Beyond: Foundations of Excellent Performance, St. Lucie Press, Boca Raton, FL.
Stamatis, D.H. (2002b) Six Sigma and Beyond: Design for Six Sigma, CRC Press, Boca Raton, FL. Yang, K. and El-Haik, B. (2003) Design for Six Sigma, McGraw-Hill, New York, NY.