Fiorenza Belussi, Ivan De Noni, and Luigi Orsi
Abstract
Recent literature on technological changes has highlighted the role of knowledge recombination in innovation. Evidence suggests that the production of scientific and technological knowledge is becoming an increasingly collective phenome-non. Thus, in rapidly developing industries, it is almost inevitable to develop inter-organizational collaborations to identify new opportunities for new technologies.
The aim of this chapter was to explore the innovative activities and networks in European regions (EU 27 plus Norway and Switzerland) from 1980 to 2010. Specifically, we analysed the most innovative sectors: environmental (green), biotechnology (biotech), laser and optic technology and nanotechnology (nanotech). This longitudinal study relies on European Patent Office (EPO) patents and inventors’ data by year and region, as provided by OECD-Regpat database. Our main findings emphasize the rise of co-inventions in intra-regional and inter-regional inventive networks, the concentration of innovations in cen-tral regions and peripheral regions’ reliance on external knowledge flows to compensate for their technological weaknesses.
Keywords
Innovation · Peripheral regions · Networks of innovators
F. Belussi (*)
Department of Economics and Management, University of Padua, Padova, Italy e-mail:[email protected]
I. De Noni · L. Orsi
Department of Environmental Science and Policy, University of Milan, Milano, Italy e-mail:[email protected];[email protected]
# Springer International Publishing AG 2018
A. Isaksen et al. (eds.),New Avenues for Regional Innovation Systems - Theoretical Advances, Empirical Cases and Policy Lessons,
https://doi.org/10.1007/978-3-319-71661-9_9
1
Introduction
Conventional innovation theories have attempted to explain the technological
trajectory of discontinuities in corporate innovation processes (D’Aveni 1994;
Tushmann and Anderson1986). As demonstrated by the Schumpeterian tradition,
radical innovations emerge erratically when dynamic entrepreneurs introduce ‘new
combinations’, disrupting the economic system’s equilibrium (Schumpeter 1934,
1947). However, technological changes and product improvements arise from
incremental innovations (Arrow 1962; Freeman 1994; Malerba 1992). This was
not acknowledged in the innovation literature of 1960s and 1970s, since the focus
was on radical inventions and innovations (Clark et al.1984; Jewkes et al.1958).
After the 1970s, the importance of marginal technical improvements as a means of
sustaining innovation in firms was acknowledged (Basalla 1988; Dosi 1982;
Rosenberg1976,1982). As argued by Mokyr (2000), ‘Much if not most creativity
comes from the manipulation of what is already known, rather than in addition of totally new knowledge’ (p. 18).
Often innovations are fed by continuously re-combining pre-existing knowledge from different sectors or firms through cumulative learning processes, as Pavitt
(1984,1999) authoritatively illustrated. A critical aspect is how firms integrate old
and new knowledge and apply it to new domains. Old knowledge might be reused as new information in other domains, or firms might acquire existing knowledge from the outside to feed their internal innovation activities (Asheim and Isaksen
2002; Chesbrough2003a,b).
Generative collaborations, within an innovative ecosystem or regional
innovation system (Asheim et al. 2011), may enlarge the realm of possibilities
and identify new systems and functionalities, perpetuating the recombination
pro-cess within an innovation cycle (Bonaccorsi2011; Lane2011). New literature on
technological changes emphasized the role of knowledge recombination as one of the most important sources of technological novelty and invention (Weitzman
1998; Strumsky et al.2011,2012; Youn et al.2014). Youn et al. (2014) showed
that after the huge creation of new patent codes (indicating the introduction of novel technologies) between 1800 and 1850, the subsequent pattern of inventions was based on the recombination of existing codes, creating a practically infinite space of technological configurations. Patents are the main expression of technology novelty and new patents are typically associated with existing technological codes (Jaffe
et al.1993).
As Fleming (2001) affirmed, ‘the source of technological novelty and
uncer-tainty lies within the combination of new components and new configurations of previously combined components’ (p. 130), while historically there were limited
developments of original technologies (Strumsky et al. 2011). The literature
suggested the production of scientific and technological knowledge became an
increasingly collective phenomenon (Allen1983; Freeman1991; Gay et al.2008).
In rapidly developing industries, it is almost inevitable for inter-firm collaborations to identify new opportunities and create new technologies (Powell
Powell and Giannella (2010, p. 4) affirmed, ‘Collective invention is technological advance driven by knowledge sharing among a community of inventors who are often employed by organizations with competing intellectual property interests’. Economic geography and regional science study the importance of geographic
innovation proximities and network formations (Rallet and Torre1999; Boschma
and Frenken2010; Cassi and Plunket2015). Ter Wal (2013) demonstrated that the
role of geographic distance, as a mechanism of the formation and network evolution shifts over time, was the technological regime of the industry changes.
2
Methodology
The aim of this research was to explore the innovation activity and networks in European regions (EU 27 plus Norway and Switzerland) from 1980 to 2010. The study is based on European Patent Office (EPO) patents and inventors per year and region as provided by OECD-Regpat database (release version February 2015). The 30-year range included 1980–2010. Firstly, a general cleaning process was applied to make the dataset usefull. Since the same patent identification was listed multiple times to capture each involved inventor (Inv_share is the inventor’s share of involvement in the patent’s creation) and region (Reg_share is the regional share,
if the inventor is registered in different regions),1patents were counted as the sum
of inventors’ shares weighted for their regional share (∑Reg_share∗Inv_share).
Thus, patents whose∑Reg_share∗Inv_share per patent was less than 0.99 or more
than 1.01 were excluded. In addition, since only European regions were under consideration, patent data concerning ‘not classified’ regions were also deleted.
The preliminary dataset involved 284 European regions which were defined using the NUTS2 classification of EU 28 countries, plus Switzerland and Norway, and 2,493,658 EPO patents. However, since this study focused on knowledge flows across European regions by exploring inventor networks, and EPO patents include non-European inventors, EU patents were identified as EPO patents involving at least one European inventor. The EU patents dataset was thus reduced to 1,228,481 EU patents.
In addition, a further classification distinction was made between individual patents (which involved only one inventor) and co-invented patents (which involved more than one inventor). Then, co-invented patents were classified as intra-regional (patents involving inventors belonging the same EU region), inter-regional (patents involving inventors belonging to different EU regions) and extra-EU regional (patents involving some inventors belonging to regions outside the EU). The last group specifically focuses on inventors from developed countries (the
US, Canada and Japan), emerging countries (BRICS2) and other countries.
1Reg_share is less than 1if the inventor is assigned to different regions because of moving in the three years preceding the patent’s priority year.Inv_share is less than 1 when patent is co-invented. 2Brazil, Russia, India, China and South Africa.
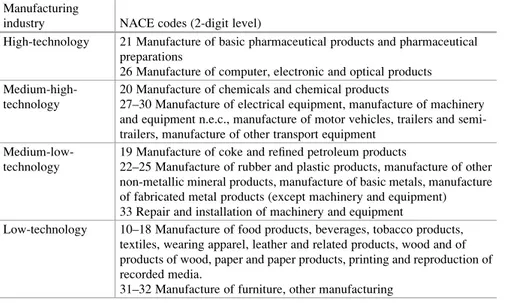
Below, the data is organized to explore the transformation path of European regions over time by depicting the trends, technological specializations, role of collaborative innovations and the inter-regional knowledge flows through inventor networks. In addition, based on technological classes defined by the International Patent Classification (IPC), we observed the innovation process focusing on both traditional classifications of high, medium-high, medium-low, and low technology
(Table6), and the investigation of the patterns of geographical localization of new
industries like biotechnology, nanotechnology, green technology and laser and optic technology.
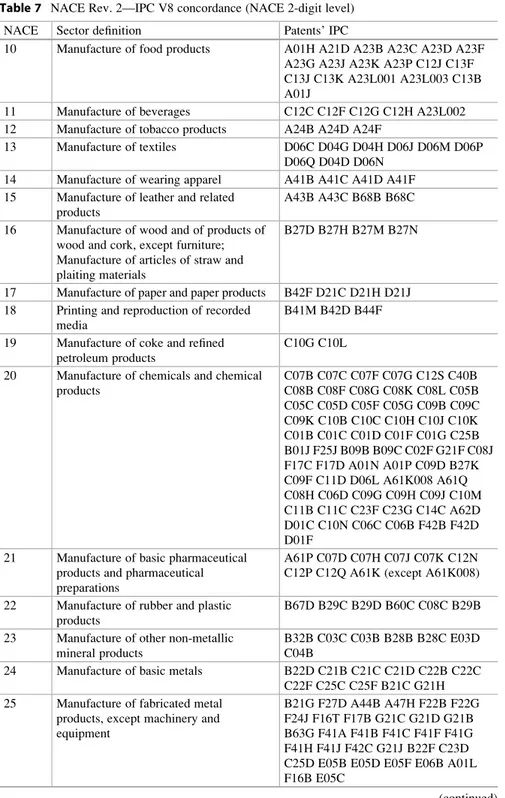
The relationship between patents and sectors is depicted in the IPC maps as
provided by Van Looy et al. (2014). We focused on the Statistical Classification of
Economic Activities in the European Community (NACE) at the 2-digit level
(Eurostat2014). The IPC v.8—NACE rev.2 concordance table (Table 7) allows
us to associate patents with 26 different sectors (i.e., the patent with an NACE corresponding to C08B is associated with the Manufacture of Chemicals and Chemical Product sector, sector 20).
Most of the patents in our database are in the ‘high’ and ‘medium-high’ tech groups (from 1980 to 2010, we found 1,061,319 and 1,350,486 patents, respec-tively). This suggests, as expected, the patenting process mainly involves the most high-tech sectors. ‘Medium-low’ and ‘low technology’ groups had 274,286 and 370,280 patents, respectively.
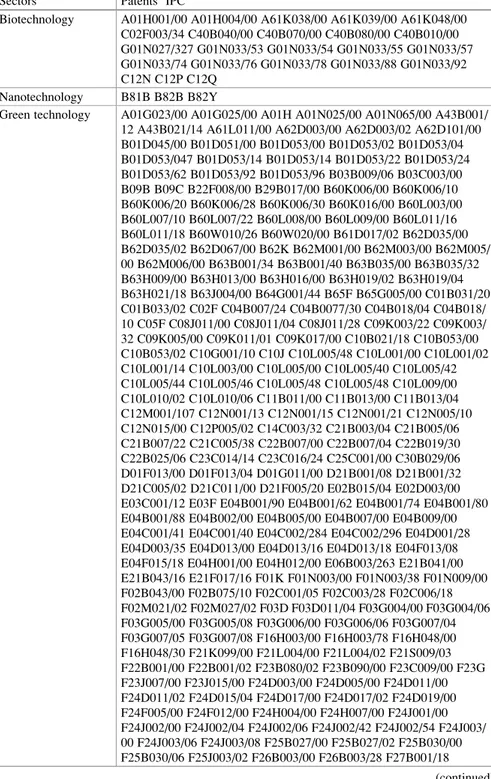
Furthermore, the patents related to innovative industries such as biotechnology, nanotechnology, green technology and laser and optic technology were listed using
a standardized IPC (Table8). Specifically, the IPC classes of biotech patents were
provided in the Annex 6 of Eurostat indicators (Eurostat2007), whereas the classes
of green patents relied on the World Intellectual Patent Office (WIPO) database. The nanotechnology and the laser and optic technology patents were also
aggregated based on Eurostat (2014).
The largest group was green technology patents (151,947), followed by biotech-nology patents (126,100) and laser and optic patents (77,847). The smallest group was nanotechnology patents (4663). The overlap in these industries was less than 10%, with the exception of biotechnology and green technology at about 20%.
3
A Persistent Flow of European Innovations
Europe has experienced a long structural period of social expansion and economic growth. Patenting activity mirrored this trend. Similar to the overall trend in
economic development in Europe, the yearly distribution of patents (Fig. 1)
shows a smoothing and slowing growth of innovation productivity since 2007.
Figure1also shows the trends of individual and co-invented patents. The latter
were further partitioned into intra-regional patents, inter-regional patents and extra-European patents. These trends suggest the propensity to co-patent has grown compared to individual patents since the mid-1990s. Conversely, the number of individual patents has slowly decreased since 2000. In 30 years, the share of
0 10000 20000 30000 40000 50000 60000 70000 Number of patents
Number of coinvented EU patents with Extra-European inventors Number of coinvented EU patents among European regions Number of coinvented EU patents within the same region Number of individual EU patents
Fig. 1 Yearly distribution of EU patents
individual patents diminished from 50 to 40%, while the share of co-invented patents in the EU regions increased from 23 to about 30%. Moreover, the inter-regional collaboration increased at a faster rate than the intra-inter-regional one.
The inventive activity in the EU has been quickly growing in recent decades
(Fig.1), from an average number of 13,000–15,000 patents issued yearly in the
beginning of the 1980s, to the 29,000–30,000 of the 1990s, to the 50,000–52,000 of the 2000s, up to the 60,000 between 2008 and 2010.
The cumulative distribution over the 30-year period makes the previous findings
even more evident (Fig.2).
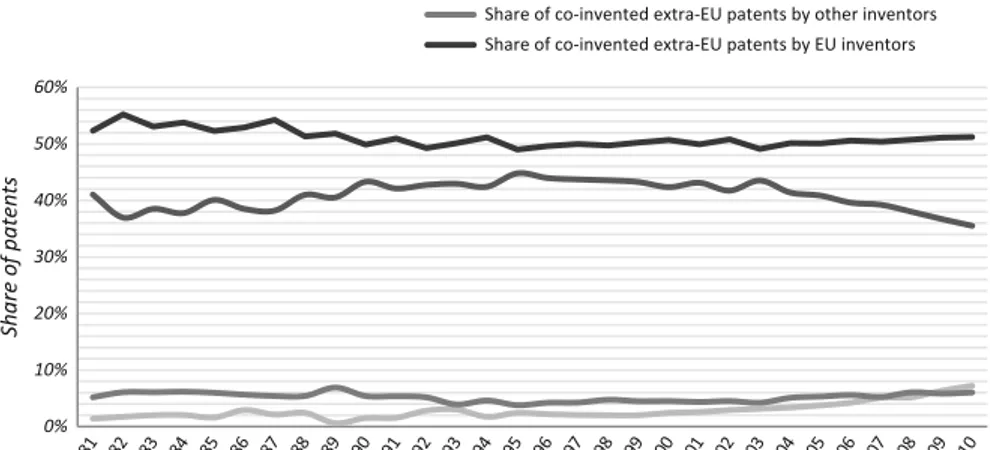
Similarly, the longitudinal analysis highlights the increasing relevance of extra-EU inventors over other networks since 1995. Specifically, more detailed data
(Fig. 3) highlights these extra-EU collaborations involving inventors from the
US, Canada and Japan. However, since 1995, the relevance of developed countries has decreased compared to the growing role of inventors from the BRICS countries. The latter have increased from nearly 0% to just less than 10%.
About 35–40% of the co-invented patents with inventors from outside the EU
(Fig. 3) involved inventors localized in advanced countries (US, Canada and
Japan). This share has been stable throughout the 30-year period, whereas patenting activity deriving from BRICS saw consistent growth.
During this 30-year period, the EPO registered 2,516,942 patents, of which about half (1,242,457) involved at least one EU inventor. The number of inventors of EPO patents was about 4.5 million, but the number of inventors related to EU patents was only about 2 million (1,921,002 units). EPO patents in Europe have slightly more inventors than EU patents in all years considered, on average 1.82 versus 1.55. This could be due to the higher technological complexity of foreign patents versus European patents. This was corroborated by the fact that the total number of EPO collective patents was greater than the total number of EU patents (64.91 vs. 60.01). Of the collective patents (680,517), the majority were invented by a network of inventors localized in more than one European region (388,557). Patents with a more local dimension, where the network of inventors was concentrated in the same region were less numerous (291,960 or 42.9%). Our database did not allow us to distinguish regional innovation networks from internal company networks, since we analysed data based on inventors’ addresses. How-ever, this data shows the large regional and extra-regional knowledge flows.
In Table1, the total weighted number and growth rate of EPO patents are shown
in three 10-year windows of time (1980–1990, 1990–2000 and 2000–2010) and the
cumulated number from 1980 to 2010. Table 1 also summarizes the weighted
number and growth rate of EU patents, as previously classified.
Finally, the total inventors’ productivity was measured as the average number of EPO and EU patents per inventor. Since the average number of inventors of EPO patents (1828) was higher than the average number of EU patents (1592), it is likely these were more complex. The complexity of innovation systematically grew with time in both samples.
0 200000 400000 600000 800000 1000000 1200000 1400000 Number of patents
Number of coinvented EU patents with Extra-European inventors Number of coinvented EU patents among European regions Number of coinvented EU patents within the same region Number of individual EU patents
Fig. 2 Cumulative distribution of EU patents
4
The Geography of Invention in the EU
An important aspect of inventors’ networks was their geographical localization. We analysed the EPO database for European Regions at the level of NUTS2 for the 28 EU countries, adding Switzerland and Norway, thus, considering 30 countries
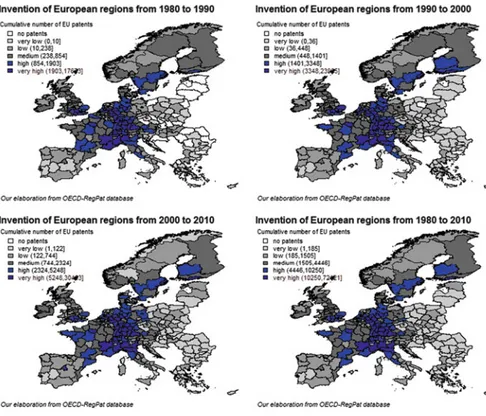
and 284 regions. In Fig.4, innovation intensity per region (r) and year ( y) was
measured based on EU patents by operationalizing the sum of inventor shares weighted for regional shares, relative to each patent (i), aggregated according the inventors’ region of localization and the patents’ priority year. The figure suggests Germany has reasserted its economic and technological position, having emerged as the innovative heart of Europe.
The patent intensity by region indicator shows a highly concentrated core of innovative regions in EU, along the well-known ‘blue banana’, which starts in Finland and Sweden, descending along Germany, Switzerland, south eastern France, northern Italy and stopping in Rome (in the Lazio region). In the 30-year period, absolute growth in international inventive activity involved several regions in the ‘blue banana’ and the sun belt of northern Italy and southern France.
Three blue spots emerged: the regions of southern England, some regions in central France (Paris and later the area connecting Paris to the Bretagne), the areas in southern France (Provence, Rhone-Alps, Midi Pyrenees which include Toulouse) and Catalonia (centred in Barcelona). The blue core of EU regions was surrounded by a strong grey area with weaker adjacent regions. Spain, southern Italy, northern-most England, Greece and Eastern European countries exhibited lower levels of innovativeness. 0% 10% 20% 30% 40% 50% 60% Share of patents
Share of co-invented extra-EU patents by US-CAN-JP inventors Share of co-invented extra-EU patents by BRICS inventors Share of co-invented extra-EU patents by other inventors Share of co-invented extra-EU patents by EU inventors
Table 1 Cumulative statistics and growth rate of EPO and EU patents from 1980 to 2010 Variables CumPat 1980–1990 CumPat 1990–2000 CumPat 2000-–2010 CumPat 1980–2010 GrwRate 80–90/00–10 GrwRate 90–00/00–10 EPO patents 443,818 798,545 1,251,295 2,493,658 1.819 0.567 Number of individual EPO patents 192,156 286,557 393,153 871,866 1.046 0.372 % 43.30% 35.88% 31.42% 34.96% – – Number of co-invented EPO patents 251,662 511,988 858,142 1,621,792 2.410 0.676 % 56.70% 64.12% 68.58% 65.04% – – EU patents a 232,780 393,293 602,408 1,228,481 1.588 0.532 Number of individual EU patents 114,514 163,502 211,745 489,761 0.849 0.295 % 49.19% 41.57% 35.15% 39.87% – – Number of co-invented EU patents 118,266 229,791 390,663 738,720 2.303 0.700 % 50.81% 58.43% 64.85% 60.13% – – Co-invented EU patents 118,266 229,791 390,663 738,720 2.303 0.700 within the same region 52,755 90,871 145,144 288,770 1.751 0.597 % 46.63% 43.23% 41.41% 42.85% – – among European regions 60,384 119,319 205,360 385,063 2.401 0.721 % 53.37% 56.77% 58.59% 57.15% – – involving Extra-European inventors 5127 19,601 40,159 64,887 6.833 1.049 % 4.34% 8.53% 10.28% 8.78% – – Co-invention with Extra-EU inventors b 5127 19,601 40,159 64,887 6.833 1.049 Share of US-CA-JP inventors 2054 8472 16,010 26,536 6.795 0.890 % 40.06% 43.22% 39.87% 40.90% – – Share of BRICS inventors 92 433 1784 2309 18.391 3.120 % 1.79% 2.21% 4.44% 3.56% – – Share of other Extra-EU inventors 300 877 2112 3289 6.040 1.408 % 5.85% 4.47% 5.26% 5.07% – – Share of EU inventors 2680 9820 20,250 32,750 6.556 1.062 % 52.27% 50.10% 50.42% 50.47% – – a An EU patent is an EPO patent involving at least one European inventor b Since the same patent may involve both US, CAN, JP, BRICS and other inventors, the sum of inventors’ share is shown for each cluster of inventors to avoid patent duplication
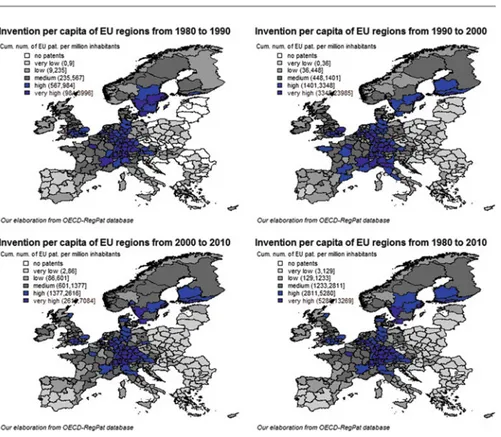
Weighting the number of patents for capita (Fig.5), the innovative ‘core’ regions were even more restricted with the regions of Provence, Piedmont, Tuscany, Veneto, Lazio, Midi Pyrenees and Catalonia no longer considered locations of concentrated innovation.
Regarding the variation of patent intensity by region (Fig.6), two measurements
address the phenomenon: the absolute and the relative variation. The highest shares of absolute variation occurred among the most innovative regions of the ‘banana blue’ and the areas already identified, while higher relative growth rates were significant among some of the weakest EU regions, including of all Spain, Ireland, Finland, Campania, Denmark and Poland.
Co-invented patents were similar to patenting distributions (Fig. 4), and thus
those the figures are not reported here. Co-inventions appeared geographically concentrated in Norway, Finland, southern England, Germany, some regions of the former Soviet Bloc, northern Italy and multiple regions in France. These types of collective innovations benefit from proximity, where actors can recombine close and complementary knowledge.
Fig. 4 Patent intensity by region based on the cumulative number. Note: Inventions in European regions are based on EU patents involving at least one EU inventor. Breaks in the legend correspond to percentiles 0th, 25th, 50th, 75th, 90th and 100th
Fig. 5 Patent intensity per capita by region based on the cumulative number. Note: Inventions in European regions are based on EU patents involving at least one EU inventor. Breaks in the legend correspond to percentiles 0th, 25th, 50th, 75th, 90th and 100th
Fig. 6 Variation of patent intensity by region over 30-year window of time. Note: Inventions in European regions are based on EU patents involving at least one EU inventor. Breaks in the legend correspond to percentiles 0th, 25th, 50th, 75th, 90th and 100th
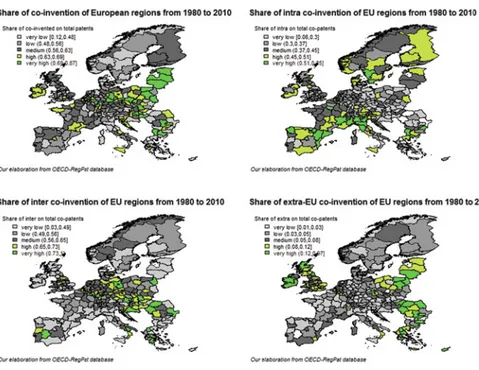
Figure 7 weights the percentage of co-inventions against the total number of patents. This produces a different picture of EU regions: peripheral regions of the EU, where patenting activity was weaker, have higher concentrations of co-invented patents measured against total patents.
It is probable that weak innovative peripheral regions, having fewer inventors, have to utilize collective methods to participate in innovative research projects. The first picture on the right shows the share of co-inventions in relation to inter-regional information networks. Higher shares of co-invented patents were located in northern Italy, southern France and northern Spain, coinciding with their indus-trial districts. The modality of high inter-regional innovative activity characterizes several regions of Eastern Europe, southern Italy and southern Spain. These co-invention locations mirrored the presence of numerous cooperative EU projects. The higher number of co-invented patents involving inventors from regions outside the EU were visible on the extreme periphery of Eastern Europe, Scotland and Ireland. Those areas are characterized by MNE localizations.
Fig. 7 Share of co-inventions and intra-regional, inter-regional and extra-EU co-inventions against the total number of inventions. Note: Co-invention in European regions is based on EU patents involving more than one inventor. Intra-regional co-invention in European regions is based on EU patents involving more than one inventor from the same region. Inter-regional co-invention in European regions is based on EU patents involving more than one inventor from a different European region than the other(s). Extra-EU co-invention in European regions is based on EU patents involving at least one inventor from an extra-EU region on the patent team. Breaks in the legend correspond to percentile 0th, 25th, 50th, 75th, 90th and 100th
5
The Innovative Sectors
In this section, we analysed European inventing activity by considering the most innovative sectors: green technology, biotechnology, laser and optic technology,
and nanotechnology. These four sectors (Tables2,3,4, and5) cover about 160,000
patents, of which 65–83% were co-invented.
The largest sector was green technology, with about 70,000 patents (Table2).
Europe is the most advanced regional area in the global economy regarding green innovations, due to strict governmental regulations and environmental business practices. These practices were developed through science and technology innovations, both in companies and in research centres and universities. Of EU patents, 60% were co-invented patents.
Innovative efforts characterized both the 1990s and, even more so, the 2000s.
Biotechnology patents (Table 3) form the second largest sector (about 46,000
patents). Despite the biotech revolution beginning in US in the 1980s, European organizations have closed the gap. Patenting activity in this sector was largely the result of collective inventions (85% of all EU patents were co-invented by more than one individual). Of the co-invented patents, 18% involved extra-EU inventors. However, the size of EU patenting is smaller than in the previous case, representing only 37% of the total international innovative activity (EPO patents).
The third analysed sector (Table4) relates to laser and optic technology, with a
cumulative number of 26,000 patents. During the 1990s and 2000s, the inventive activity grew at an average growth of about new 700 patents per year. In this sector, there were relatively fewer co-invented patents, comprising only 65% of total patents. For the 8% of patents involving extra-EU inventors co-invention activity.
The nanotechnology sector (Table5) represent the smallest of our sample (only
about 15,000 patents). The 2000s saw great expansion of nanotech patenting activity. During this decade, 82% of patents were co-invented. About 15% involved extra-EU inventors. EU patents represent about 33% of all innovative activity conducted at the international level (EPO patents).
Considering the geographical distributions of inventors in these innovative
sectors (Fig. 8), the territorial pattern of green technologies resembles the
geo-graphical distributions both of cumulated patents and co-inventions, with a large central core around Germany, a dense area in the sun belt of northern Italy and southern France as well as the district of London, southern Finland, Sweden, the Danish peninsula and the extension towards Holland.
Specialized biotech areas were more restricted regionally, with the exclusion of many advanced areas of Italy, northern France, Spain, Greece, and Eastern European countries. Laser and optic technology overlaid the ‘blue banana’ together with the southern sunbelt, where northern Italy and France connect. Nanotechnol-ogy patents represented a small technological niche, where some peripheral regions of the UK, southern Italy, and Spain are included. Overall, these pictures suggest that the geography of new innovative sectors in EU significantly overlap with traditionally innovative areas.
Table 2 Cumulative statistics and growth rate of green tech EPO and EU patents from 1980 to 2010 Variables CumPat 1980–1990 CumPat 1990–2000 CumPat 2000–2010 CumPat 1980–2010 GrwRate 80–90/00–10 GrwRate 90–00/00–10 EPO patents 26,816 55,215 69,916 151,947 1.607 0.266 Number of individual EPO patents 11,088 17,242 22,351 50,681 1.016 0.296 % 41.35% 31.23% 31.97% 33.35% –– Number of co-invented EPO patents 15,728 37,973 47,565 101,266 2.024 0.253 % 58.65% 68.77% 68.03% 66.65% –– EU patents a 13,838 25,241 31,494 70,573 1.276 0.248 Number of individual EU patents 6415 9468 11,915 27,798 0.857 0.258 % 46.36% 37.51% 37.83% 39.39% –– Number of co-invented EU patents 7423 15,773 19,579 42,775 1.638 0.241 % 53.64% 62.49% 62.17% 60.61% –– Co-invented EU patents 7423 15,773 19,579 42,775 1.638 0.241 within the same region 3042 5462 6906 15,410 1.270 0.264 % 43.81% 39.60% 39.32% 40.23% –– among European regions 3901 8332 10,659 22,892 1.732 0.279 % 56.19% 60.40% 60.68% 59.77% –– involving Extra-European inventors 480 1979 2014 4473 3.196 0.018 % 6.47% 12.55% 10.29% 10.46% –– Co-invention with Extra-EU inventors b 480 1979 2014 4473 3.196 0.018 Share of US-CA-JP inventors 198 896 797 1891 3.025 0.110 % 41.25% 45.28% 39.57% 42.28% –– Share of BRICS inventors 5 3 8 8 1 124 15.200 1.132 % 1.04% 1.92% 4.02% 2.77% –– Share of other Extra-EU inventors 29 104 147 280 4.069 0.413 % 6.04% 5.26% 7.30% 6.26% –– Share of EU inventors 247 941 987 2175 2.996 0.049 % 51.46% 47.55% 49.01% 48.63% –– aAn EU patent is an EPO patent involving at least one European inventor bThe whole is less than the sum of the parts because of European co-patents with extra-EU inventors may involve both US, CAN, JP, BRICS and other inventors
Table 3 Cumulative statistics and growth rate of biotech EPO and EU patents from 1980 to 2010 Variables CumPat 1980–1990 CumPat 1990–2000 CumPat 2000–2010 CumPat 1980–2010 GrwRate 80–90/00–10 GrwRate 90–00/00–10 EPO patents 19,545 50,548 56,007 126,100 1.866 0.108 Number of individual EPO patents 3970 8084 8347 20,401 1.103 0.033 % 20.31% 15.99% 14.90% 16.18% –– Number of co-invented EPO patents 15,575 42,464 47,660 105,699 2.060 0.122 % 79.69% 84.01% 85.10% 83.82% –– EU patents a 7061 18,473 20,885 46,419 1.958 0.131 Number of individual EU patents 1357 2652 2677 6686 0.973 0.009 % 19.22% 14.36% 12.82% 14.40% –– Number of co-invented EU patents 5704 15,821 18,208 39,733 2.192 0.151 % 80.78% 85.64% 87.18% 85.60% –– Co-invented EU patents 5704 15,821 18,208 39,733 2.192 0.151 within the same region 2002 4675 5518 12,195 1.756 0.180 % 40.29% 36.98% 37.23% 37.60% –– among European regions 2967 7968 9303 20,238 2.135 0.168 % 59.71% 63.02% 62.77% 62.40% –– involving Extra-European inventors 735 3178 3387 7300 3.608 0.066 % 12.89% 20.09% 18.60% 18.37% –– Co-invention with Extra-EU inventors b 735 3178 3387 7300 3.608 0.066 Share of US-CA-JP inventors 298 1455 1426 3179 3.785 0.020 % 40.54% 45.78% 42.10% 43.55% –– Share of BRICS inventors 15 46 82 143 4.467 0.783 % 2.04% 1.45% 2.42% 1.96% –– Share of other Extra-EU inventors 47 175 201 423 3.277 0.149 % 6.39% 5.51% 5.93% 5.79% –– Share of EU inventors 375 1501 1679 3555 3.477 0.119 % 51.02% 47.23% 49.57% 48.70% –– aAn EU patent is an EPO patent involving at least one European inventor bThe whole is less than the sum of the parts because of European co-patents with extra-EU inventors may involve both US, CAN, JP, BRICS and other inventors
Table 4 Cumulative statistics and growth rate of laser and optic technology EPO and EU patents from 1980 to 2010 Variables CumPat 1980–1990 CumPat 1990–2000 CumPat 2000–2010 CumPat 1980–2010 GrwRate 80–90/00–10 GrwRate 90–00/00–10 EPO patents 16,768 30,010 31,069 77,847 0.853 0.035 Number of individual EPO patents 6265 9427 9379 25,071 0.497 0.005 % 37.36% 31.41% 30.19% 32.21% –– Number of co-invented EPO patents 10,503 20,583 21,690 52,776 1.065 0.054 % 62.64% 68.59% 69.81% 67.79% –– EU patents a 6419 9768 10,138 26,325 0.579 0.038 Number of individual EU patents 2688 3374 3024 9086 0.125 0.104 % 41.88% 34.54% 29.83% 34.51% –– Number of co-invented EU patents 3731 6394 7114 17239 0.907 0.113 % 58.12% 65.46% 70.17% 65.49% –– Co-invented EU patents 3731 6394 7114 17,239 0.907 0.113 within the same region 1760 2752 2949 7461 0.676 0.072 % 48.94% 47.46% 45.75% 47.10% –– among European regions 1836 3047 3497 8380 0.905 0.148 % 51.06% 52.54% 54.25% 52.90% –– involving Extra-European inventors 135 595 668 1398 3.948 0.123 % 3.62% 9.31% 9.39% 8.11% –– Co-invention with Extra-EU inventors b 135 595 668 1398 3.948 0.123 Share of US-CA-JP inventors 59 271 271 601 3.593 0.000 % 43.70% 45.55% 40.57% 42.99% –– Share of BRICS inventors 2 1 7 2 4 4 3 11.000 0.412 % 1.48% 2.86% 3.59% 3.08% –– Share of other Extra-EU inventors 6 2 0 3 5 6 1 4.833 0.750 % 4.44% 3.36% 5.24% 4.36% –– Share of EU inventors 69 287 337 693 3.884 0.174 % 51.11% 48.24% 50.45% 49.57% –– a An EU patent is an EPO patent involving at least one European inventor b The whole is less than the sum of the parts because of European co-patents with extra-EU inventors may involve both US, CAN, JP, BRICS and other inventors
Table 5 Cumulative statistics and growth rate of nanotech EPO and EU patents from 1980 to 2010 Variables CumPat 1980–1990 CumPat 1990–2000 CumPat 2000–2010 CumPat 1980–2010 GrwRate 80–90/00–10 GrwRate 90–00/00–10 EPO patents 66 1313 3284 4663 48.758 1.501 Number of individual EPO patents 20 269 631 920 30.550 1.346 % 30.30% 20.49% 19.21% 19.73% –– Number of co-invented EPO patents 46 1044 2653 3743 56.674 1.541 % 30.30% 20.49% 19.21% 19.73% –– EU patents a 24 422 1077 1523 43.875 1.552 Number of individual EU patents 5 8 1 173 259 33.600 1.136 % 20.83% 19.19% 16.06% 17.01% –– Number of co-invented EU patents 19 341 904 1264 46.579 1.651 % 79.17% 80.81% 83.94% 82.99% –– Co-invented EU patents 19 341 904 1264 46.579 1.651 within the same region 7 114 322 443 45.000 1.825 % 43.75% 39.45% 41.60% 41.06% –– among European regions 9 175 452 636 49.222 1.583 % 56.25% 60.55% 58.40% 58.94% –– involving Extra-European inventors 3 5 2 130 185 42.333 1.500 % 15.79% 15.25% 14.38% 14.64% –– Co-invention with Extra-EU inventors b 3 5 2 130 185 42.333 1.500 Share of US-CA-JP inventors 1 2 2 5 7 8 0 56.000 1.591 % 33.33% 42.31% 43.85% 43.24% –– Share of BRICS inventors 0 1 4 5 – 3.000 % 0.00% 1.92% 3.08% 2.70% –– Share of other Extra-EU inventors 0 3 9 1 2 – 2.000 % 0.00% 5.77% 6.92% 6.49% –– Share of EU inventors 2 2 7 6 2 9 1 30.000 1.296 % 66.67% 51.92% 47.69% 49.19% –– a An EU patent is an EPO patent involving at least one European inventor b The whole is less than the sum of the parts because of European co-patents with extra-EU inventors may involve both US, CAN, JP, BRICS and other inventors
6
Conclusion
Innovation activity in the EU has shown a persistent pattern of growth, particularly in the last decade (2000–2010). Some of our results deserve special attention. First, we must emphasize the rise of collective co-inventions, considering the dimension of intra-regional and inter-regional inventive networks.
Second, the concentrations of innovation activity appear to be long-term struc-tural features of these EU regions, with the most innovative central kernel of EU integrating some regions from Eastern Europe, southern England, southern Norway, Sweden and Finland in with Germany, Holland, and Denmark. There was a remarkable innovative presence in the European sunbelt, which connects Italy and France. In Spain, only Catalonia and Madrid have become more advanced innovative regions.
Third, despite the addition of policies and programs, the original innovative divide of the early 1980s has not changed. Novel innovative sectors like green technology, biotechnology, laser and optic technology, and nanotechnology have emerged in the same places older innovators worked in the post-war period. The Fig. 8 Patent intensity by region and innovation sector
overlap of old and new sectors underscores the importance of regional branching
(Boschma and Frenken2011; Tanner2014). Regions with the highest number of
cumulative inventors also have high co-invention levels and the dynamics of innovation are more sustained. From 1980 to 2010, the number of inventors per patent continued to grow, and in the case of new sectors, this trend is even higher. Fourth, in regions characterized by lower levels of innovation, co-inventions made up a large amount of the total number of patents. This suggests that weaker regions resort to external knowledge flows to balance their technological inferiorities, and accessing new radical knowledge is facilitated through connections with other EU programs. However, the role of partnering strategies and different knowledge flows from advanced to less developed regions deserves further investigation.
Acknowledgements This EU research project was funded under the FP7 grant number 320131, SMARTSPEC.
Appendix
Table 6 Technological manufacturing industry classifications Manufacturing
industry NACE codes (2-digit level)
High-technology 21 Manufacture of basic pharmaceutical products and pharmaceutical preparations
26 Manufacture of computer, electronic and optical products
Medium-high-technology
20 Manufacture of chemicals and chemical products
27–30 Manufacture of electrical equipment, manufacture of machinery and equipment n.e.c., manufacture of motor vehicles, trailers and semi-trailers, manufacture of other transport equipment
Medium-low-technology
19 Manufacture of coke and refined petroleum products
22–25 Manufacture of rubber and plastic products, manufacture of other non-metallic mineral products, manufacture of basic metals, manufacture of fabricated metal products (except machinery and equipment) 33 Repair and installation of machinery and equipment
Low-technology 10–18 Manufacture of food products, beverages, tobacco products, textiles, wearing apparel, leather and related products, wood and of products of wood, paper and paper products, printing and reproduction of recorded media.
Table 7 NACE Rev. 2—IPC V8 concordance (NACE 2-digit level)
NACE Sector definition Patents’ IPC
10 Manufacture of food products A01H A21D A23B A23C A23D A23F
A23G A23J A23K A23P C12J C13F C13J C13K A23L001 A23L003 C13B A01J
11 Manufacture of beverages C12C C12F C12G C12H A23L002
12 Manufacture of tobacco products A24B A24D A24F
13 Manufacture of textiles D06C D04G D04H D06J D06M D06P
D06Q D04D D06N
14 Manufacture of wearing apparel A41B A41C A41D A41F
15 Manufacture of leather and related products
A43B A43C B68B B68C
16 Manufacture of wood and of products of
wood and cork, except furniture; Manufacture of articles of straw and plaiting materials
B27D B27H B27M B27N
17 Manufacture of paper and paper products B42F D21C D21H D21J
18 Printing and reproduction of recorded media
B41M B42D B44F
19 Manufacture of coke and refined
petroleum products
C10G C10L
20 Manufacture of chemicals and chemical
products C07B C07C C07F C07G C12S C40B C08B C08F C08G C08K C08L C05B C05C C05D C05F C05G C09B C09C C09K C10B C10C C10H C10J C10K C01B C01C C01D C01F C01G C25B B01J F25J B09B B09C C02F G21F C08J F17C F17D A01N A01P C09D B27K C09F C11D D06L A61K008 A61Q C08H C06D C09G C09H C09J C10M C11B C11C C23F C23G C14C A62D D01C C10N C06C C06B F42B F42D D01F
21 Manufacture of basic pharmaceutical
products and pharmaceutical preparations
A61P C07D C07H C07J C07K C12N C12P C12Q A61K (except A61K008) 22 Manufacture of rubber and plastic
products
B67D B29C B29D B60C C08C B29B
23 Manufacture of other non-metallic
mineral products
B32B C03C C03B B28B B28C E03D C04B
24 Manufacture of basic metals B22D C21B C21C C21D C22B C22C
C22F C25C C25F B21C G21H
25 Manufacture of fabricated metal
products, except machinery and equipment
B21G F27D A44B A47H F22B F22G F24J F16T F17B G21C G21D G21B B63G F41A F41B F41C F41F F41G F41H F41J F42C G21J B22F C23D C25D E05B E05D E05F E06B A01L F16B E05C
Table 7 (continued)
NACE Sector definition Patents’ IPC
26 Manufacture of computer, electronic and optical products G11C H01C H01F H01G H01J H01L H05K C30B B82B B81B B81C B82Y G06C G06D G06E G06F G06G G06J G06N G06T G02F G09C G08B H04B H04J H04K H04M H04Q H04L H03B H03C H03D H03G H03H H03M G03H H03J H04H H04N H04R H04S H04W H01Q H01S H03K H03L H03F F15C G01B G01C G01D G01F G01H G01J G01M G01N G01R G01S G01W G12B G01Q G04R G01V G01K G01L G05B G08C G05F G04B G04C G04D G04F G04G A61N H05G G21K H05H G02B G02C G03B G03C
27 Manufacture of electrical equipment H02K H02N H02P H02B H02J H01M
H01B H02G H01H H01R F21H F21K F21L F21M F21S F21V H01K F21P F21Q F21W F21Y A21B A45D A47G A47J A47L B01B D06F E06C F24B F24C F24D F25C F25D H05B B60M B61L G08G G10K H01T H02H H02M H05C H01P
28 Manufacture of machinery and
equipment N.E.C. B23F F01B F01C F01D F03B F03C F03D F03G F04B F04C F04D F23R F15B F16C F16D F16F F16H F16K F16M G05D G05G F01K F01M F01N F01P F02G F02C F02K A47K F23G F27B B66B B66D B66F B61B B60S E02C G07B G07C G07D G07F G07G G09D G09G G11B B41J B41K B43M G06K G06M G10L G03G F24F F24H F28F H05F G01G C10F B01D B04C B05B A62C F23J B65G B66C C12L F22D F23B F23C F23D F23H F23K F23L F23M F25B F28B F28C F28D F28G F16G F23N A01B A01C A01D A01F A01G A01K A01M B27L B24D B21K B21L B25B B25C B25F B25G B25H B26B B27G B21D B21F B21H B21J B23B B23C B23D B23G B23H B23K B23P B23Q B24B B24C B25D B25J B26F B27B B27C B27F B27J B28D B30B B44C B65F001 B65F005 B65F007 B65F009 F15D A21C A22B A22C A23N A24C A41H A42C A43D B02B B02C B05C B05D B06B B07B B07C B08B B21B B22C B26D B31B B31C B31D B31F B41B B41C B41D B41F B41G B41L B41N B42B B42C B44B B65B B65C B65H B67B B67C (continued)
Table 7 (continued)
NACE Sector definition Patents’ IPC
B68F C13C C13D C13G C13H C23C D06G D06H D21B D21D D21G E01C E02D E02F E21B E21D E21F F04F F16N F26B E01D E01F E21C D01B D01D D01G D01H D02G D02H D02J D03C D03D D03J D04B D04C D05B D05C D06B D21F E05G E01H B01F B03B B03C B03D C14B F16P 29 Manufacture of motor vehicles, trailers
and semi-trailers
B60B B60D B60G B60H B60J B60K B60L B60N B60P B60Q B60R B60T B62D F01L F02B F02D F02F F02M F02N F02P F16J G01P B60W
30 Manufacture of other transport
equipment B65F003 B60F B60V B61C B61D B61F B61G B61H B61J B61K B62C B62H B62J B62K B62L B62M B63B B63C B63H B63J B64B B64C B64D B64F B64G E01B F03H
31 Manufacture of furniture A47B A47C A47D A47F
32 Other manufacturing F16L A45C D07B A41G A42B A44C
A45B A45F A46B A46D A63B A63C A63D A63F A63G A63H A63J A63K B43K B43L B44D B62B B68G C06F F23Q G10B G10C G10D G10F G10G G10H A61B A61C A61D A61F A61G A61H A61J A61L A61M C12M not A61K except A61K 8/* B01L B04B G01T G21G A62B G09B G09F G03D G03F
42 Civil engineering E03B E03C E02B
43 Specialised construction activities E04G E04B E04C E04D E04F E03F
E04H
62 Computer programming, consultancy
and related activities
G06Q
Co-IPC
Remove this code and allocate by following the Co-IPC
F16S B29K B29L C12R
Note: We associated IPC B65D to prevalent NACE 22, even though it should be associated to NACE 13 (5.88%), 22 (35.96%), 23 (21.31%), 25 (15.17%), 17 (20.44%) and 16 (1.25%); IPC B65F001, B65F005, B65F007, B65F009 are associated to NACE 28, whereas the IPC B65F003 to NACE 30; A61K and A61K008 are respectively associated to NACE 21 and 20; C07B, C07C, C07F, C07G, C12M, C12S and C40B are associated to NACE 20
Table 8 Innovative industry classifications
Sectors Patents’ IPC
Biotechnology A01H001/00 A01H004/00 A61K038/00 A61K039/00 A61K048/00
C02F003/34 C40B040/00 C40B070/00 C40B080/00 C40B010/00 G01N027/327 G01N033/53 G01N033/54 G01N033/55 G01N033/57 G01N033/74 G01N033/76 G01N033/78 G01N033/88 G01N033/92 C12N C12P C12Q
Nanotechnology B81B B82B B82Y
Green technology A01G023/00 A01G025/00 A01H A01N025/00 A01N065/00 A43B001/
12 A43B021/14 A61L011/00 A62D003/00 A62D003/02 A62D101/00 B01D045/00 B01D051/00 B01D053/00 B01D053/02 B01D053/04 B01D053/047 B01D053/14 B01D053/14 B01D053/22 B01D053/24 B01D053/62 B01D053/92 B01D053/96 B03B009/06 B03C003/00 B09B B09C B22F008/00 B29B017/00 B60K006/00 B60K006/10 B60K006/20 B60K006/28 B60K006/30 B60K016/00 B60L003/00 B60L007/10 B60L007/22 B60L008/00 B60L009/00 B60L011/16 B60L011/18 B60W010/26 B60W020/00 B61D017/02 B62D035/00 B62D035/02 B62D067/00 B62K B62M001/00 B62M003/00 B62M005/ 00 B62M006/00 B63B001/34 B63B001/40 B63B035/00 B63B035/32 B63H009/00 B63H013/00 B63H016/00 B63H019/02 B63H019/04 B63H021/18 B63J004/00 B64G001/44 B65F B65G005/00 C01B031/20 C01B033/02 C02F C04B007/24 C04B0077/30 C04B018/04 C04B018/ 10 C05F C08J011/00 C08J011/04 C08J011/28 C09K003/22 C09K003/ 32 C09K005/00 C09K011/01 C09K017/00 C10B021/18 C10B053/00 C10B053/02 C10G001/10 C10J C10L005/48 C10L001/00 C10L001/02 C10L001/14 C10L003/00 C10L005/00 C10L005/40 C10L005/42 C10L005/44 C10L005/46 C10L005/48 C10L005/48 C10L009/00 C10L010/02 C10L010/06 C11B011/00 C11B013/00 C11B013/04 C12M001/107 C12N001/13 C12N001/15 C12N001/21 C12N005/10 C12N015/00 C12P005/02 C14C003/32 C21B003/04 C21B005/06 C21B007/22 C21C005/38 C22B007/00 C22B007/04 C22B019/30 C22B025/06 C23C014/14 C23C016/24 C25C001/00 C30B029/06 D01F013/00 D01F013/04 D01G011/00 D21B001/08 D21B001/32 D21C005/02 D21C011/00 D21F005/20 E02B015/04 E02D003/00 E03C001/12 E03F E04B001/90 E04B001/62 E04B001/74 E04B001/80 E04B001/88 E04B002/00 E04B005/00 E04B007/00 E04B009/00 E04C001/41 E04C001/40 E04C002/284 E04C002/296 E04D001/28 E04D003/35 E04D013/00 E04D013/16 E04D013/18 E04F013/08 E04F015/18 E04H001/00 E04H012/00 E06B003/263 E21B041/00 E21B043/16 E21F017/16 F01K F01N003/00 F01N003/38 F01N009/00 F02B043/00 F02B075/10 F02C001/05 F02C003/28 F02C006/18 F02M021/02 F02M027/02 F03D F03D011/04 F03G004/00 F03G004/06 F03G005/00 F03G005/08 F03G006/00 F03G006/06 F03G007/04 F03G007/05 F03G007/08 F16H003/00 F16H003/78 F16H048/00 F16H048/30 F21K099/00 F21L004/00 F21L004/02 F21S009/03 F22B001/00 F22B001/02 F23B080/02 F23B090/00 F23C009/00 F23G F23J007/00 F23J015/00 F24D003/00 F24D005/00 F24D011/00 F24D011/02 F24D015/04 F24D017/00 F24D017/02 F24D019/00 F24F005/00 F24F012/00 F24H004/00 F24H007/00 F24J001/00 F24J002/00 F24J002/04 F24J002/06 F24J002/42 F24J002/54 F24J003/ 00 F24J003/06 F24J003/08 F25B027/00 F25B027/02 F25B030/00 F25B030/06 F25J003/02 F26B003/00 F26B003/28 F27B001/18 (continued)
References
Allen, R. C. (1983). Collective invention.Journal of Economic Behavior and Organization, 4, 1–24.
Arrow, K. (1962). The economic implications of learning by doing.Review of Economic Studies, 29(3), 155–173.
Asheim, B. T., & Isaksen, A. (2002). Regional innovation systems: The integration of local ‘sticky’ and global ‘ubiquitous’ knowledge.The Journal of Technology Transfer, 27(1), 77–86. Asheim, B. T., Smith, H. L., & Oughton, C. (2011). Regional innovation systems: Theory,
empirics and policy.Regional Studies, 45, 875–891.
Basalla, G. (1988).The evolution of technology. Cambridge: Cambridge University Press. Bonaccorsi, A. (2011). A functional theory of technology and technological change. InHandbook
on the economic complexity of technological change (p. 286). Cheltenham: Edward Elgar. Boschma, R., & Frenken, K. (2010). The spatial evolution of innovation networks. A proximity
perspective. In The handbook of evolutionary economic geography (pp. 120–135). Cheltenham: Edward Elgar.
Boschma, R. A., & Frenken, K. (2011). Technological relatedness and regional branching. In H. Bathelt, M. P. Feldman, & D. F. Kogler (Eds.),Dynamic geographies of knowledge creation and innovation (pp. 64–81). London: Routledge.
Cassi, L., & Plunket, A. (2015). Research collaboration in co-inventor networks: Combining closure, bridging and proximities.Regional Studies, 49(6), 936–954.
Chesbrough, H. (2003a). The era of open innovation.The MIT Sloan Management Review, 44 (Spring), 35–41.
Chesbrough, H. (2003b). The logic of open innovation: Managing intellectual property.California Management Review, 45(3), 33–58.
Clark, J., Freeman, C., & Soete, L. (1984). Long waves, inventions and innovations. In C. Freeman (Ed.),Long waves and the world economy. London: Frances Pinter.
D’Aveni, R. (1994).Hypercompetition. New York: The Free Press.
Dosi, G. (1982). Technological paradigms and technological trajectories: A suggested interpretation of the determinants and directions of technical change.Research Policy, 11(3), 147–162.
Eurostat. (2007).Eurostat indicators on high-tech industry and knowledge – Intensive services, Annex 6 – High-tech aggregation by patents.
Eurostat. (2014).Aggregations of manufacturing based on NACE Rev. 2, Annex 3 – High-tech aggregation by NACE Rev. 2.
Table 8 (continued)
Sectors Patents’ IPC
F27B015/12 F27D017/00 F28D017/00 F28D020/00 F28D020/02 G01R G02B007/183 G05F001/67 G06Q G08B021/12 G08G G21B G21C G21D G21F009/00 H01G009/155 H01G009/20 H01J009/50 H01J009/ 52 H01L025/00 H01L025/03 H01L025/16 H01L025/18 H01L027/142 H01L027/30 H01L031/00 H01L031/058 H01L031/078 H01L033/00 H01L033/64 H01L051/42 H01L051/48 H01L051/50 H01M002/00 H01M002/04 H01M004/86 H01M004/98 H01M006/52 H01M008/00 H01M008/24 H01M010/44 H01M010/46 H01M010/54 H01M012/00 H01M012/08 H01M014/00 H02J H02K007/18 H02K029/08 H02K049/ 10 H02N006/00 H02N010/00 H05B033/00
Laser and optic technology
Fleming, L. (2001). Recombinant uncertainty in technological search.Management Science, 47 (1), 117–132.
Freeman, C. (1991). Network of innovators: A synthesis of research issue.Research Policy, 20, 499–514.
Freeman, C. (1994).The handbook of industrial innovation. Cheltenham: Edward Elgar. Gay, C., Latham, W., & Le Bas, C. (2008). Collective knowledge, prolific inventors and the value
of inventions: An empirical study of French, German and British patents in the US, 1975–1999. Economics of Innovation and New Technology, 17(1–2), 5–22.
Jaffe, A., Trajtenberg, M., & Henderson, R. (1993). Geographic localization of knowledge spillovers as evidenced by patent citations.Quarterly Journal of Economics, 108, 577–598. Jewkes, J., Sawers, D., & Stillerman, R. (1958).The sources of invention. London: Macmillan. Lane, D. A. (2011). Complexity and innovation dynamics. InHandbook on the economic complexity of
technological change (Vol. 63). Cheltenham: Edward Elgar.
Malerba, F. (1992). Learning by firms and incremental technical change.The Economic Journal, 102(2), 845–859.
Mokyr, J. (2000, January). Evolutionary phenomena in technological change. InTechnological innovation as an evolutionary process (pp. 52–65). Cambridge: Cambridge University Press. Pavitt, K. (1984). Sectoral patterns of technical change: Towards a taxonomy and a theory.
Research Policy, 13(6), 343–373.
Pavitt, K. (1999).Technology, management and systems of innovation. Cheltenham: Edward Elgar.
Powell, W. W. (1998). Learning from collaboration: Knowledge and networks in the biotechnology and pharmaceutical industries.California Management Review, 40(3), 228–240.
Powell, W. W., & Giannella, E. (2010). Collective invention and inventor networks.Handbook of the Economics of Innovation, 1, 575–605.
Rallet, A., & Torre, A. (1999). Is geographical proximity necessary in the innovation networks in the era of global economy?GeoJournal, 49(4), 373–380.
Rosenberg, N. (1976).Perspectives on technology. Cambridge: Cambridge University Press. Rosenberg, N. (1982).Inside the black box: Technology and economics. Cambridge: Cambridge
University Press.
Schumpeter, J. (1934).The theory of economic development. Cambridge: Harvard University Press.
Schumpeter, J. (1947). The creative response in history.Journal of Economic History, 7(02), 149–159.
Strumsky, D., Lobo, J., & Van der Leeuw, S. (2011).Measuring the relative importance of reusing, recombining and creating technologies in the process of invention, SFI Working Paper.
Strumsky, D., Lobo, J., & Van der Leeuw, S. (2012). Using patent technology codes to study technological change.Economics of Innovation and New technology, 21(3), 267–286. Tanner, A. N. (2014). Regional branching reconsidered: Emergence of the fuel cell industry in
European regions.Economic Geography, 90(4), 403–427.
Ter Wal, A. L. (2013). The dynamics of the inventor network in German biotechnology: Geographic proximity versus triadic closure.Journal of Economic Geography, 14, 589–620.
Tushmann, M., & Anderson, P. (1986). Technological discontinuities and organizational environments.Administrative Science Quarterly, 31, 439–465.
Van Looy, B., Vereyen, C., & Schmoch, U. (2014, October).Patent statistics: Concordance IPC V8 – NACE REV.2, Eurostat, Euopean Commission.
Weitzman, M. L. (1998). Recombinant growth.Quarterly Journal of Economics, 331–360. Youn, H., Bettencourt, L., Strumsky, D., & Lobo, J. (2014).Invention as a combinatorial process: