P
OLITECNICO DIM
ILANODIPARTIMENTO
DI
ELETTRONICA,
INFORMAZIONE
E
BIOINGEGNERIA
D
OTTORATO DIR
ICERCA INB
IOINGEGNERIABrain functional connectivity in resting state:
methods for networks identification and noise separation
in healthy subjects and Alzheimer’s disease
Doctoral dissertation of:
Ludovica Griffanti
Advisors:
Prof. Giuseppe Baselli
Prof. Stephen M. Smith
Dr. Francesca Baglio
Tutor:
Prof. Andrea Aliverti
Chair of the PhD program:
Prof. Maria Gabriella Signorini
XXVI edition
2011-2013
Acknowledgements
I want to thank many people that have helped me professionally and personally over the last three years.
First of all, I would like to thank Prof. Giuseppe Baselli for his brilliant suggestions and continuous help, particularly in writing and reviewing papers and this thesis, and his willingness to do so at any time.
My deepest gratitude goes to Prof. Stephen Smith for having been my mentor during my visiting period in Oxford. He was always helpful and gave me the opportunity of performing my research work at a high level in one of the most advanced research centres in the world.
Thank you, Francesca Baglio: an advisor and a real friend. I wish to thank her for her passion for research and care for patients that she passed on to me and all her collaborators, and for her enthusiasm, help and support, both at work and in daily life.
I would like to thank all the great people whom I had the opportunity to meet during my path, who helped me in this work with their precious suggestions: Prof. Christian Beckmann, Dr. Karla L. Miller, Dr. Gholamreza Salimi-Khorshidi, Dr. Gwenaëlle Douaud, Dr. Nicola Filippini, Dr. Eugene Duff.
Special thanks go to the other people in my laboratory, who have become friends during these years: Marcella, Giulia, Lea, Paola, Gisella, Monia, Valeria, Chiara P, Serena, Chiara I, Niels, Eleonora, Ottavia, thanks to you every working day has been funnier. Thanks to the people who played the same role in Oxford: Marina, Lisa, Kostas, Anderson, Moises, Eni, Saad, and many others.
I wish to thank all the medical doctors, operators, staff and teams of the Don Gnocchi Foundation. A sincere thanks goes to all the patients, who demonstrated trust in medicine and research.
I’m grateful to all my friends: Roberta, Sarah, Silvia, Erica, Marta, Patrizia, Caterina, Marta B, Valeria, Francesca and many others, for being always present, even if not physically, at any time.
A thought goes to my brother, in the hopes that he will become an honest man and will be successful in focusing his great intelligence on important goals. Last but not least, I wish to thank my mum and dad for their help in every circumstance and for always believing in me.
Contents
Contents ... 3
Abstract - English ... 7
Abstract - Italiano ... 9
Extended summary ... 11
Chapter 1- Background and aim ... 28
1.1. Functional MRI, Resting State functional MRI and functional connectivity ... 28
1.2. Functional connectivity analysis methods ... 32
1.3. Limitations and future perspectives of RS-fMRI functional connectivity analyses ... 37
1.4. Functional connectivity changes in Alzheimer's disease ... 38
1.5. Aims of the Study ... 39
1.6. Thesis structure and author's personal contribution ... 40
1.7. Scientific publications ... 42
1.7.1. Publications based on this study ... 42
1.7.2. Other scientific publications ... 44
Chapter 2 - Individual thresholding of seed-based functional connectivity maps: estimation of random errors by means of surrogate time series. ... 48
2.1. Introduction ... 48
2.2. Materials and methods ... 49
2.2.1. Subjects and MRI data acquisition ... 49
2.2.2. RS-fMRI data preprocessing and generation of seed-based FC maps ... 49
2.2.3. Estimation of random errors by means of surrogate time series ... 50
2.2.4. Thresholding methods for single-subject FCmaps ... 51
2.3. Results ... 51
2.4. Discussion and Conclusions ... 53
Chapter 3 - Automated artefact detection based on Independent Component Analysis and hierarchical fusion of classifiers: evaluation of accuracy ... 55
3.1. Introduction ... 55
3.2. Methodological basis of the cleaning algorithm (FIX) ... 59
3.3. Methods ... 71
3.3.1. Subjects and MRI data acquisition ... 71
3.3.2. RS-fMRI data preprocessing and manual labelling of single-subject ICA components ... 72
3.3.3. Accuracy test and performance indices ... 72
3.4. Results ... 73
3.5. Discussion and Conclusions ... 75
Chapter 4 - ICA-based artefact removal and accelerated fMRI acquisition for improved Resting State Network imaging ... 77
4.1. Introduction ... 77
4.2. Methods ... 78
4.2.1. Subjects and MRI data acquisition ... 78
4.2.2. RS-fMRI data preprocessing ... 79
4.2.3. Creation of group-ICA RSN templates ... 80
4.2.4. Automated classification and clean-up procedures with FIX ... 81
4.2.5. Dual regression and analyses ... 83
4.3. Results ... 84
4.3.1. Single-subject independent component classification ... 84
4.3.2. Temporal SNR results ... 84
4.3.3. Group ICA components and dual regression - summary ... 85
4.3.4. Time series amplitude analysis ... 86
4.3.5. Time series power spectra ... 88
4.3.6. Network analyses ... 91
4.3.7. Spatial maps analysis ... 96
4.4. Discussion ... 99
Chapter 5 - The impact of data-driven cleaning procedures for resting state fMRI on the
detection of DMN functional connectivity alterations in Alzheimer's disease ... 103
5.1. Introduction ... 103
5.2. Materials and methods ... 104
5.2.1. Subjects and MRI data acquisition ... 104
5.2.2. Voxel-based morphometry (VBM) analysis ... 105
5.2.3. RS-fMRI data preprocessing and cleaning approaches ... 106
5.2.4. Measures of BOLD signal variation ... 107
5.2.5. Functional connectivity analyses ... 107
5.2.6. Statistical analysis ... 108
5.3. Results ... 108
5.3.1. VBM results ... 108
5.3.2. Effect of cleaning on BOLD signal variation ... 109
5.3.3. Within-group consistency results ... 111
5.3.4. Between-group differences in FC analysis ... 113
5.4. Discussion ... 114
5.5. Conclusion ... 117
Chapter 6 – Future developments: towards a detailed parcellation of the brain for the detection of functional connectivity alterations ... 118
6.1. Introduction ... 118
6.2. Materials and methods ... 119
6.2.1. Subjects, MRI data acquisition and Preprocessing ... 119
6.2.2. Low-dimensional ICA analysis ... 120
6.2.3. High-dimensional ICA analysis ... 120
6.3. Results ... 121
6.3.1. Low dimensional ICA results ... 121
6.3.2. High dimensional ICA results ... 123
6.5. Conclusion ... 129
Chapter 7 – Discussion and conclusion ... 130
Appendix - Processing pipelines and software used ... 137
Abbreviations ... 139
Abstract - English
Aim - The aim of this study was to optimize and validate objective methods of signal detection
vs. noise for the investigation of brain functional connectivity with resting state functional magnetic resonance imaging in healthy subjects and patients with Alzheimer’s disease.
Background - Resting-state functional magnetic resonance imaging (RS-fMRI) is a widespread
and powerful technique for investigating the functional connectivity (FC) of the human brain. With this technique it is possible to study different Resting State Networks (RSNs) that are associated with specific brain functions, and that can be altered in pathological conditions. Although several analysis methods are currently used for the analysis of RS-fMRI data, a common problem is the separation of noise from the neural-related signal of the RSNs, due to the absence of a model for neural activity. Hence, effective methods for the correct identification and removal of the artefacts from the data (cleaning or clean-up) are needed to obtain reliable FC analyses. This is particularly important in Alzheimer's disease (AD), as the decreased functional connectivity of the default mode network (DMN), quantified on RS-fMRI data, is becoming a possible new biomarker for this pathology. Therefore an early diagnosis and a detailed characterization of this alteration are crucial.
Protocols and results - (i) Methodological developments. The amount of FC estimation errors
in seed-based FC analyses was quantified through surrogate data analysis and two approaches for FC maps thresholding have been introduced in order to increase the reliability of single-subject FC analyses. Further, an automated denoising method (FMRIB's ICA-based X-noisefier - FIX), developed in collaboration with the FMRIB (Functional Magnetic Resonance Imaging of the Brain) Centre (University of Oxford, UK), allowed to further improve the FC estimation as, through the cleaning of the raw single-subject data, it can be applied to any FC analysis. The cleaning procedure with FIX consists of the following major operations: single-subject spatial independent component analysis (ICA), component-wise feature extraction, classifier training, components classification, and removal of the artefactual components from the data. FIX achieved over 95% classification (signal vs noise) accuracy for the training sub-sets built by hand-labelling the single-subject independent components (ICs) in three different datasets. The procedure for artefact removal was then optimized, testing the efficacy of several cleaning options on different acquisition sequences (standard EPI and multi-band slice accelerated EPI) at two group ICA model orders (low- and high-dimensional ICA) by means of time series (time series amplitude and spectra), network matrices, and spatial maps analyses.
(ii) Applications. The impact of different data-driven cleaning approaches for RS-fMRI data was evaluated on a population of aged healthy controls and patients with mild to moderate Alzheimer’s
disease (AD). Among the tested approaches, the cleaning procedure with FIX showed to be the most effective in correctly detecting the typical FC alteration of the default mode network (DMN) in AD patients. Finally, we obtained promising results for a better localisation and quantification of FC alterations in AD on two RSNs of interest through the combination of an effective cleaning procedure and high-dimensional spatial and temporal RSNs analyses.
Conclusion - The present work has demonstrated and validated both the optimization of known
protocols and also novel approaches in basically two directions: 1) an effective cleaning of RS-fMRI data for reliable FC analyses; 2) a more detailed parcellation of the brain and the analysis of the temporal information with time series and network analyses. The discussed results are promising towards an early and accurate detection of FC alterations in pathological conditions and their monitoring at different stages, and support future developments for the definition of reliable non-invasive biomarkers for AD and other pathologies.
Keywords: resting state functional magnetic resonance imaging; functional connectivity; artefact
Abstract - Italiano
Scopo – Lo scopo di questa tesi è stato quello di ottimizzare e validare metodi obiettivi per
l’identificazione del segnale riguardante l’attività neurale rispetto al rumore per lo studio della connettività funzionale cerebrale in soggetti sani e pazienti con malattia di Alzheimer.
Introduzione – La risonanza magnetica funzionale a riposo (resting state functional magnetic
resonance imaging, RS-fMRI) è una tecnica molto diffusa e utilizzata per lo studio della connettività funzionale (CF) del cervello umano. Con questa tecnica è infatti possibile studiare diverse reti cerebrali, le cosiddette Resting State Networks (RSNs), che sono associate a specifiche funzioni e la cui attività può essere alterata in condizioni patologiche. Sebbene esistano attualmente diversi metodi per l’analisi dei dati di RS-fMRI, un problema commune è quello della difficile separazione del rumore dal segnale relativo all’attività neurale delle RSNs, a causa dell’assenza di un modello dell’attività neurale a riposo. Per questo motivo sono necessari metodi efficaci per la corretta identificazione e rimozione degli artefatti dai dati, al fine di ottenere analisi di CF affidabili. L’ottenimento di misure di CF affidabili è particolarmente importante nella malattia di Alzheimer (Alzheimer's disease, AD), poichè la diminuzione di FC osservata in pazienti con AD all’interno della cosiddetta default mode network (DMN) e quantificata in dati di RS-fMRI, sta diventando un possibile nuovo biomarker per questa patologia. Perciò una diagnosi precoce e una caratterizzazione dettagliata di questa alterazione sono di cruciale importanza.
Metodi e Risultati – (i) Sviluppi metodologici. E’ stato quantificato l’errore di stima in analisi
di CF seed-based (calcolata cioè come la correlazione tra il segnale in un’area specifica, detta seed e il resto del cervello) attraverso l’utilizzo di serie temporali surrogate e sono stati proposti due metodi di sogliatura delle mappe di CF, per aumentare l’affidabilità delle analisi di CF a singolo soggetto. Successivamente, l’introduzione di un metodo di rimozione (cleaning) di artefatti e rumore (FMRIB's ICA-based X-noisefier – FIX), sviluppato in collaborazione con il centro FMRIB (Functional Magnetic Resonance Imaging of the Brain) dell’Università di Oxford (Oxford, UK), ha permesso di migliorare ulteriormente la stima della CF poichè, rimuovendo gli artefatti direttamente dai dati grezzi, può essere applicato a qualsiasi analisi di CF. La procedura di cleaning consiste nei seguenti passaggi principali: analisi delle componenti indipendenti (independent component analysis, ICA), estrazione di caratteristiche spaziotemporali tipiche delle componenti (features), addestramento di un classificatore (training), classificazione delle componenti in segnale o rumore, rimozione delle componenti rumorose dai dati. FIX ha raggiunto una accuratezza di classificazione di oltre il 95% rispetto alla classificazione manuale in tre diversi dataset costruiti classificando manualmente le componenti (independent components, ICs) a singolo soggetto. E’ stata poi
ottimizzata procedura per la rimozione degli artefatti, testando l’efficacia di diverse opzioni di cleaning su dati acquisiti con diverse sequenza (standard EPI e EPI accelerata multiband), usando due diverse dimensionalità per l’analisi ICA di gruppo (bassa e alta dimensionalità), attraverso analisi di serie temporali (ampiezza e spettro delle serie temporali), analisi di rete e analisi delle mappe spaziali.
(ii) Applicazioni. E’ stato valutato l’impatto di diversi approcci di cleaning per i dati di RS-fMRI in una popolazione di soggetti sani anziani e pazienti con malattia di Alzheimer. Tra gli approcci testati, la procedura di cleaning con FIX si è rivelata la più efficace nell’identificare correttamente nei pazienti con AD la tipica alterazione di CF della DMN. Infine, combinando il cleaning con FIX all’analisi ICA di gruppo ad alta dimensionalità sono stati ottenuti risultati promettenti per una miglior localizzazione e quantificazione dell’alterazione funzionale nei pazienti AD in due RSNs di interesse (DMN e network sensorimotoria).
Conclusione – Il presente lavoro ha dimostrato e validato sia l’ottimizzazione di protocolli già
disponibili, sia nuovi approcci, principalmente in due direzioni: 1) l’efficace rimozione del rumore dai dati di RS-fMRI per analisi di CF affidabili; 2) la dettagliata parcellizzazione del cervello e l’analisi dell’informazione temporale attraverso analisi delle serie temporali e analisi di rete. I risultati discussi si sono dimostrati promettenti per l’identificazione precoce ed accurata delle alterazioni di CF in condizioni patologiche e il loro monitoraggio a diversi stadi della patologia, con lo scopo ultimo di poter definire accurati biomarker non invasivi per la malattia di Alzheimer e altre patologie.
Parole chiave: risonanza magnetica funzionale a riposo; connettività funzionale; rimozione di
Extended summary
The present work deals with the study of brain functional connectivity (FC) through resting state functional magnetic resonance imaging (RS-fMRI). This technique addresses Resting State Networks (RSNs) displaying coherent activity, associated with specific brain functions, and altered by pathological conditions. Although several analysis methods are currently used for its analysis, a common issue is the absence of a model for neural activity, which hinder the separation of noise from the neural-related signal from the RSNs. In this thesis this problem is firstly challenged by a preliminary estimation of errors in single-subject seed-based functional connectivity maps and its thresholding through surrogate data. Then, by the development of a tool for the automatic identification and removal of noise in raw single-subject data, by regressing out artefactual independent components (ICs), thus cleaning data prior to any further processing, including group ICA. As to the latter, high-dimensional ICA is used as a powerful approach for obtaining a more detailed parcellation of the brain that allows performing improved spatial, temporal, and network analyses. These methodological innovations are then applied in the challenging field of Alzheimer’s disease, where anatomical, microstructural and behavioural abnormalities hinder the quantitative comparison with normal controls, which is aimed at evidence based diagnosis, follow-up, and prognosis.
Background and aim
Resting-state functional magnetic resonance imaging (RS-fMRI) is a widespread and powerful technique for investigating the functional connectivity (FC) of the human brain. In RS-fMRI studies, subjects are asked to rest quietly while brain images are acquired. The idea which stands behind this approach is that the brain regions similarly modulated by stimuli or tasks, rather than being idle during rest, display instead vigorous and persistent functional activity (Buckner et al., 2008), mainly detected as spontaneous though coherent low-frequency BOLD signal fluctuations. The similarity between the time series in different voxels can be estimated, thus providing measures of functional connectivity (FC, Friston et al., 1993; Biswal et al., 1995). In this way FC is suggested to describe the relationship between the neuronal activation patterns of anatomically separated brain regions, reflecting the level of functional communication between regions (Van Den Heuvel, 2010). With this technique it has been observed that, at rest, the brain is organized into Resting State Networks (RSNs) that can be associated with specific functions (Beckmann et al., 2005; Smith et al., 2009). Today the most studied RSNs are: the default mode network (DMN, the first discovered and most studied RSN), the sensory-motor network, the right and the left lateral networks, the
salience network, the ventral stream network, the task positive network, the primary, the medial and the lateral visual networks, and the auditory network.
Among the different available techniques for FC analysis of RS-fMRI data, the most widespread ones, used in this thesis, are seed-based correlation and independent component analysis. Seed-based correlation was the first method used for RS-fMRI FC analyses (Biswal et al., 1995): one or more regions of interest (ROIs) are a priori selected to evaluate the similarity (e.g., temporal correlation) of their average time course with each other area or single voxel in the brain. The result is a map of brain voxels significantly correlated with the chosen seed ROI or a quantitative assessment of the strength of correlation with the selected target ROI (Golestani and Goodyear, 2011). Independent Component Analysis (ICA) was introduced in fMRI analysis (McKeown et al., 1998) as a data-driven and hypothesis-free analysis method able to decompose RS-fMRI data into spatially independent components. In this way multiple RSNs can be studied simultaneously. ICA does not require RNS areas to be completely non-overlapping, but only that the different sources of signal change are not distributed in the same way, i.e. that knowledge about the spatial distribution of one does not provide any information on the spatial distribution of the other (Beckmann, 2012).
A common problem of all FC analysis methods is the lack of prior knowledge about the temporal signal of interest (no specific task during acquisition), which makes the RS-fMRI data analysis more challenging than task-based fMRI. This also hinders the correct separation of noise from the neural-related signal from the RSNs. In fact, several sources of noise are present in the data, many of which share some spatial or spectral overlap with RSNs. Spatially extended artefacts can be caused by the scanner (e.g., hardware instabilities), or, more frequently, they are caused by non-neuronal physiological mechanisms (head motion, cardiac and respiratory cycles) (Murphy et al., 2013). Their correct identification and removal (hereafter also called denoising, cleaning or clean-up) is therefore crucial for reliable FC analyses. Other important methodological issues addressed, at least partially, in this thesis were: the need to increase spatial and temporal resolution of fMRI data; the optimization of single-subject FC analyses in order to provide sensitive and accurate detection of FC alterations, to be used as non-invasive biomarkers; the need of a high-dimensionality parcellation of the brain in order to allow more detailed network analyses.
Certainly, the ultimate goal of the optimization of FC analysis methods is their clinical application, and the FC analysis of the RSNs is currently used to study a wide range of neurological and psychiatric disorders (Cole et al., 2010). In this thesis we focused on Alzheimer’s disease, the most common cause of neurodegenerative dementia. In this pathology the study of one RSN in particular, the DMN, is especially important because the DMN structures are involved in the memory processes and are vulnerable to atrophy, deposition of the amyloid protein, and generally
show a reduced glucose metabolism (Buckner et al., 2005). Moreover, with RS-fMRI it has been consistently demonstrated a decreased functional connectivity of the DMN, and this is becoming a possible new biomarker for AD (Li et al., 2011; Greicius et al., 2004; Gili et al., 2011). Therefore an early detection and a detailed characterization of this alteration are crucial.
Aims of the study
The aim of this study was to optimize and validate objective methods for the investigation of the RSNs based on resting state fMRI, in healthy subjects and patients with Alzheimer’s disease. In particular, once quantified the amount of FC estimation errors in seed-based FC analysis (one of the most common FC analysis techniques), the problem of artefact removal from the raw data was focused, in order to optimize any subsequent FC analysis. An automated denoising method (FMRIB's ICA-based X-noisefier - FIX), was developed in collaboration with the FMRIB (Functional Magnetic Resonance Imaging of the Brain) Centre (University of Oxford, UK), and was tested on different datasets (healthy controls and AD patients), acquisition sequences (standard EPI and multi-band accelerated EPI), and group ICA model orders (low- and high-dimensional group ICA) for spatial, temporal, and network analyses. Finally, through the combination of an effective cleaning procedure and high-dimensional RSNs analysis a better localisation and quantification of FC alterations in AD was aimed at.
Methods
Individual thresholding of seed-based FC maps.
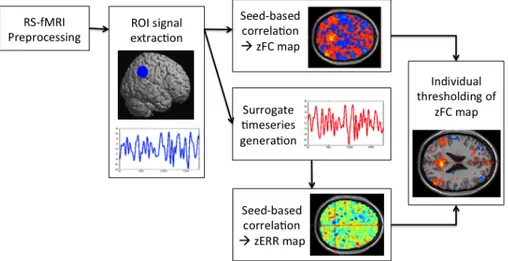
A method for the evaluation of errors in single-subjects FC maps and their thresholding was proposed. It involved the steps summarised in Figure 1 and described below:
- preprocessing of RS-fMRI data (slice timing, motion correction, coregistration to MNI space, spatial smoothing, regression of nuisance variables, temporal band-pass filtering. See par. 2.2.2)
- extraction of the mean time course within a region of interest (ROI)
- linear correlation (followed by Fisher's r-to-z transformation) between the ROI-time course and the time courses of all acquired voxels in order to obtain the seed-based functional connectivity map (zFCmap)
- generation of surrogate phase-randomized time series of the ROI-time course with the iteratively refined amplitude adjusted Fourier transform (iAAFT) method (Schreiber and Schmitz, 2000)
- computation of seed-based functional connectivity maps using each surrogate time series as seed, in order to obtain error maps (zERRmaps, i.e. consisting only in random correlations) - calculation of the mean and the standard deviation among the error maps, obtaining an error
mean map (meanERRmap) and an error standard deviation map (stdERRmap) for each subject (the distributions of these two maps were fitted to theoretical sample distributions, respectively normal and chi-square distribution, in order to describe the characteristics of the random correlations (errors) within the brain FC maps)
- thresholding of the FC maps:
o global thresholding method: computation of a 2*std (i.e., p<0.05) confidence
interval (CI) as (where and are the mean values of meanERRmap and stdERRmap distributions respectively), and application of ICglobal
to each voxel of the FC map (voxels showing a correlation value out of the CI are considered as significantly connected with the seed)
o local thresholding method: computation of a 2*std (i.e., p<0.05) confidence interval
for each brain voxel (i) as , and application
of IClocal to the i-th voxel of the FC map (voxels showing a correlation value out of
the CI are considered as significantly connected with the seed)
This procedure was applied in 15 healthy controls to identify the default mode network (DMN) using a seed in the posterior cingulate cortex (PCC). We described the distribution of the random correlation within the brain, compared the two thresholding methods, and evaluated the intra-subject and inter-intra-subject variability of the threshold.
std m CIglobal = ±2* m std )) ( ( * 2 )) ( ( )
(i mean zERRi std zERRi
ICA-based noise identification and removal
A tool for the automatic identification and removal of noise was developed in collaboration with the Functional Magnetic Resonance Imaging of the Brain (FMRIB) Centre (University of Oxford, UK). “FIX” (FMRIB's ICA-based X-noisefier) is an automated approach, once trained, for cleaning fMRI data of various types of noise. This tool is conceived to clean single-subject data before any further processing step (seed-based correlation, group-ICA, network analysis, or other approaches) exploiting a preliminary classification of single-subject independent components into signal or noise and regressing out the noise ones together with motion regressors. The major operations for FIX clean-up can be summarised as follows:
- preprocessing of RS-fMRI data (motion correction, EPI distortions correction, brain extraction, spatial smoothing, high-pass temporal filtering. See par. 3.3.2)
- single-subject ICA decomposition
- training dataset generation (training datasets):
o manual labelling of the individual components in signal and noise o classifier training (using expert-/hand-labelled data)
- automatic classification of single-subject ICs in the test datasets (i.e., predicting components likelihood of being signal or noise)
- noise removal (removal of the artefactual components) (test datasets) – two options:
o aggressive clean-up: regression of the full space of all artefacts (noise components and motion confounds) out of the 4D pre-processed data; however, signal power shared by signal and noise components is also cancelled out.
o soft clean-up: regression of the full space of the motion parameters out of the data; estimation of the contribution of noise and signal components, thus preserving the shared signal power; subtraction of the contribution of the noise components only. FIX cleaning was applied on three datasets (see details in Table 1) in order to: 1) test the classification accuracy, 2) test the efficacy of the noise removal procedure, and 3) evaluate the impact of the cleaning procedure in a clinical dataset (i.e. patients with Alzheimer’s disease).
Table 1. Subjects recruited for FIX training dataset generation and corresponding test dataset used for the different studies evaluating FIX performance.
Training dataset Test dataset
Dataset 1 23 subjects (HC) – Standard EPI, 3T scanner
53 subject (HC) – Standard EPI, 3T scanner
Dataset 2 23 subjects (HC) – Multiband accelerated (MB6) EPI, 3T scanner
53 subject (HC) – Multiband accelerated (MB6) EPI, 3T scanner
Dataset 3 46 subjects (HC) – standard EPI, 1.5T scanner
41 subjects (20 HC, 21 AD patients) – standard EPI, 1.5T scanner
Legend: HC = healthy controls; AD = Alzheimer's disease patients; EPI = echo planar imaging; MB6 = multiband accelerated, factor 6
Below a summary of the methods applied in the three studies evaluating FIX performance is presented.
1) ICA-based noise identification: accuracy evaluation
On the training sub-sets respectively relevant to each of the three datasets the evaluation of the classification accuracy was tested with a leave-one-out test in terms of “true positive rate” (TPR, meaning the percentage of true signal components correctly detected with respect to manual labelling) and “true negative rate” (TNR, meaning the percentage of true artefact components correctly detected with respect to manual labelling).
2) ICA-based noise removal: efficacy evaluation on healthy controls
On the first two test datasets we tested the efficacy of the denoising procedure with different options. In particular, we compared the two first-level (within-subject) cleaning approaches (soft vs aggressive) for removing artefacts and motion-related parameters from the data and one second-level cleaning (Nets clean-up, applicable only for time series and network analyses).
With similar analyses we also investigated the combined effects of different cleanings and different acquisition sequences (test dataset 1 vs test dataset 2), in order to evaluate the benefits of the multiband slice accelerated sequence (Moeller et al. 2010; Feinberg et al., 2010) developed partly for the Human Connectome Project (HCP).
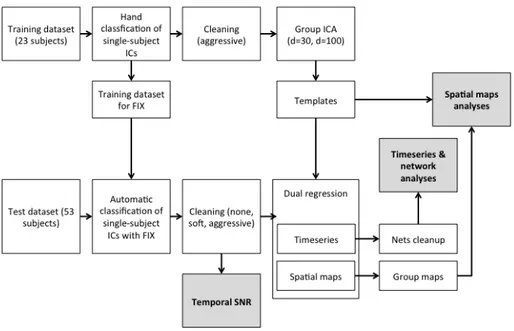
Fig. 2. Overall scheme of the methods used for the efficacy evaluation of FIX denoising on healthy controls
- Templates creation (from training datasets 1 and 2):
o aggressive removal of the manually-labelled artefactual components o coregistration to MNI space
o temporal concatenation and group ICA at low (d=30) and high (d=100) dimensionality
- preprocessing of test datasets 1 and 2 (motion correction, EPI distortions correction, brain extraction, high-pass temporal filtering. See par. 3.3.2) and ICA-based cleaning with two options (soft or aggressive), obtaining three sets of data: uncleaned data, softly cleaned data and aggressively cleaned data
- coregistration to MNI space
- dual regression using the templates as spatial regressors and generation of single-subject time series and spatial maps for each component
- efficacy evaluation of the different cleaning options and comparison of the two acquisition sequences and the two ICA model orders on:
o temporal signal-to-noise ratio (SNR, average value within the brain of the image obtained as the ratio between the mean image across time standard deviation image across time).
o time series amplitude (i.e. the time series standard deviation) o time series power spectra
o network matrices (obtained with full correlation, partial correlation and regularised partial correlation): consistency across subjects
o group spatial maps: similarity with the template
3) Impact of ICA-based noise removal in a clinical dataset (Alzheimer’s disease)
The denoising procedure with FIX was also applied to a group of elderly healthy controls and a group of patients with Alzheimer’s disease (test dataset 3, using training dataset 3 as sequence-specific training dataset for FIX) and compared with other two common data-driven approaches for the cleaning of RS-fMRI data, in order to evaluate the impact of denoising on the identification of FC alterations in AD. The analyses involved the following steps:
- preprocessing of RS-fMRI data (motion correction, brain extraction, spatial smoothing, high-pass temporal filtering. See par. 5.2.3)
- cleaning with four cleaning options:
o MOTreg: regression of motion parameters
o MWCreg: regression of motion parameters, white matter spatial mean signal and CSF mean signal
o FIXsoft: ICA-based denoising with FIX using the soft option o FIXagg: ICA-based denoising with FIX using the aggressive option
- on the data obtained after the different cleaning options (uncleaned, MOTreg, MWCreg, FIXsoft, FIXagg), calculation of:
o temporal signal-to-noise ratio (SNR)
o %ΔSTD: the reduction of BOLD signal fluctuations with respect to the uncleaned data.
o seed-based correlation analysis with seed in the posterior cingulate cortex (PCC) o template-based dual regression (Khalili-Mahani et al., 2012; 2013)
- evaluation of the performance of the denoising procedures in terms of increase of within-group consistency and ability to detect the typical FC alteration in the DMN on AD patients (between-group differences).
Clinical application of ICA-based denoising and high-dimensional group ICA in Alzheimer’s disease
The innovative combination of ICA-based cleaning and group ICA at high dimensionality introduced and validated on healthy subjects was applied in a preliminary clinical study on AD patients (test dataset 3, 20 HC and 21 AD), aiming at investigating in more detail the functional connectivity of two selected RSNs and their sub-networks. To achieve this, the following steps were performed:
- preprocessing of RS-fMRI data (motion correction, brain extraction, spatial smoothing, high-pass temporal filtering. See par. 6.2.1)
- ICA-based (FIX) aggressive cleaning and coregistration to MNI space.
- temporal concatenation of 4D RS-fMRI preprocessed data and group ICA decomposition at low dimensionality (d=25) and high dimensionality (d=70, as suggested by Abou Elseoud et al., (2010, 2011) and judged to be compatible with the number of temporal degrees of freedom in the data, in order to allow the combination of cleaning and high-dimensional ICA)
- dual regression to obtain single-subject time series and spatial maps for each component - manual labelling of the low-dimensional components and selection of the RSNs of interest
for the study (DMN and sensory-motor network, SMN)
- definition of a classification algorithm to label the high-dimensional components as belonging to the RSNs identified from low-dimensional ICA or as being residual noise; accuracy evaluation of the classification with respect to manual labelling; selection of the sub-networks of interest for the study
- evaluation of between-group differences (HC vs AD) with the two ICA dimensionalities on: o time series amplitude
o network matrices (full correlation) o spatial maps
Results
Individual thresholding of seed-based FC maps.
The distribution of random errors within the brain was observed to be homogeneous and, after thresholding with either method, the default mode network areas were well identifiable (see Figure 3). The two methods yielded similar results (Dice index across subjects = 0.81±0.04), however the application of a global threshold to all brain voxels requires a reduced computational load. The inter-subject variability of the global threshold was observed to be very low and not correlated with age. Global threshold values reached a stable plateau with increasing surrogate and this low value can be suggested, with appreciable computational savings.
Fig. 3. Results of random error estimation (left, distributions of mean and standard deviation within the brain) and thresholding of a FC map (right, FC map before – a- and after global – b - and local – c - thresholding).
ICA-based noise identification: accuracy evaluation
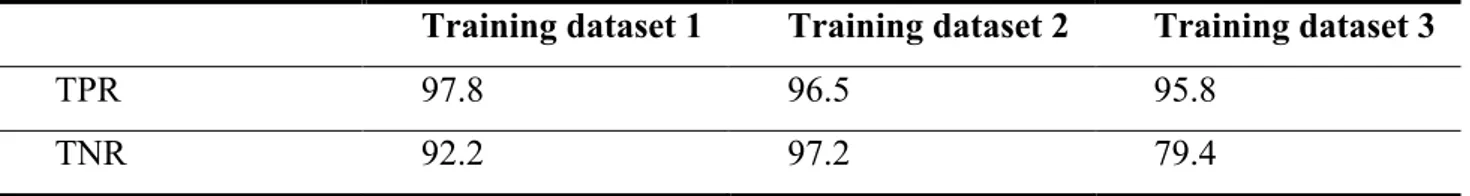
From the training dataset built through manual labelling of the components, it emerged that the amount of noisy components is more than 70% of the estimated components for 1.5T images (which corresponds to the 30% of the total variance of the original data) and more than 85% (over 65% of the total variance) for 3T images. The best leave-one-out (LOO) results for the three training datasets are summarised in Table 2.
Table 2. FIX classification accuracy obtained with LOO test for the three datasets at the best threshold.
Training dataset 1 Training dataset 2 Training dataset 3
TPR 97.8 96.5 95.8
TNR 92.2 97.2 79.4
Legend: TPR = True Positive Rate; TNR = True Negative Rate.
ICA-based noise removal: efficacy evaluation on healthy controls
Comparing the different cleaning approaches, the preferable balance between noise removal and signal loss was achieved by regressing out of the data the full space of motion-related parameters and only the unique variance of the artefact ICA components (FIX soft approach), without additional Nets clean-up (see, for example, the results obtained on the power spectra in Figure 4).
Fig. 4. Temporal power spectra (panel A) for different cleaning approaches, obtained from scaled time series (i.e., each normalised by the amplitude of the corresponding uncleaned time series), averaging the spectra across subjects and then calculating median spectra across components. Uncleaned data have the highest power both at low and high frequency; however, after normalising for power at the highest frequencies (where the content of thermal noise is higher than the content in signal) (panel B), it is clear that with soft clean-up we obtained the highest contrast-to-noise ratio. Results are
shown for MB6 data, at d=100 (y axis in logarithmic scale), but were similar for the other protocols.
With the multiband accelerated sequence (MB6), after the optimal cleaning procedure, we achieved functional connectivity results that were statistically comparable or significantly better than the standard (un-accelerated) acquisition, and importantly, with higher spatial and temporal resolution (See Figure 5). Moreover, only with the accelerated data were able to successfully combine single-subject cleaning and high-dimensional ICA decompositions (d=100), which is highly valuable for detailed network analyses.
Fig. 5. Group-level z-statistic maps of two RSNs (sensory-motor network and visual network), derived from Standard (d=30) and MB6 (d=30 and d=100) datasets using the corresponding training data templates, without and with soft or aggressive FIX clean-up. Individual subjects’ z-statistic maps were mixture model corrected and combined using
fixed-effects averaging. Group maps are thresholded at abs(z)>3 (red-yellow colour coding for positive z values, blue-light
0 0.05 0.1 0.15 0.2 0.25 0.3 0.35 0.4 100
101
102 4.B) Scaled Power Spectra − MB6 d=100
Frequency (Hz)
Timeseries’ power spectral density (log)
No cleaning Soft Aggressive Only Nets Soft+Nets Aggressive+Nets Only −global Soft−global Aggressive−global 0 0.05 0.1 0.15 0.2 0.25 0.3 0.35 0.4 10−2 10−1 100
101 4.A) Power Spectra − MB6 d=100
Frequency (Hz)
Timeseries’ power spectral density (log)
No cleaning Soft Aggressive Only Nets Soft+Nets Aggressive+Nets Only −global Soft−global Aggressive−global B) A)
blue for negative ones). The effect of the cleaning is noticeably strong in terms of noise removal and more focal signal mapping (as highlighted with the ring around the right sensory-motor network). With high dimensionality the RSNs are
split into multiple components, allowing a more detailed analysis of network connectivity.
Impact of ICA-based noise removal in a clinical dataset (Alzheimer’s disease)
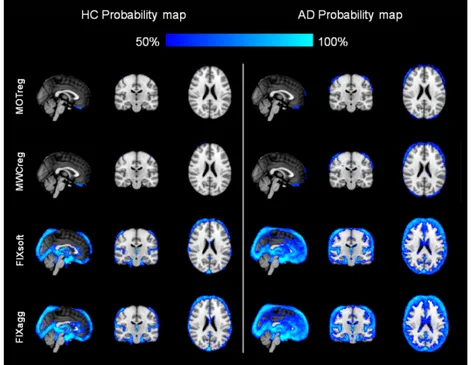
Figure 6 shows the probability maps of BOLD fluctuation reduction across subjects in the two groups: the reduction is localized at brain boundaries after MOTreg, a small further decrease involves the ventricles and the WM after MWCreg, a large reduction within ventricles and in areas corresponding to blood vessels can be observed after FIX clean-up.
Fig. 6. Spatial pattern of change in BOLD signal standard deviation: probability map of areas where %ΔSTD>25% across all HC (left) or AD patients (right). Images are shown in radiological convention.
Regarding FC analyses, in both groups the consistency increased after cleaning (lower standard deviation across subjects). The consistency was, in general, higher within the HC group than in the AD group and the highest consistency was achieved with MWCreg and FIXagg. However, only after FIXagg a significant FC decrease within the DMN was observed in the AD group both with seed-based correlation and with template-based dual regression (see Figure 7).
Fig. 7. Between-group differences in functional connectivity results using a seed in the PCC (top) or DMN template-based dual regression (bottom) on data cleaned with FIX aggressive clean-up. Images are shown in radiological
convention.
Clinical application of ICA-based denoising and high-dimensional group ICA in Alzheimer’s disease
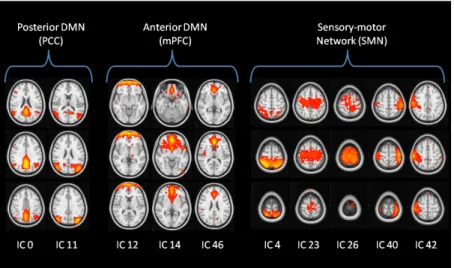
Three low-dimensional components of interest were selected: the posterior and anterior part of the DMN (respectively the posterior cingulate cortex, PCC, and the medial prefrontal cortex, mPFC), and the sensory-motor network (SMN). The classification algorithm showed an accuracy of 95.7% with respect to manual labelling and the sub-networks of interest are showed in Figure 8.
Fig. 8. High-dimensional components relative to the neworks of interest automatically selected by the labelling algorithm with the spatiotemporal-based criteria: the posterior default mode network (PCC) was identified in two components, the medial prefrontal cortex (mPFC) in three, and five components were labelled as belonging to the sensory-motor network (SMN). The number of each component was based on the ranking of variance explained by the
component.
As regards low dimensionality results, the time series amplitude was significantly lower in AD patients in all the three components, while only the correlation between the PCC and mPFC components was altered in AD. The spatial analysis highlighted significantly lower activations in AD compared to HC only in the PCC component.
At high dimensionality, the time series amplitude was significantly decreased (p<0.05) in AD patients in both PCC sub-networks (PCC0, PCC11), but only in one component within the mPFC
(the ventral mPFC, mPFC14) and one in the SMN. The network analyses on the high-dimensional
components of interest showed both within-network (mPFC and SMN) and between-network (mPFC-PCC) connectivity alterations in AD (AD<HC, p<0.05). Significantly lower activation in the spatial maps was found in AD patients in three high-dimensionality components (PCC0,
mPFC14, SMN23). In the PCC sub-network (PCC0), the decreased activation was localised in the
PCC and the precuneus; the alteration in the mPFC (mPFC14) involved the ventral mPFC, while a
decreased activation in the SMN was localized in the left precentral gyrus.
Discussion
In this work, optimized methods for the correct identification of the RSNs and the detection and removal of the artefacts from RS-fMRI data were proposed.
From the preliminary estimation of errors in the single-subject seed-based functional connectivity maps we observed a homogeneous distribution of random error within the brain, which suggests that this kind of error, although always present, is independent from the resting state activity itself. The proposed thresholding methods are promising for a better identification of the RSNs at single-subject level and, in future studies, they could be applied in a clinical setting to quantify the FC alterations with respect to a seed ROI through the definition of specific FC measures. Indeed, the availability of a reliable single-subject FC analysis could be particularly useful for rare case studies (when a group study is not feasible) and for the longitudinal evaluation of a single patient's disease progression or response to treatment or rehabilitation.
Subsequently, the developed tool (FMRIB's ICA-based Xnoisefier - FIX) for the automatic identification and removal of noise allowed to further improve the reliability of FC estimation since, through the cleaning of the single-subject raw data, it can be applied to any FC analysis. Regarding the classification of signal and noise, FIX achieved over 95% classification accuracy on the three datasets built by hand-labelling of the components, thus demonstrating to be a highly valuable tool for the identification of the artefacts in RS-fMRI data. Our results on the denoising efficacy showed that FIX cleaning is useful to obtain reliable temporal and spatial RS-fMRI analyses: if an artefact is not cleaned at the single subject level and its spatial pattern is overlapping one of the RSNs, it will generally influence both the single-subject RSN time series, (i.e. the output of the first stage of dual regression) and the RSN spatial maps (obtained from the second step of dual regression). In fact, the non-cleaned time series will have higher amplitude with respect to the cleaned data, often with high frequency confounds visible in the power spectra, and the presence of shared noise will in general
produce less consistent network matrices across subjects. The noise would also lead to noisy subject-level z-maps, and affects any following group-level analyses, ultimately reducing the ability to detect specific activation patterns within the RSNs. This problem also affects seed-based resting-state correlation maps for similar reasons, as demonstrated in the application on AD patients. In this population we observed the presence of a greater amount of artefacts, possibly due predominantly to atrophy, and the cleaning procedure with FIX revealed to be particularly useful to detect the typical alteration of the PCC in the DMN with two different FC analysis methods.
The comparison of two different acquisition sequences suggests that the use of multiband (MB) accelerated EPI is advantageous for RS-fMRI analysis for several reasons: i) the increased temporal and spatial resolution yielded a better FIX classification accuracy (98% for MB6 versus 95% for Standard, with leave-one-out testing); ii) a considerably higher proportion of non-artefactual group-ICA components was identified in the MB6 dataset, thus suggesting more successful group-ICA-based clean-up of MB data; iii) the MB accelerated data allowed a more detailed time series and network analyses through higher dimensionality decomposition (d=100), which was not achievable with the Standard sequence because of its lower temporal degrees of freedom; iv) MB time series spectra after cleaning showed considerably less structured artefact (i.e., deviation from the expected clean 1/f-like spectrum) though preserving mean total time series power; v) network patterns were more reproducible across subjects with MB6; vi) the results of spatial map analyses were not altered in MB data, notwithstanding the lower static image SNR of MB due to its higher resolution.
FIX is now publicly available; the current version (v1.06) is available as a “plugin” for FSL (the FMRIB Software Library) at link www.fmrib.ox.ac.uk/fslwiki/fsl/FIX. The FIX download includes training-weights files for “standard” fMRI acquisitions and for Human Connectome Project (HCP http://www.humanconnectomeproject.org/) RS-fMRI data. In fact, partly due to the study performed in this thesis, FIX is now in use as part of the default HCP analysis pipeline (Smith et al., 2013), and FIX-cleaned data is the recommended version of the resting-state fMRI data that is publicly available – already over 200 subjects’ worth of hour-long datasets having been released to date.
Finally, the combined use of ICA-based denoising and high-dimensional group ICA was applied in Alzheimer’s disease, in order to investigate in more detail the functional connectivity of two selected RSNs (the DMN and the SMN) and their sub-networks. The creation of an automatic labelling algorithm allowed to automatically identify the sub-networks of interest with an objective and quantitative criterion and to perform a high-dimensional analysis that added complementary information to the low-dimensional one. A future improvement of the algorithm could be the use of a standard template to avoid the need of manually label the low-dimensional components or the
development of an extension of the classifier used by FIX for the automated labelling of group-level components at low and high dimensionality. The study of the temporal information and the more detailed parcellation of the RSNs of interest allowed to detect FC changes in AD that were not detectable with the more common approach of low-dimensional spatial map analyses, thus suggesting that the optimized FC analysis could give further insight into the detection of functional connectivity alterations in pathological conditions for evidence based diagnosis, follow-up and prognosis (Abou Elseoud et al., 2011; Tian et al., 2013). Of course these results needs further research to be confirmed and the analysis on other resting state networks and at different model orders would be the natural progress of this study. Moreover, future studies including patients with Mild Cognitive Impairment (MCI) and severe AD patients, or longitudinal studies on AD patients would better clarify whether the early changes we observed with the temporal analyses truly anticipated changes detectable even in the low-dimensional spatial maps at more advanced disease stages.
Conclusion
The aim of this study was to optimize and validate objective methods for the investigation of the RSNs and the removal of artefacts in resting state fMRI data, applicable to the context of neurodegenerative diseases, especially Alzheimer’s disease. With a preliminary study quantified the amount of FC estimation errors in one of the most common FC analysis techniques (seed-based FC) was quantified and a thresholding method was proposed for a reliable single-subject FC analysis. Through the development of FMRIB's ICA-based X-noisefier (FIX), we then demonstrated that, by combining an accurate ICA component classifier with an effective approach for noise removal, we were able to remove artefacts directly from the raw data, automatically, and that we were not removing significant amounts of non-artefactual signal. Moreover, with multiband accelerated sequences and effective cleaning, we were able to perform higher dimensionality decompositions and more detailed RSN analyses than with a standard EPI acquisition. The proposed denoising approach was also demonstrated to be particularly beneficial in clinical applications, as it allowed to correctly detect FC alterations in mild to moderate Alzheimer’s disease (AD) patients. Finally, we showed that high-dimensional ICA, supported by a component classification based on low-dimensional ICA, could be successfully applied in clinical studies (e.g. in AD) to gain additional knowledge regarding brain functional connectivity changes in diseased populations. A detailed parcellation of the brain and the analysis of the temporal information (e.g. amplitude and networks analyses) could give further and earlier insight into the detection of functional connectivity alterations in pathological conditions and their monitoring at different stages. The promising results
obtained in describing the functional disconnections due to this neurodegenerative disease support further efforts in this investigation direction, towards the definition of reliable non-invasive biomarkers for AD.
Chapter 1- Background and aim
In this chapter, the scientific and clinical background of neuroimaging methods for the study of brain functional connectivity will be introduced, and both general and specific aims of optimizing these methodologies and applying them in the study of Alzheimer’s disease will be described.
1.1. Functional MRI, Resting State functional MRI and functional
connectivity
Contemporary functional neuroimaging techniques provide excellent opportunities for investigating the human brain in vivo. It was the advent of the functional imaging modalities of positron emission tomography (PET), single photon emission computed tomography (SPECT), functional magnetic resonance imaging (fMRI), high resolution EEG, and magnetoencephalography (MEG) that led to a new era in the study of brain function.
Throughout the last two decades, fMRI has developed into the most prominent method used for functional brain imaging (Bandettini et al., 2012; Howseman and Bowtell, 1999) and it is increasingly used to probe the functional integrity of brain networks. fMRI is a non-invasive technique for examining brain function through the use of blood oxygen level-dependent (BOLD) contrast. This contrast relies on two basic principles: i) hemoglobin has different properties according to its level of oxygenation (oxyhemoglobin is diamagnetic, while deoxyhemoglobin is paramagnetic) (Ogawa et al., 1990; Kim and Ogawa 2012); ii) regional blood oxygenation varies according to the levels of neural activity. These properties can be used to indirectly assess brain activity (Amaro and Barker, 2006) (Figure 1.1): the activation of a cortical area causes an increase of oxygenated blood inflow, higher than the strict metabolic consumption. This is indirectly sensed, since the arterial blood accelerates the hemodynamic mean transit time in the district, thus pushing away a portion of de-oxygenated blood in the venous capillaries. As deoxyhemoglobin is paramagnetic, it increases the local microscopic magnetic field inhomogeneity Δ B thus shortening the T2* relaxation time thus accelerating signal fading. In this way, changes in BOLD signal can be
used to identify areas of increased or decreased neuronal activity (Logothetis, 2004; Raichle and Mintun, 2006) while subjects perform motor, sensory, cognitive or emotion-provoking tasks (Drobyshevsky et al., 2006).
Figure 1.1. Brain activity and BOLD signal principles.
FMRI studies can be divided in two approaches: task-induced and task-independent protocols. The initial fMRI studies in humans focused on task-induced responses in the BOLD signal (Bandettini et al., 2012; Kwong et al., 1992). In standard task-induced fMRI, an experimental task of interest is presented alternately with a control condition (control task or rest) and the BOLD signal during the experimental task is compared to the BOLD signal during the control condition. As the difference between baseline and task-related activation accounts for about 1–5% of the total BOLD signal (Bandettini et al., 1992), statistics over repeated activations (either with a block design or event-related design) is necessary in order to provide response images as statistical parametric maps. In doing this, a parametric model linking the BOLD signal of each voxel to the experimental task is required (Stephan et al., 2006). The mainly adopted model is the general linear model (GLM) (Friston et al., 1995). Regressors are the model inputs (design of the experimental task), which include the expected hemodynamic response (or a set of possible responses, with more sophisticated approaches), and possible confounding factors (registered movements, slow drifts, average signal). A modified version, named event-related, considers events either randomly presented or a-posteriori registered, again compared to baseline.
One of the new trends in functional neuroimaging is studying human brain ongoing activity expressed by structured BOLD fluctuations when subjects are not performing any particular task. This practice is task-independent and is also known as Resting State fMRI (RS-fMRI). In RS-fMRI studies, subjects are asked to rest quietly for several minutes while brain images are acquired. Since no external time reference is available as in task induced protocols, detection of significant activity relies only on the mutual dependence of the ongoing activity in different areas. Yet, a strong link with task related activity is recognized and has had a primary role in the discovery and classification of RS networks (see below). In fact, the brain regions similarly modulated (i.e., either activated or inhibited) by stimuli or tasks, rather than being idle during rest, display instead vigorous and persistent functional activity (Buckner et al., 2008) detected as spontaneous low-frequency (<0.1
Hz) BOLD signal fluctuations. Interregional correlations of these fluctuations can be estimated, and these quantitative estimates provide measures of functional connectivity.
Functional connectivity (FC) is traditionally defined as the temporal dependency between spatially remote neurophysiological events (Friston 2011). In the context of functional neuroimaging, FC is suggested to describe the relationship between the neuronal activation patterns of anatomically separated brain regions, reflecting the level of functional communication between regions (Van Den Heuvel, 2010). The coherent activity of functionally related brain areas can be captured in BOLD signal during RS-fMRI acquisitions. The first RS-fMRI study was conducted by Biswal and colleagues (Biswal et al., 1995), who, correlating the time course of a seed region of interest (ROI) in the motor area with the time course of all other brain voxels, saw that during rest the left and right hemispheric regions of the primary motor network are not silent, but show a high correlation between their fMRI BOLD time series, suggesting ongoing information processing and ongoing functional connectivity between these regions during rest.
Several studies replicated these pioneering results, showing a high level of FC other regions. In fact, when fMRI studies started to examine the possibility of measuring FC between brain regions as the level of co-activation of spontaneous fMRI time series recorded during rest (Biswal et al., 1997; Cordes et al., 2000; Greicius et al., 2003), it was observed that, at rest, the brain is organized into networks, called Resting State Networks (RSNs), consistent across subjects and highly similar to networks of task-induced activations and deactivations (Beckmann et al., 2005; Damoiseaux et al., 2006; De Luca et al., 2006; Veer et al., 2010; Smith et al., 2009). They are believed to belong to distinct networks serving different functions such as vision, language, etc. Today the most studied RSNs are: the default mode network (DMN), the sensory motor network (SMN), the right and the left lateral networks, the salience network, the ventral stream network, the task positive network, the primary, the medial and the lateral visual networks and the auditory network (Figure 1.2).
Figure 1.2. The principal and more investigated resting-state networks (Veer et al., 2010)
In particular, the first discovered and most studied RSN is the DMN, which was identified from PET data by Raichle et al. (2001). It includes the posterior and anterior cingulate cortex (PCC and ACC), the inferior parietal lobule (IPL), the medial prefrontal cortex (mPFC) and the hippocampus, regions that are known to show a high level of neuronal activity during rest and a deactivation in physiological conditions during the execution of cognitive tasks, suggesting that activity of this network is reflecting a default state of neuronal activity of the human brain (Gusnard et al., 2001; Raichle et al., 2001; Raichle and Snyder, 2007).
The FC analysis of the RSNs is currently used to study a wide range of neurological and psychiatric disorders, i.e. Alzheimer’s disease (Damoiseaux et al., 2012; Sorg et al., 2009), dementia with Lewy bodies (Galvin et al., 2011), frontotemporal dementia (Farb et al., 2013), epilepsy (Cataldi et al., 2013), Parkinson’s disease (Göttlich et al., 2013), stroke (Varsou et al., 2013), depression (Sambataro et al., 2013), and schizophrenia (Karbasforoushan and Woodward, 2012) among others. It is therefore of crucial importance the development of sensitive and accurate methods for the detection of FC alterations, to be used as non-invasive biomarkers.
1.2. Functional connectivity analysis methods
The lack of an a priori hypothesis about the brain activation (no specific task during acquisition) makes the RS-fMRI data analysis more challenging than the task-based fMRI. Various methods exist for analysing RS-fMRI FC, among which, the most widely used are: seed-based, model-free methods and network analysis methods.
Seed-based functional connectivity analysis
The first method used for RS-fMRI FC analyses is called seed-based or voxel-based (seed-based hereafter) technique. Firstly described by Biswal and colleagues (1995), it was subsequently applied in several studies (e.g. Raichle et al., 2001; Fox et al., 2005; Cordes et al., 2000; Taylor et al., 2009; Di Martino et al., 2008; Andrews-Hanna et al., 2007). In seed-based approaches one or more regions of interest (ROIs) are a priori selected to evaluate the similarity (e.g., temporal correlation) of their average time course with each other area or single voxel in the brain. The result is a map of brain voxels significantly correlated with the chosen seed ROI or a quantitative assessment of the strength of correlation within the target ROI (Golestani and Goodyear, 2011) (Figure 1.3).
Figure 1.3. Seed-based FC. To examine the level of functional connectivity between the selected seed voxel and a second brain region j, the RS time series of the seed voxel is correlated with the RS time series of region j. A significant
correlation between the time series of ROI and voxel j is reflecting a significant level of FC between these regions. Furthermore, to map out all functional connections of the selected seed region, the time series of the seed voxel can be correlated with the time series of all other voxels in the brain, resulting in a functional connectivity map that reflects the
regions that show a high level of functional connectivity with the selected seed region (Van Den Heuvel and Hulshoff Pol, 2010).
Seed-based correlation has proven to be a powerful, easily interpretable, and effective tool in identifying and characterising the brain areas that show activity during the resting state. However, the networks obtained from seed-based method depend on the way the seed regions are defined (Cole et al., 2010). Typically, seeds are chosen based on the location of activity during a task (Biswal et al., 1995; Xiong et al., 1999), using anatomical images as a guide (Di Martino et al., 2008; Taylor et al., 2009), or based on standardized coordinates (Maldjian et al., 2003). However, the anatomical volume of known regions may vary between subjects, in the presence of
neurological disease, or with aging, and functional boundaries of brain regions may not be well defined. Hence, using this approach undesired voxels may be included, or functionally relevant voxels may be excluded. Moreover, the seed-based method only evaluates the relationship between the brain and the seed and considers one seed at a time, while, in absence of an a priori hypothesis, it might be more informative to simultaneously detect and characterise various different resting state networks from a single RS-fMRI acquisition.
Independent Component Analysis (ICA)
Data-driven methods, like principal component analysis (PCA) (Friston et al., 1993) and independent component analysis (ICA) (Beckmann et al., 2005; De Luca et al., 2006; Binnewijzend et al., 2012; Smith et al., 2009) were introduced as FC analysis methods to look for general connectivity patterns across brain regions. They aim to discover the underlying structure of the data rather than impose an a-priori knowledge on the model, with a blind separation of meaningful sources. In this case, instead of pointing a specific RSN by setting a seed, data analysis proceeds on indirect measurements, which are a mixture of true underlying source signals orthogonal (PCA) or maximally independent (ICA) one to each other (Fox and Grecius, 2010). Usually neither the original signals nor the mixing transformation is known and undoing this mixing process is a challenging problem known in the field of signal processing as the blind source separation (BSS) problem (Zarzoso and Nandi, 1999).
In this framework, ICA has therefore developed over the course of decades as an extension of PCA for investigating solutions to the BSS problem. ICA was introduced (McKeown et al., 1998) as an fMRI analysis method able to use decomposition into spatially independent components (Figure 1.4) in order to distinguish between non-task-related signal components, movements and other artefacts, as well as task-related activations. From clinical experience it was noted that psychomotor functions are performed in localized brain areas that can be inferred from specific deficits in patients. This led to the assumption that brain areas that respond to a psychomotor task are independently distributed from brain areas affected by other sources of variability. This does not require these areas to be completely non-overlapping, but only that other sources of signal change are not distributed in the same way as the task-related areas, i.e. that knowledge about the spatial distribution of one does not provide any information on the spatial distribution of the other (Beckmann, 2012).
Figure 1.4. Schematic illustration of data representation and spatial decomposition with spatial ICA on fMRI data. The volumes obtained with functional image acquisition are rearranged into a 2D matrix by arranging all voxel for each 3D functional image into a single row. Then, ICA decomposes this dataset into two new matrices, the first one containing a component time course in each column and the second one containing a component spatial map in each row. The i-th
time course and the i-th spatial map belong to the i-th component and they jointly describe the temporal and spatial characteristics of underlying hidden signals (Beckmann, 2012).
Mathematically, the ICA model can be expressed as:
𝑿 = 𝑨𝑺 (1.1)
where the fMRI data are represented by the matrix X p x n (where n is the number of voxels belonging to the volume analysed at p different time points), the matrix S contains statistically independent spatial maps in its rows (which are the spatial areas in the brain, each with an internally consistent temporal dynamic) (Beckmann, 2012), and A is the mixing matrix which contains in its columns the time courses associated to the maps. The sources S are estimated by iteratively optimising the unmixing matrix W = A-1, so that S = WX contains mutually independent rows, using the information-maximization (Infomax) algorithm (Bell and Sejnowski, 1995).
An extension of the Independent Component Analysis is the probabilistic ICA (pICA) model, which assumes that the p-dimensional vectors of observations (time series) are generated from a set of q < p (i.e., there are fewer source processes than observations in time) statistically independent non-Gaussian sources (spatial maps) via a linear and instantaneous “mixing” process corrupted by additive Gaussian noise, η(t):
𝒙! = 𝑨𝒔!+ 𝝁 + 𝜼! (1.2)
xi denotes the individual measurements at voxel location i, si denotes the non-Gaussian source
signals contained in the data and ηi denoted Gaussian noise ηi ∼ N (0, σ2 Σi). The covariance of the
noise is allowed to be voxel dependent in order to allow for the vastly different noise covariances observed in different tissue types (Woolrich et al., 2005). The vector µ defines the mean of the observations xi and the matrix A p x q is assumed to be non-degenerate, i.e. of rank q. Solving the
blind separation problem requires finding a linear transformation matrix W such that 𝒔 = 𝑾𝒙 is a good approximation to the true source signals s (Beckmann, 2012).