Scuola di Ingegneria Industriale e dell’Informazione
Corso di Laurea Magistrale in
Ingegneria Biomedica
Cardiac rhythm classification and mortality
risk assessment from RR intervals using
non-linear dynamics indexes
Relatore: Prof. Sergio Cerutti
Correlatore: Prof.ssa Manuela Ferrario
Dott. Joseph Randall Moorman
Tesi di Laurea di:
Luca Carozzi - Matricola 787464
Marta Carrara - Matricola 784390
We wish to thank our advisors, Prof. Sergio Cerutti, Prof.ssa Manuela Ferrario and Dott. J. Randall Moorman from the University of Virginia, for their guidance and for the passion they put in their job. Their fascinating interest and curiosity always drove us in the work of these months, which became, day after day, a great challenge to face.
We also would like to thank Douglas E. Lake, who was always present and ready to help, support and direct us with his tenaciousness and love for research.
We say thank to Gary, Katie, Patrick and Nick from the UVa team for their cheerfulness and friendship, which was very helpful and valuable.
A lot of gratitude is reserved to our families and relatives, who always support, believe and love us.
Finally, we say a big “thank you” to all the friends we met in these years of university, who accompanied us with love.
Contents
List of Acronyms: ... 1
Summary ... 2
Sommario ... 8
1. Introduction ... 15
1.1. Background and motivation ... 15
1.2. Cardiac arrhythmias: pathophysiology and therapies ... 17
1.2.1. The electrical activity of the heart ... 17
1.2.2. Pathogenesis of arrhythmias ... 20
1.2.3. Atrial Fibrillation ... 20
1.2.4. Atrial Flutter ... 23
1.2.5. Premature Atrial Contractions ... 24
1.2.6. Premature Ventricular Contractions ... 24
1.3. Cardiac arrhythmias: mortality risk ... 25
1.4. Cardiac Arrhythmias: detection algorithms ... 27
1.4.1 ECG based classification algorithms ... 28
1.4.2 RR based classification algorithms ... 28
1.5 Objectives ... 31
2. Cardiac rhythm classification from RR intervals ... 32
2.1 Introduction ... 32
2.2 Study population ... 33
2.3 Heart rate metrics ... 34
2.3.1 Coefficient of Sample Entropy (COSEn) ... 34
2.3.2 Detrended Fluctuation Analysis (DFA) ... 36
2.3.3 Local Dynamics score (LDs) ... 38
2.4 Statistical analysis ... 39
2.5 Results ... 39
2.5.4 k-Nearest Neighbor analysis (k-NN analysis) ... 55
2.5.5 Validation on a different database ... 57
3. 2-years mortality risk analysis based on heart rate dynamics ... 60
3.1 Introduction ... 60
3.2 Study population ... 61
3.3 Methods ... 61
3.4 Results ... 63
4. Discussion and Conclusion ... 72
4.1 Cardiac rhythm classification from RR intervals ... 72
4.2 Mortality risk evaluation ... 73
4.2 Clinical implications ... 73
4.3 Limitations ... 74
4.4 Future developments and applications ... 74
1
List of Acronyms:
ACC: American college of cardiologist AF: atrial fibrillation
AFL: atrial flutter
AHA: American heart association ANS: autonomic nervous system AV node: atrioventricular node COSEn: coefficient of sample entropy DFA: detrended fluctuation analysis ECG: electrocardiogram
ESC: European society of cardiology HR: heart rate
HRV: heart rate variability ICU: intensive care unit k-NN: k-nearest neighbor LD: local dynamics LDs: local dynamics score NSR: normal sinus rhythm
PACs: premature atrial contractions PVCs: premature ventricular contractions PPV: positive predictive value
QSE: quadratic sample entropy SampEn: sample entropy SA node: sinus atrial node SD: standard deviation SR: sinus rhythm
2
Summary
Introduction
Cardiovascular diseases are the leading cause of death in most of the developed countries, being associated with more than 30% of all deaths (Go et al, 2013). Premature ventricular contractions (PVCs) lead to poor prognosis even in hearts with no structural diseases (Cha et al, 2012) (Lee et al, 2012). Premature atrial contractions (PACs) are known to precede atrial fibrillation (AF) (Haissaguerre et al, 1998) and to be a surrogate marker of paroxysmal AF in patients with acute ischemic stroke (Wallmann et al, 2007). AF is recognized to be one of the leading causes of stroke and a strong independent risk factor for increased cardiovascular morbidity and mortality (Benjamin et al, 1998) (Wolf et al, 1991) (Stewart et al, 2002), and it is very common among old subjects (Lake and Moorman, 2011). The world population is rapidly aging and this situation claims for an effective detection and monitoring of AF.
Important clinical decisions are related to the presence of AF, including stroke prevention with anticoagulants or left atrial appendage exclusion, cardioversion, ablation, and antiarrhythmic drugs. On contrast, no treatments are required even in situations with high burden of PVCs or PACs without concomitant pathological conditions, such as cardiomyopathy.
Current devices for arrhythmias detection, such as ECG Holter recordings, are obtrusive for the patient and are based on ECG signal, which can be distorted and noisy, making features extraction from the waveform not always feasible.
The RR interval time series is a reliable signal, it requires less computational cost and it’s less affected by high frequency noise.
However, non-invasive devices for determining heart rhythm are not commonly used because of reduced confidence in detecting AF based only on the heart rate or RR series. In fact, many methods to distinguish between AF and Normal Sinus Rhythm (NSR) has been proposed, given the largely different dynamics
3
between the two rhythms (Sarkar et al, 2008) (DeMazumder et al, 2013) (Lake and Moorman, 2011) (Tateno and Glass, 2001), but situations of sinus rhythm (SR) with frequent ectopy, atrial or ventricular, is expected to share features with AF, and thus to be distinguished with difficulty.
The principal objective of this thesis is to provide an algorithm for the detection and classification of AF even when a very high burden of atrial and ventricular ectopic beats is present, based only on RR intervals time series. We hypothesized that indices related to the dynamics of RR series can contribute to a better distinction of SR with ectopy from AF. We tested the hypothesis using three nonlinear indices. The Coefficient of Sample Entropy (COSEn) was designated to quantify the higher entropy characteristics of AF with respect to NSR, and the algorithm was optimized for very short time series (Lake and Moorman, 2011). Local Dynamics score (LDs) is a new index proposed to capture local dynamics of the heart rate, that are related to the baseline variability and to the outliers, such as ectopy (Moss et al, 2014), and it was also designed to work on 12-beat segments. Detrended Fluctuation Analysis (DFA) is a well-known method to quantify the fractal-like scaling properties of the RR interval time series (Peng et al, 1995).
The second objective was to analyze the mortality risk over 2 years of the same population, based on COSEn and LDs indices only. We hypothesized that the combination of these two entropy-based dynamical measures could help to shed light on association between cardiac arrhythmias and mortality risk.
Material and Methods
We studied RR interval time series from 24 hour Holter recordings collected from 2’722 consecutive patients at the University of Virginia (UVa) Heart Station from 12/2004 to 10/2010. The RR series were subdivided into 377’285 10-minute segments. Each 10-minute segment was classified as AF if the burden of AF was greater than 5%, as SR with ectopy if the burden of ectopy was more than 10%, as NSR otherwise. Thus, the dataset is composed of 79% NSR, 8% AF and 13% SR with ectopy segments. The 3 categories are mutually exclusive and reflect clinical practice.
4
To test the overall hypothesis that dynamical measures were useful for rhythm classification, we used several schemes. The strategy was to compare the accuracy of classification using means and standard deviations of RR series alone, and after addition of the 3 dynamical measures - COSEn, LDs and slope of DFA. The first scheme was a system of 3 multivariate logistic regression models, each used to distinguish one rhythm class from the other two. The second approach was a k-nearest neighbors technique. All models were validated using a 10-fold cross-validation procedure on the entire dataset. Finally, the models were externally validated on the MIT-BIH database.
We assessed mean, standard deviation, COSEn and LDs on 30 second segments and then we averaged the results over 10 minute, while DFA was computed on 10-minute segments.
As regard the analysis of the mortality risk, we performed a multivariate kernel density study on the histograms of the joint distributions of COSEn and LDs estimated on the UVa database. The kernel chosen is a bivariate Gaussian with a diagonal bandwidth matrix, which allows different amounts of smoothing in each of the coordinates (Botev et al, 2010). The two bandwidth parameters are chosen optimally without assuming a parametric model for the data (Lake, 2009).
Results
Our major finding is the improvement in the distinction of SR with ectopy using the dynamical measures from the other two groups. The positive predictive value using either regression models or k-nearest neighbor (k-NN) analysis was 85%, with higher values for the diagnosis of NSR (96%) and AF (90%). The accuracy increased further if the threshold for diagnosing ectopy was higher than 10% burden. Surprisingly, these measures do not distinguish well between atrial and ventricular premature beats, a potentially important clinical distinction. PACs may be harbingers of AF, and PVCs are associated with increased mortality, especially when structural heart disease is present. We tested a logistic regression scheme with 4 models to distinguish among NSR, AF, SR with PVCs and SR with PACs but a large misclassification error occurred when the two ectopy classes are separately analyzed.
5
The models were externally validated using the canonical MIT-BIH databases of NSR, AF and other arrhythmias (ARH). Here the positive predictive values for NSR and AF rose to 99% and 96%, respectively, but fell for SR with ectopy to 45%. This may be explained by the much lower incidence of SR with ectopy in the highly selected MIT-BIH databases, where they represented <1% of the 11’196 10-minute segments, compared with 13% of the 377’825 10-minute segments in the UVa database.
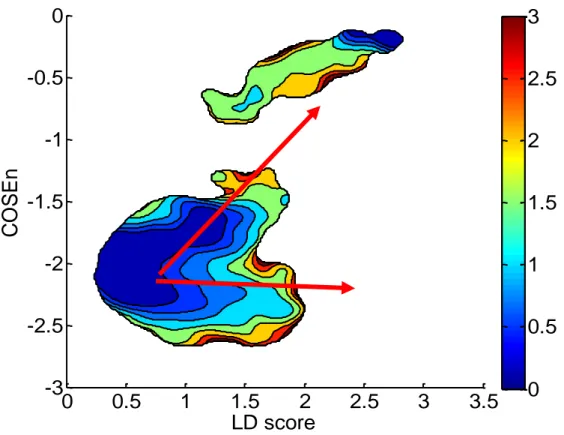
The second objective was to analyze the mortality risk over 2 years of the population considering only patients with age over 40 years. The result is a color map of the risk, shown in Figure 1.
Figure 1. Mortality risk over 2 years of the UVa Holter population
A well-defined royal blue region, i.e. with very low mortality risk, is characterized by low values of LDs, whereas high-risk zones are related to higher values of the index. In particular, starting from the low risk region (left lower edge), it is possible to distinguish two different directions along which the risk becomes higher: the first, marked by the lower arrow, evolves toward increased values of LDs independently of COSEn values, whereas the second one, highlighted by the upper
LD score
C
O
SEn
0
0.5
1
1.5
2
2.5
3
3.5
-3
-2.5
-2
-1.5
-1
-0.5
0
0
0.5
1
1.5
2
2.5
3
6
arrow, points toward both higher values of LDs and COSEn, reaching the maximum for both the indices
The results hint that heart rate dynamics, alone, can inform on the mortality risk. In particular, our results supports the idea that condition characterized by AF, high burden of ectopy and reduced variability are associated to mortality.
Discussion and Conclusion
This work proved the benefit of dynamical measures in the problem of arrhythmias detection and classification. COSEn and LDs were already tested as efficient measures to specifically detect AF and abnormal local dynamics, respectively (Lake and Moorman, 2011) (Moss et al, 2014). Furthermore, this work included the short-term scaling exponent obtained from DFA computed over 10-minute segments as a useful parameter to distinguish three very important clinical arrhythmias, such as NSR, AF and SR with a certain burden of ectopy. However, future improvements can be done by investigating different types of classification algorithms.
Our clinical emphasis constrains our analysis in several ways. First, we consider atrial flutter to be the same as AF. This approach, which is based on the similarities in clinical management, can certain lead to misclassifications with NSR. Second, we assigned the diagnosis of AF when as little as 30 seconds, or 5% of a 10-minute segment was present. This is consistent with clinical practice, where episodes lasting as in our case elicit full consideration in AHA guidelines (Fuster et al, 2006), and thus can lead to treatment measures as for AF. Finally, as previously stated, we assigned the diagnosis of ectopy when as little as 10% is present. The end result of these classification produced a diagnose of AF or SR with ectopy even when the rhythm is 90% or more purely normal SR.
An accurate arrhythmias detection and classification together with an effective method to determine the risk of the subject associated with the arrhythmias, both based only on RR interval time series, could have an important clinical impact for the management of hospitalized and ambulatory outpatients.
7
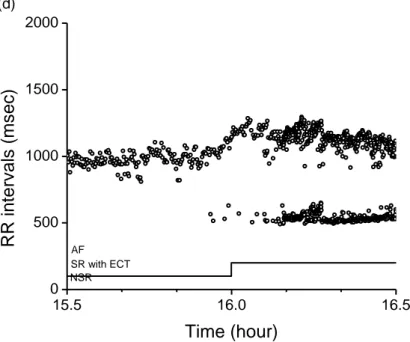
Moreover, the potentialities of an automatic RR-based arrhythmias classifier are enormously important in new growing fields as home care monitoring and telemedicine, where it could find extensive applications, but also in intensive care unit (ICU) setting. The potentiality of this analysis is represented indeed by its ability to work on segments of only 10 minutes, with an update of the values every 30 seconds, allowing it to be potentially useful in a clinical setting, where a continuous monitoring of the changes in cardiac rhythm and their relative risk is crucially important and can be life-saving. An example of the effectiveness of the classifier in a real time context is reported in Figure 2. The RR interval time series is depicted with dots, the line at the bottom represents the output of the classification model proposed in this thesis with an update performed every two minutes.
Figure 2. One hour segment of RR interval time series extracted from 24 hour Holter record. It is visible a transition from NSR to SR with ectopy, that the model (bottom solid line) efficiently tracks.
On the other hand, the idea of a “risk map” where regions of low, average and high mortality risk are depicted, can find interesting applications in clinical care too. The map permits to follow the patient course and to see if the therapy is able to maintain the patient or to bring the patient back to the safe region. The monitoring could be performed also real time.
15.5 16.0 16.5 0 500 1000 1500 2000 (d) RR in terv al s (ms ec) Time (hour) AF SR with ECT NSR
8
Sommario
Introduzione
Le malattie cardiovascolari sono considerate una delle principali cause di mortalità nei paesi sviluppati, ed è stato stimato che più del 30% di tutti i decessi è associato ad esse (Go et al, 2013). Le contrazioni ventricolari premature (PVCs) sono responsabili di una prognosi negativa anche in assenza di difetti strutturali del cuore (Cha et al, 2012) (Lee et al, 2012), mentre le contrazioni atriali premature (PACs) precedono eventi di fibrillazione atriale (AF) (Haissaguerre et al, 1998) e sono considerati marker di episodi parossistici di AF in pazienti che hanno subito un ictus ischemico acuto (Wallmann et al, 2007). AF è stata riconosciuta come uno dei principali fattori di rischio di ictus ed è associata ad un generale aumento di morbidità e mortalità cardiovascolare (Benjamin et al, 1998) (Wolf et al, 1991) (Stewart et al, 2002). Data la sua maggiore incidenza in pazienti anziani (Lake and Moorman, 2011) e il rapido invecchiamento della popolazione globale, diventa sempre più crescente il bisogno di dispositivi elettronici meno invasivi ed accurati per il rilevamento di episodi di AF.
La presenza di AF implica decisioni cliniche importanti, come terapie con anticoagulanti o la rimozione chirurgica dell’appendice atriale, cardioversione, ablazione e farmaci antiaritmici. Al contrario, quando sono presenti battiti prematuri, sia di origine atriale che ventricolare, ma non è stata diagnosticata nessun’altra patologia cardiaca, non viene prescritto nessun trattamento al paziente, anche se la percentuale di extrasistolie è molto elevata.
I dispositivi che sono presenti attualmente per il rilevamento delle aritmie cardiache, come per esempio l’ECG Holter, sono scomodi per il paziente e si basano sull’analisi del segnale ECG. Tuttavia il segnale ECG può essere molto rumoroso e affetto da artefatti, rendendo l’estrazione di parametri in questi casi complicata e spesso non praticabile.
9
La serie degli intervalli RR, al contrario, è un segnale affidabile, richiede un minor costo computazionale ed è meno soggetta al rumore.
Tuttavia, l’uso di strumenti non invasivi per il rilevamento del ritmo cardiaco non è molto diffuso a causa della bassa affidabilità dimostrata finora da questi dispositivi nel rilevare episodi di AF basandosi solo sul segnale RR. In letteratura sono presenti molti studi che documentano l’accuratezza dei metodi proposti per distinguere AF dal ritmo sinusale normale (NSR) basandosi sul fatto che le dinamiche dei due ritmi sono largamente differenti (Sarkar et al, 2008) (DeMazumder et al, 2013) (Lake and Moorman, 2011) (Tateno and Glass, 2001). Tuttavia, in presenza di un ritmo sinusale (SR) e un’alta percentuale di battiti prematuri, sia atriali che ventricolari, le caratteristiche del segnale possono confondersi con quelle di un segnale di AF.
L’obiettivo principale di questa tesi è di fornire un algoritmo per il rilevamento e la classificazione di AF anche in situazioni in cui siano presenti alte percentuali di battiti ectopici, basandosi solo sulle caratteristiche estratte da serie temporali RR. L’ipotesi di partenza è che indici legati alle dinamiche non lineari delle serie RR possano contribuire a una distinzione migliore tra AF e SR con battiti prematuri. Tre indici non lineari sono stati presi in considerazione. Il Coefficient of Sample Entropy (COSEn) è stato proposto per distinguere NSR da AF, condizione che presenta alti valori di entropia, ed il suo calcolo è stato ottimizzato per segnali molto brevi (Lake and Moorman, 2011). Il Local Dynamics score (LDs) è stato recentemente proposto come nuovo indice in grado di catturare le dinamiche locali non lineari del segnale RR, proprietà che sono legate alla variabilità cardiaca e alla presenza di battiti ectopici. Per ottenere un singolo valore di LDs sono necessari solamente 12 battiti (Moss et al, 2014). Infine la Detrended Fluctuation Analysis (DFA) è invece un metodo utilizzato per quantificare le proprietà frattali delle serie RR (Peng et al, 1995).
Il secondo obiettivo è di fornire un’analisi del rischio di mortalità nei 2 anni successivi all’esame sulla stessa popolazione, utilizzando solo le misure di COSEn e LDs. È stato ipotizzato che una combinazione delle informazioni derivanti dai due parametri non lineari potesse essere utile nel comprendere l’associazione tra la presenza di aritmie cardiache e il rischio di mortalità.
10
Materiali e Metodi
2’722 registrazioni Holter di 24 ore sono state raccolte alla University of Virginia (UVa) Heart station dal 12/2004 al 10/2010. Le serie RR sono state suddivise in 377’285 segmenti da 10 minuti e ciascun segmento è stato classificato come: AF se la percentuale di battiti classificati come AF era superiore al 5%; SR con battiti prematuri se la frequenza di extrasistolie era superiore al 10%; NSR in tutti gli altri casi. Il database risulta così composto: 79% di segmenti classificati come NSR, 8% come AF e 13% come SR con battiti ectopici. Le tre categorie sono mutualmente esclusive e rispecchiano la pratica clinica.
Per testare l’ipotesi che l’aggiunta di misure dinamiche non lineari contribuisse ad aumentare la performance della classificazione, sono state utilizzati diversi metodi. Il criterio generale è stato quello di confrontare l’accuratezza della classificazione basata solo sulla media e la deviazione standard delle serie RR rispetto alla stessa classificazione ottenuta con l’aggiunta delle tre misure non lineari – COSEn, LDs e il coefficiente DFA. Il primo metodo si basa su tre modelli di regressione logistica multivariata, ciascuno dei quali distingue un gruppo dagli altri due. Il secondo approccio usa l’approccio k-nearest neighbor (k-NN). Tutti i modelli sono stati validati utilizzando la procedura 10-fold cross-validation sull’intero database. Infine, i modelli sono anche stati validati esternamente sul database MIT-BIH.
Gli indici media, deviazione standard, COSEn e LDs sono stati calcolati ogni 30 secondi e poi i valori sono stati mediati sui 10 minuti, mentre la DFA è stata valutata considerando l’intero spezzone da 10 minuti.
Per quanto riguarda l’analisi del rischio di mortalità, è stata stimata la densità della distribuzione congiunta delle variabili COSEn e LDs usando dei kernel multivariati. Il kernel selezionato ha caratteristiche gaussiane bivariate con una matrice di larghezza di banda diagonale, che permette un’attenuazione delle alte frequenze in ciascuna coordinata (Botev et al, 2010). La scelta dei due parametri di è stata ottimizzata e non prevede un modello parametrico per i dati (Lake, 2009).
11
Risultati
Il risultato principale consiste nel miglioramento della distinzione di SR con battiti prematuri grazie all’aggiunta delle misure non lineari. Il valore predittivo positivo sia nel caso del modello logistico che nel caso del modello k-NN è pari a 85% e i valori per la diagnosi di NSR e AF risultano anche più elevati, e pari rispettivamente a 96% e 90%. L’accuratezza cresce ulteriormente se la soglia imposta sulla percentuale di battiti ectopici, necessaria per classificare il segmento come SR con battiti prematuri, viene scelta superiore al 10%.
I risultati mostrano che le misure utilizzate in questo studio non sono in grado di distinguere tra SR con PVCs e SR con PACs, contrariamente a quanto ci si aspetterebbe. Una identificazione tra questi due ritmi è tuttavia clinicamente molto importante, in quanto i PACs possono essere precursori di un imminente episodio di AF, mentre i PVCs sono associati con un alto rischio di mortalità, soprattutto se in pazienti con malattie cardiache preesistenti. Per verificare questa ipotesi, 4 modelli di regressione logistica sono stati sviluppati per differenziare segmenti classificati come AF, NSR, SR con PVCs e SR con PACs, ma i risultati mostrano un’alta percentuale di errore nella distinzione delle due classi con battiti ectopici, cioè tra SR con PVCs e SR con PACs.
I modelli sono stati ulteriormente validati utilizzando i database MIT-BIH di NSR, AF e altre aritmie (ARH). In questa analisi i valori di predizione positiva nel caso di NSR e AF raggiungono percentuali pari rispettivamente a 99% e 96%, ma nel caso di SR con battiti prematuri i valori ottenuti sono peggiori. Ipotizziamo che questo sia dovuto alla bassa incidenza di segmenti classificati come SR con battiti prematuri nel database MIT-BIH, dove sono meno dell’1% di 11’196 segmenti da 10 minuti, mentre nel database UVA erano il 13% di 377’825 spezzoni
Infinte per quanto riguarda l’obiettivo secondario di indagare il rischio di mortalità entro 2 anni dall’esame Holter nella popolazione Holter UVa, solo pazienti con età superiore a 40 anni sono stati presi in considerazione e il risultato principale di questa analisi è una mappa del rischio mostrata in Figura 1.
12
Figura 1. Rischio di mortalità entro 2 anni dall’esame Holter ECG nella popolazione Holter UVa
Si nota come la regione associata a un basso rischio di mortalità (blu scuro) è caratterizzata da bassi valori di LDs, mentre regioni a rischio di mortalità più alto sono contraddistinte da valori maggiori dell’indice. In particolare, partendo dall’area a basso rischio nell’angolo in basso a sinistra, è possibile notare due direzioni di aumento del rischio: la prima, indicata dalla freccia in basso, evolve verso valori crescenti di LDs indipendentemente dai valori assunti da COSEn; la seconda, indicata dalla freccia in alto, ha una direzione verso valori più alti di entrambi gli indici, raggiungendo la zona con i valori massimi.
Questi risultati suggeriscono che misure legate alle dinamiche non lineari del segnale di frequenza cardiaca contengono informazioni associate al rischio di mortalità e, in particolare, situazioni di AF, SR con ridotta variabilità e alta percentuale di battiti prematuri sono altamente associate ad un aumento di mortalità.
LD score
C
O
SEn
0
0.5
1
1.5
2
2.5
3
3.5
-3
-2.5
-2
-1.5
-1
-0.5
0
0
0.5
1
1.5
2
2.5
3
13
Discussioni e Conclusioni
In questo lavoro di tesi si è dimostrata la potenzialità di usare misure non lineari per ottimizzare la classificazione del ritmo cardiaco e identificare aritmie cardiache. Mentre parametri come il COSEn e LDs erano già stati validati come misure utili per l’identificazione rispettivamente di AF e dinamiche locali alterate (Lake and Moorman, 2011) (Moss et al, 2014), in questa tesi è stato proposto il coefficiente di breve scala ricavato dalla Detrended Fluctuation Analysis. Studi futuri possono avere come obiettivo quello di investigare diversi tipi di algoritmi per la classificazione a partire da questi stessi indici o addirittura includendo altri indici.
La forte impronta clinica di questo studio ha limitato l’analisi in diversi aspetti. Per prima cosa, i flutter atriale sono stati inclusi nella stessa classe dell’AF, in base al fatto che in entrambi i casi i medici prescrivono gli stessi trattamenti clinici. Tuttavia il flutter atriale è un ritmo che viene comunemente confuso con il ritmo NSR. In secondo luogo, è stata assegnata l’indicazione di AF a spezzoni con solo il 5% di battiti classificati AF, cioè 30 secondi in un segnale di lunghezza pari a 10 minuti, secondo le linee guida dell’American Heart Association secondo cui per un episodio parossistico di AF di durata 30 secondi viene consigliato un trattamento come per l’AF (Fuster et al, 2006). Infine, come precedentemente descritto, è stato assegnata la classificazione di SR con battiti prematuri anche quando solo il 10% dei battiti era identificato come prematuro. Entrambe queste scelte hanno portato alla diagnosi di AF o SR con battiti prematuri in casi in cui il ritmo è classificato per più del 90% come sinusale.
La possibilità di ricavare dall’analisi della sola serie RR una classificazione accurata delle aritmie cardiache e un metodo efficace per determinare il rischio del paziente in presenza di determinate aritmie, può avere un grosso impatto clinico per il trattamento di pazienti ospedalizzati e ambulatoriali.
Inoltre, le potenzialità di un classificatore automatico basato sul segnale RR sono rappresentate dall’applicazione in ambiti come l’home care monitoring e la telemedicina in crescente sviluppo, ma anche in ambiti come la terapia intensiva. La potenzialità di questa analisi risiede nell’abilità del classificatore proposto di funzionare con segmenti di 10 minuti e fornendo un aggiornamento dei valori dei
14
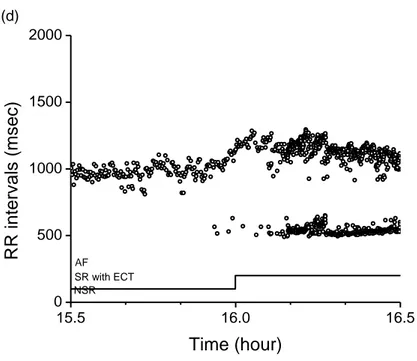
parametri ogni 30 secondi. Questo lo rende uno strumento utile in scenari clinici, dove un monitoraggio continuo dei repentini cambiamenti nel ritmo cardiaco e del rischio del paziente è d’importanza cruciale. Un esempio è mostrato in Figura 2, dove viene mostrata la serie RR (punti) e la linea nella parte bassa del grafico mostra l’uscita del modello di classificazione proposto in questa tesi, aggiornata ogni 2 minuti.
Figura 2. Spezzone di un’ora della serie RR estratta da una registrazione Holter di 24 ore. E’ visibile una transizione da ritmo NSR a SR con battiti prematuri di cui il modello (linea inferiore nel grafico) riesce efficacemente a identificare.
Inoltre, anche la proposta di una “mappa di rischio” dove vengono rappresentate regioni di basso, medio e alto rischio può trovare applicazioni interessanti in ambito clinico. Questa mappa permette di visualizzare i miglioramenti o peggioramenti del paziente e verificare se certi trattamenti sono efficaci nel ridurre il rischio. Il monitoraggio può essere effettuato in tempo reale similmente al classificatore proposto. . 15.5 16.0 16.5 0 500 1000 1500 2000 (d) RR in terv al s (ms ec) Time (hour) AF SR with ECT NSR
15
Chapter 1
Introduction
1.1. Background and motivation
Several common clinical scenarios call for identification of cardiac rhythm in ambulatory outpatients. Atrial fibrillation (AF) is one of the most common chronic arrhythmia associated with an adverse prognosis, being an independent risk factor for increased cardiovascular morbidity and mortality (Benjamin et al, 1998) (Wolf et al, 1991) (Stewart et al, 2002). Its incidence is estimated to double with each successive age decade beyond 50 years, and it is greater in men than in women (Kannel et al, 1998). As reported by the World Health Organization (WHO) in 2012, the world’s population is rapidly ageing, estimating a doubling of people over 60 years from about 11% to 22% between 2000 and 2050. In terms of absolute numbers, the expected increase is from 605 million to 2 billion. This situation claims for effective detection and monitoring of AF in a rapidly increasing part of the population, and the need of low-cost, accurate and comfortable devices for cardiac rhythm monitoring is emerging. AF is often paroxysmal in nature and decisions about its therapy are better supported by knowledge of the frequency, duration and severity of the arrhythmia (Prystowsk, 2000). While implanted devices can record this information with great accuracy (Ricci et al, 2009) (Hindricks et al, 2010), non-invasive diagnostic devices for ECG recording are limited by the need for skin electrodes and, while much smaller than in past years, these recording apparatus are obtrusive for the patients (Barret et al, 2014). Holter recording is a very common technique to monitor patients with cardiac disorders; it consists of a registration of a patient’s ECG by means of a portable device, typically at least 24 h long or more. Because of the paroxysmal occurrence of AF, short ambulatory recordings are not sufficient to identify brief periods of arrhythmia, thus claiming for longer monitoring. Nonetheless, even high fidelity monitoring system as Holter device, can be limited by noisy and distorted
16
waveform data, which makes the features extraction from ECG waveforms not always feasible.
The most frequently available and reliable data is the series of the time intervals between two consecutive heartbeats or pulses, which is called RR interval time series. The analysis of this signal requires less computational cost with respect to the ECG feature extraction procedure and it’s less affected by high frequency noise.
Since the 1980s, with the advent of chaos and information theory, the nonlinear and fractal behavior of heart rate (HR) signal has been investigated, beginning with the demonstration of self-similarity by Goldberger (Golberger et al, 1985). In the following years, many researchers began to analyze RR interval time series for clinical purposes (Braun et al, 1998) (Cerutti et al, 2007) (Ferrario et al, 2006). The idea, now widely accepted, is that the complex physiological variability of sinus rhythm (SR) is affected by age and illness and, thus, numerical analysis of RR series can help in clinical prognosis (Buchman et al, 2002) (Goldberger, 1996) by adding valuable information to traditional parameter. Many algorithms for analyzing RR interval time series exist (Acharya et al, 2006) (Bravi et al, 2011). These are usually classified in time domain, frequency domain, phase domain, non-linear dynamical domain, though Bravi et al (2011) have suggested a new classification into statistical, geometric, energetic, informational and invariant domains.
However, non-invasive devices for determining heart rhythm are not commonly used because of reduced confidence in detecting AF based only on the heart rate or RR interval time series. In fact, many methods to distinguish between AF and Normal Sinus Rhythm (NSR) has been proposed, given the largely different dynamics between the two rhythms (Tateno and Glass, 2001) (Sarkar et al, 2008) (DeMazumder et al, 2013) (Lake and Moorman, 2011), but situations of SR with frequent ectopy is expected to share features with AF, and thus to be distinguished with difficulty.
However these two conditions are treated very differently in clinical practice. Premature ventricular contractions (PVCs), alone, lead to poorer prognosis even in patients with no obvious heart disease (Cha et al, 2012). Indeed the cardiac
17
functionality improves after cardiac ablation in the great majority of patients with very frequent PVCs and low ejection fraction at the time of ablation (Yokokawa et al, 2013). However, no treatments are required even in situations with high burden of ectopic beats without concomitant pathological conditions such as cardiomyopathy. Premature atrial contractions (PACs), alone, don’t have an important clinical impact but they may indicate a high risk of more severe atrial fibrillation or flutter. The remarkable difference between AF and SR with atrial or ventricular ectopy in terms of clinical implication claims for an accurate distinction of them, in order to give the adequate treatment to the patient and reduce the mortality.
1.2. Cardiac arrhythmias: pathophysiology and therapies
1.2.1.
The electrical activity of the heart
The beginning of the sequence of stimulations, which is conducted over all the heart and allows it to contract, is placed in the sinus atrial node (SA node). It is a group of pacemaker cells approximately 2 mm thick and 8 mm long located between the right atrium and superior vena cava. These cells possess automaticity, which is the ability to depolarize without any external electrical stimulus. They spread a wave of depolarization through all the atria causing their contraction, called systole. The heart rate is the count of these contractions in a minute and it is determined by the duration of the depolarization and repolarization cycle of the SA node. The SA node maintains the heart rate regular, but there are a lot of outside sources that influence the electrical activity of the SA node. This extrinsic regulation of heart rate reflects the heart’s ability to adapt to changing circumstances by detecting and quickly responding to unpredictable stimuli. The autonomic nervous system (ANS) plays the main role in this regulation governing the SA node through the parasympathetic (Vagus nerve) and sympathetic efferent. The ANS has indeed two contrasting components: the sympathetic and the parasympathetic nervous systems. The result of a sympathetic stimulation is an increase of the firing rate of the SA node and contractility of the heart, while the parasympathetic stimulation has an opposite effect. The first usually occurs in response to stress, exercise and heart disease, the second instead responds to the function of internal organs, trauma and allergic
18
reactions. The frequency band ranges of these two systems are different: low frequencies (0.04-0.15 Hz) are associated to sympathetic activation, while higher frequencies (0.15-0.4 Hz) are associated to parasympathetic firing.
After the atria, the pacemaker stimulus reaches the atrioventricular (AV) node. The AV node is a group of cells about 22 millimeters long, 10 millimeters wide and 3 millimeters thick that is located at the mouth of the coronary sinus between the right atrium and ventricle. For the electrical stimulus there isn’t another way to be propagated to the ventricle. The purpose of this node is to reduce the speed of the impulse allowing the spilling of blood into the ventricles before their contraction, a heart cycle phase named diastole. The node is divided in three sections. Two of them allow the delay of the electrical pulse by means of the slow rate of conduction of the cells for one section and by means of a long pathway for the second one. The third section is the connection between the AV node and the Bundle of His. The AV node is also influenced by the ANS: the parasympathetic system can act prolonging the conduction through the AV node and, consequently, increasing the length of diastole and decreasing the heart rate; under intense parasympathetic stimulation, it can even happen to have a complete AV block. The sympathetic system, in contrast, decreases the conduction time through the node.
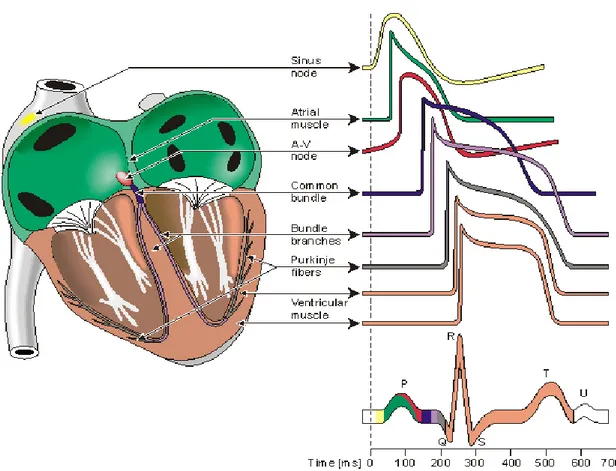
After the passage through the AV node, the electrical impulse is transmitted through the Bundle of His, which extends into the ventricular septum, and then it separates into the left and right bundle branches. These last branches formed the Purkinje system that conducts the electrical stimulus from the apex of heart upward through the ventricles (Figure 1.1). Once the impulse reaches these fibers, the systolic contraction becomes fully initiated.
This cycling propagation of the electrical impulse from the SA node, through the AV node, till the Purkinje fibers generating the contraction of the ventricles, can be recorded by the ECG, which has a characteristic waveform shown in Figure1.1. It is the result of the depolarization and repolarization of the four chambers of the heart in one cardiac cycle. The P wave refers to the depolarization of the atria, the QRS complex represents the depolarization of ventricles. The next T wave indicates the repolarization of the ventricles, while the atria’s repolarization is hidden by the
19
higher amplitude of the QRS complex. The U wave is very small, so it is not always appreciable in ECG and it denotes the repolarization of the papillar muscles.
The physiological beating of the heart and, thus, the recurrence of this typical waveform is indicated as the so-called normal sinus rhythm.
20
1.2.2.
Pathogenesis of arrhythmias
Arrhythmia is a general term for any cardiac rhythm that deviates from normal sinus rhythm, caused by an irregular electrical activity of the heart. If the rhythm is faster it is called tachycardia, while if the heartbeat is slower than normal it is called bradycardia. Moreover, arrhythmias can be called atrial or ventricular based on where the arrhythmia has originated.
There are three basic mechanisms of pathogenesis of arrhythmias, regardless the specific type of arrhythmia: enhanced or suppressed automaticity, triggered activity, or re-entry. Automaticity is a natural property of all the cardiac cells to self-regulate and to initiate an impulse without an external stimulus. However, factors as aging, medications and others can alter this automaticity in different portion of the heart. For example, suppression of automaticity of the SA node can result in sinus node dysfunction, which is still the most common indication for permanent pacemaker implantation.
Triggered activity occurs when a series of heartbeats which spontaneously originate from afterdepolarizations, which are oscillations in membrane potential that follow the upstroke of an action potential. These can be of two types: early afterdepolarizations, occurring during the repolarization of the action potential, and delayed afterdepolarizations, which occur when the repolarization is complete or nearly complete. When the afterdepolarizations are large enough to reach the threshold, an action potential results, called triggered.
The most common mechanism of arrhythmogenesis is the re-entry. It is related to the process of re-excitement of the heart cells after the end of the refractory period due to impulses that fail to die out after normal activation of the heart. Re-entrant arrhythmias are defined as continuous repetitive circular propagation of excitatory waves, which return to their originating site and re-activate it. Atrial or ventricular fibrillation and tachycardia are generated by this mechanism.
1.2.3.
Atrial Fibrillation
Atrial Fibrillation (AF) is considered the most common supraventricular tachycardia. About 2.2 million US citizens live with this condition and its incidence is estimated to double with each successive age decade beyond 50 years. After
21
adjusting for cardiovascular risk factors and predisposing conditions, the risk of AF was still found to increase 2-fold for each decade of aging and it was predominantly present in male than in female (Kannel et al, 1998).
During AF, the normal regular electrical pulses generated by the SA node are overcome by disorganized electrical pulses mostly originating in the left atrium and in the roots of the pulmonary veins. The atrial impulse rate can achieve about 300-600 beats per minute nullify the delay action of AV node because of the fast, chaotic and irregular nature of the impulses. This leads to an inadequate emptying of both atria and ventricles, due to the irregular and fast contraction rate. The inadequate emptying of the ventricles leads to a reduction of stroke volume causing symptoms as fatigue, breathlessness and chest pain, depending on the frequency and severity of AF.
The inadequate emptying of the atria allows blood to stagnate into the atria too. Within the left atrium there is an area called atrial appendage or auricola, due to an enlarged atrial muscle mass that forms a pouch, which usually works as decompression chamber during ventricular systole or when the atrial pressure is too high. During AF, the atria are not able to empty and this leads to clot formation in the appendage. When a blood clot breaks away, the risk of embolism and of an embolic stroke is very high (Wolf et al, 1991). Moreover, because the blood stagnates, the atria become enlarged with time and this may be a predisposing factor for permanent AF condition in adult patients or dilated cardiomyopathy.
An AF episode can last from minutes to days or can even be permanent. In the first case, if the episode self-terminates in less than 7 days, it is called paroxysmal AF. On the contrary, if the event lasts for more than 7 days it is classified as persistent AF. If there is an ongoing long-term episode (i.e. a year or more) the AF is categorized as permanent. Episode that last less than 30 seconds are not included in this classification. This classification was recommended by the American College of Cardiologist (ACC), the American Heart Association (AHA) and the European Society of Cardiology (ESC).
AF is generally associated with underlying cardiac diseases. Usually a damage of the heart tissue may generate extra impulses, whereas stretching and
22
remodeling of the cardiac muscle tissue may increase atrial pressure, and consequently the pressure on the pulmonary veins. This may be a contributing factor to other contributing causes to AF such as atherosclerosis, heart failure, hypertension, coronary heart disease, valve disease and congenital heart disease (Cottrell, 2012).
For patients with AF, clinicians need to accurately evaluate prescription of oral anticoagulation and to decide the monitoring process of the patient, i.e. rate and type of examinations. Rhythm control is necessary to verify symptoms, prevent tachycardia-induced cardiomyopathy due to the high ventricular rate and prescribe therapy to restore normal sinus rhythm.
Cardioversion is the typical medical procedure to restore the abnormal rhythm to the normal sinus rhythm. The synchronized electrical cardioversion consists in the electrical shock sent to a portion of the heart at a specific phase of the cardiac cycle, commonly in correspondence of R peak. The pharmacological cardioversion consists in giving specific antiarrhythmic agents to the patient. Drugs like amiodarone, diltiazem, verapamil and metoprolol are frequently given before cardioversion to decrease the heart rate, stabilize the patient and increase the chance that cardioversion is successful
The increased risk of stroke associated with the presence of AF requires specific antithrombotic treatments, as oral anticoagulants, among which the most common is warfarin. The implications for anticoagulation therapy alone are enormously important, as the rate of stroke rises sharply with even short episodes of AF (Healy et al, 2012). These therapies have been shown to lower the risk of clinical thromboembolism in all patients with AF, regardless of the type (paroxysmal, persistent or permanent) (Hart et al, 2007). However, the bleeding risk associated to anticoagulant therapy can exceed the risk of thromboembolism without therapy in the lowest-risk patients, thus, the initiation of antithrombotic treatment requires an accurate evaluation of both embolic and bleeding risk (Levine et al, 2001).
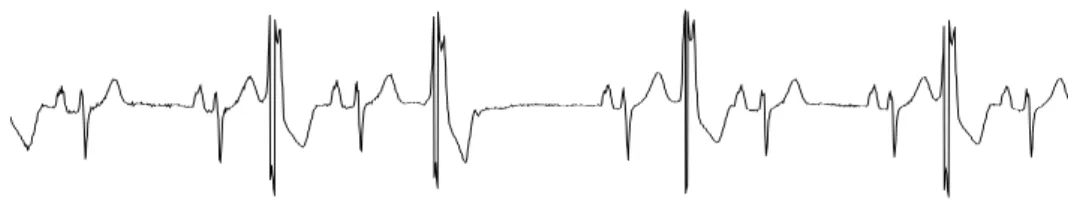
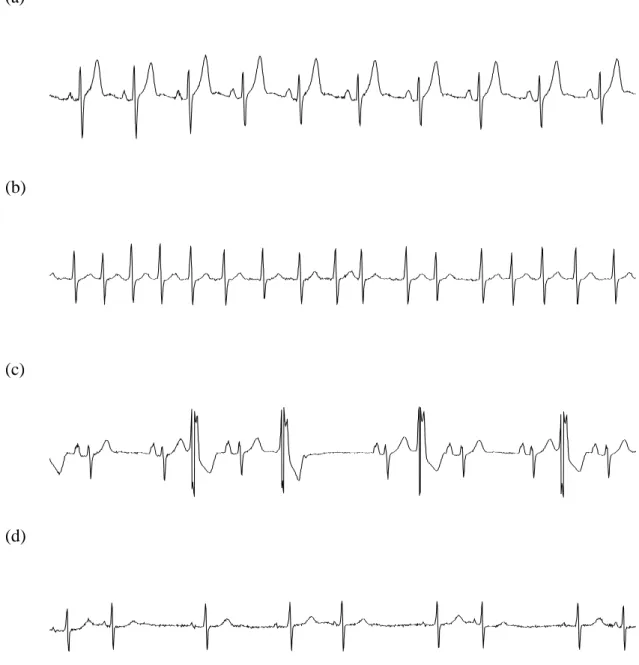
AF is usually diagnosed by the absence of the P waves in an ECG trace. P waves represent the atria depolarizations and in this case they are replaced by an irregular ventricular rate, as shown in Figure 1.2.
23
Figure 1.2 ECG of a patient in AF
1.2.4.
Atrial Flutter
Atrial flutter (AFL) is usually associated with a fast heart beat and it falls in the supraventricular tachycardia category. The origin of AFL is usually a premature electrical impulse arising in the atria, which propagates due to the differences in refractory periods of atrial tissue. The electrical signal travels in an organized circular motion within the atria, causing them to beat faster than the ventricles. But not all the impulses risen in the atria reach the ventricles, thanks to the low-pass filtering action of the AV node, which limits the maximum heart rate. Flutter rates can reach even 300-400 bpm, but only a portion of these impulses reach the ventricles based on the stable n : 1 conduction regime of the AV node. For this reason AFL gives rise to a very fast and regular heart rate, completely different from AF, although AFL requires the same treatment. Usually it develops in adults with various types of heart disease or severe pulmonary disease and after cardiac surgery (Kastor, 2002). Figure 1.3 shows the ECG signal of a patient with AFL.
24
1.2.5.
Premature Atrial Contractions
Premature Atrial Contractions (PACs) are produced by abnormalities of the atrial electrical activity, which lead to early contractions of the atria before the normal impulse from the SA node. The morphology of the P wave is abnormal, reflecting its origin in a different location than in the sinus node. Typically, the impulses propagate normally through the AV node generating narrow QRS complexes with a regular morphology. PACs, alone, don’t have a big clinical importance and often they don’t require specific treatments, but they may indicate a high risk of more severe atrial arrhythmias, such as AF or AFL. Figure 1.4 shows the ECG signal of a patient in SR with PACs.
Figure 1.4 ECG of a patient in sinus rhythm with PACs
1.2.6.
Premature Ventricular Contractions
Premature ventricular contractions (PVCs) are contractions of the ventricles due to an impulse started in the Purkinje fibers rather than in the SA node. In this situation, ventricles contract before the atria when they are not still filled, leading to a reduced stroke volume. The ECG waveform is characterized by a normal beat followed by a fast extra beat (the PVC), a slight pause, and a following beat more forceful than normal. This is due to the fact that the ventricle fills with more blood during the pause after the premature contraction, giving the next beat extra force. When looking to the ECG trace a PVC event is easily seen by the spacing from the QRS complex preceding the PVC, which is shorter than normal (i.e. the premature contraction), and the QRS complex following the event which is much longer than usual (i.e. the compensatory pause) and of larger amplitude. However, the total duration of the short premature beat and its compensatory pause lasts as two consecutive normal beats.
25
They can be occasional or persistent, leading in the latter case to typical pattern as bigeminy, when premature beats alternate with sinus beats, trigeminy, when a premature beat follows two normal beats, or quadrigeminy, when one every four beats is premature. Couplets and triplets are sequences of a normal beat followed by two or three abnormal beats, respectively, and when three or more consecutive PVCs occur at a rate greater than 100 bpm the rhythm is classified as non sustained tachycardia.
PVCs are a common arrhythmia that everybody could occasionally have (in healthy hearts 4% of the population has more than 100 PVCs/day (Lee et al, 2012)), but usually they are more frequent in patients with hypertension, cardiomyopathy, pulmonary disease, congenital heart disease, cardiac surgery and an important myocardial damage (Kastor, 2002). Figure 1.5 shows the ECG signal of a patient in SR with PVCs.
Figure 1.5 ECG of a patient in sinus rhythm with PVCs
1.3. Cardiac arrhythmias: mortality risk
Cardiovascular diseases are the leading cause of death in most of the developed countries, being associated with more than 30% of all deaths (Go et al, 2013). Therefore, there is a great interest in studying the underlying etiology of cardiac arrhythmias and new methods to improve their detection and classification, in order to prevent and treat the disease in advance, reducing the high burden of mortality.
AF is generally accepted as the most common chronic arrhythmia associated with an adverse prognosis, being an independent risk factor for increased cardiovascular morbidity and mortality. Clinical investigations revealed the significant association of AF to increased mortality risk, after adjusting for
26
coexistence cardiac conditions and common risk factors as age, hypertension, diabetes, left ventricular hypertrophy, myocardial infarction, congestive heart failure, valvular heart disease and stroke (Benjamin et al, 1998) (Krahn et al, 1995) (Stewart et al, 2002).
The relationship between AF and the risk of stroke, in particular, has been widely investigated. Together with hypertension, coronary heart disease and cardiac failure, which are well-known causes for stroke, AF was found to increase about five folds the risk of stroke, compared to the two, three and four folds related to coronary heart disease, hypertension and cardiac failure, respectively (Wolf et al, 1991). The high incidence of AF in old patients leads to a strong relation between AF and stroke especially in elderly, for whom all the other cardiovascular comorbidities become secondary factors.
Premature ventricular contractions have been thought for a long time to be relatively benign in absence of structural heart disease. Their effect on patients who have suffered myocardial infarction and in ambulatory patients with stable coronary heart disease has been widely studied. These works proved their strong relation with an increased mortality due to sudden and non-sudden cardiac death (Ruberman et al, 1981) (Moss et al, 1979) (Chugh et al, 2008). However, over the last decade, PVC-induced cardiomyopathy and left ventricular dysfunction has been subject of a great interest as many works proved this evidence (Cha et al, 2012) (Lee et al, 2012). Moreover, a recent research explored the relation between premature cardiac contractions and risk of incident ischemic stroke, resulting in an association of PVCs and PACs with a 2- and 1.3-fold increase in the rate of ischemic stroke, respectively (Ofoma et al, 2012).
The incidence of cardiac arrhythmias and their association with death have been investigated for many years even on critically ill hospitalized patients, especially those admitted in the Intensive Care Unit (ICU). Studies about the impact of arrhythmias in pediatric cardiac ICU (Hoffman et al, 2002), in the surgical ICU (Knotzer et al, 2000), in the medical ICU (Arrigo et al, 2013) (Khoo and Lip, 2009) (Reinelt et al, 2001) and on premature infants in the neonatal ICU (Southall et al, 1982), reveal the importance of arrhythmias in this clinical setting. The most common are supraventricular tachyarrhythmias as AF or AFL and ventricular
27
arrhythmias such as ventricular fibrillation or tachycardia. Furthermore many ICU patients experience more than one arrhythmias type (Hoffman et al, 2002). An overall increase in mortality risk in critically ill and arrhythmic patients was observed universally, explaining the urgent necessity of detailed etiological studies about cardiac rhythm abnormalities and methods to accurately detect them in many clinical setting and ambulatorial facility.
1.4. Cardiac Arrhythmias: detection algorithms
The strong relation between arrhythmias and mortality risk makes the clinical diagnosis of them extremely important, as discussed in the previous paragraphs, and this pushed researchers to develop new methods for the automatic detection and classification of various arrhythmias.
The majority of them are based on the analysis of the ECG morphology, being a non-invasive and low-cost method, which provides important information regarding the rate and the regularity of the heart. However, the extraction of ECG features for detection and classification of arrhythmias is not always feasible due to the presence of noise, which often makes the analysis on the ECG signal very difficult, and to the time-consuming computational process, which becomes thus ineffective for real time analysis.
Alternative approaches to the problem have been proposed, based on the direct analysis of the RR intervals time series. Although the high computational velocity and the absence of ECG noise allow these new techniques to be more efficient than the ECG-based algorithms, an important drawback is associated with the effectiveness of the QRS detector algorithm. However, sophisticated algorithms have been developed allowing a precise detection of the R peaks within good confidence intervals.
A good reason to prefer a RR-based arrhythmias classifier than an ECG-based algorithm is the fact that diagnostic ECG waveform may not always be available, especially in ambulatory monitoring, while the heartbeat can be easily detected in every clinical setting.
28
1.4.1 ECG based classification algorithms
Common features extracted from the ECG signal include frequency-based features (Minami et al, 1999), time frequency-based features (Tompkins, 1995), non-linear features such as Lyapunov exponent and the correlation dimension (Owis et al, 2002), ECG morphology features such as ST segment area, RS interval, ST slope, QRS area and R-wave amplitude (Chazal and Reilly, 2004) (Hosseini et al, 2006) (Cheng and Chan, 1998), Karhunen–Loeve expansion of ECG morphology (Moody and Mark, 1990) and wavelet transform (Senhadij et al, 1995) (Song et al, 2005) (Yu and Chen, 2008).
Recent methods for cardiac arrhythmias detection and classification employ neural networks (Minami et al, 1999) (Hosseini et al, 2006) (Yu and Chen, 2008) (Wang et al, 2001), hidden Markov models (Cheng and Chan, 1998), Linear or Quadratic Discriminant function (Chazal and Reilly, 2004) (Ouelli et al, 2012) and support vector machine (Song et al, 2005).
1.4.2 RR based classification algorithms
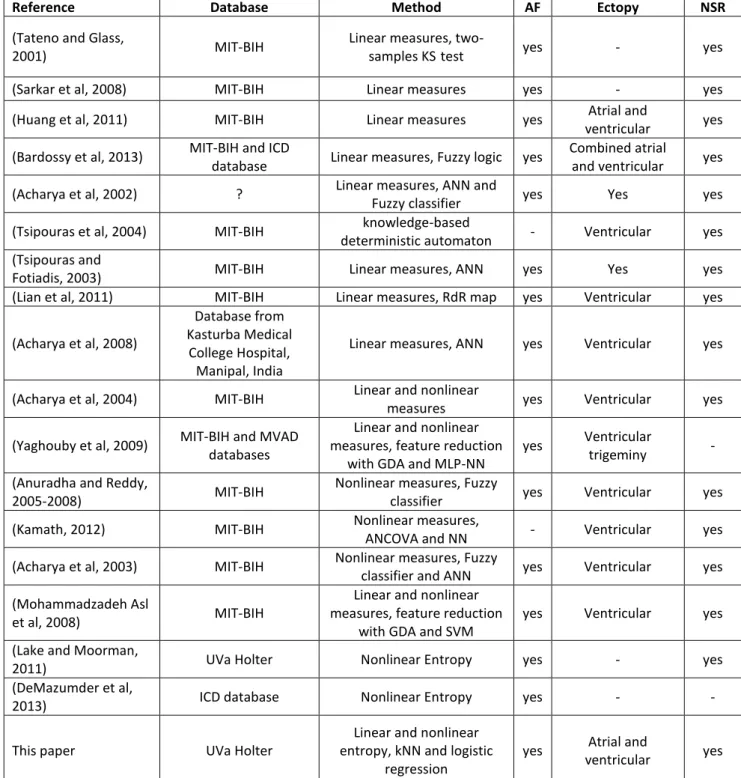
Using RR intervals time series for arrhythmias classification has lots of advantages, but few works have been done in this direction. A summary of them is presented in Table 1.1. The majority takes into account AF only, except two studies from Tsipouras et al (2004) and Kamath (2012). Moreover very few works admit atrial and ventricular ectopy. Only Huang et al (2011) and Bardossy et al (2013) consider both situations with PVCs and PACs. The first employed linear measures to identify the transitions between AF and NSR, whereas the second proposed a diagnostic algorithm for implantable cardioverter defibrillators. The second one reaches a very high accuracy, but the real innovation of that work consists in applying a new fuzzy logic-based scheme to standard measures of onset and instability. Tsipouras and Fotiadis (2003) proposed an automatic arrhythmia detector based on time and time-frequency domain analysis of the RR intervals. However, their method was designed to classify the input segment as “normal” or “arrhythmic” only without discrimination among the arrhythmias. Acharya et al (2002) employed an artificial neural network and a fuzzy equivalence classifier, combining linear and non-linear parameters, which could only classify the input segments into one of the
29
four different arrhythmia classes – ischemic cardiomyopathy, complete heart block, NSR and sick sinus syndrome together with AF and ectopy - without discrimination between AF and ectopic beats. The rest of the works listed in Table 1.1 consider only PVCs.
Linear and nonlinear measures are employed together with a variety of classification algorithms. The majority of these methods are tested on the canonical MIT-BIH database, which is relatively old and limited (free at http://www.physionet.org).
The classifier proposed in the present thesis was performed on a larger and more complex database of 2’722 24-hour Holter recordings collected at the University of Virginia (UVa) Heart Station from 12/2004 to 10/2010. The classifier was successively validated on the MIT-BIH database.
30
Table 1.1 List of works on RR-based classification algorithms
Reference Database Method AF Ectopy NSR
(Tateno and Glass,
2001) MIT-BIH
Linear measures,
two-samples KS test yes - yes (Sarkar et al, 2008) MIT-BIH Linear measures yes - yes (Huang et al, 2011) MIT-BIH Linear measures yes Atrial and
ventricular yes (Bardossy et al, 2013) MIT-BIH and ICD
database Linear measures, Fuzzy logic yes
Combined atrial
and ventricular yes (Acharya et al, 2002) ? Linear measures, ANN and
Fuzzy classifier yes Yes yes (Tsipouras et al, 2004) MIT-BIH knowledge-based
deterministic automaton - Ventricular yes (Tsipouras and
Fotiadis, 2003) MIT-BIH Linear measures, ANN yes Yes yes (Lian et al, 2011) MIT-BIH Linear measures, RdR map yes Ventricular yes (Acharya et al, 2008)
Database from Kasturba Medical
College Hospital, Manipal, India
Linear measures, ANN yes Ventricular yes
(Acharya et al, 2004) MIT-BIH Linear and nonlinear
measures yes Ventricular yes (Yaghouby et al, 2009) MIT-BIH and MVAD
databases
Linear and nonlinear measures, feature reduction
with GDA and MLP-NN
yes Ventricular
trigeminy - (Anuradha and Reddy,
2005-2008) MIT-BIH
Nonlinear measures, Fuzzy
classifier yes Ventricular yes (Kamath, 2012) MIT-BIH Nonlinear measures,
ANCOVA and NN - Ventricular yes (Acharya et al, 2003) MIT-BIH Nonlinear measures, Fuzzy
classifier and ANN yes Ventricular yes (Mohammadzadeh Asl
et al, 2008) MIT-BIH
Linear and nonlinear measures, feature reduction
with GDA and SVM
yes Ventricular yes (Lake and Moorman,
2011) UVa Holter Nonlinear Entropy yes - yes (DeMazumder et al,
2013) ICD database Nonlinear Entropy yes - - This paper UVa Holter
Linear and nonlinear entropy, kNN and logistic
regression
yes Atrial and
ventricular yes
KS=Kolmogorov-Smirnov, ANN=Artificial Neural Network , GDA=Generalized Discriminate Analysis, MLP-NN=Multi Layer Perceptron Neural Network, ANCOVA=Analysis of Covariance, SVM=Support Vector Machine, kNN=k-Nearest Neighbors
31
1.5 Objectives
The first and principal objective of this thesis was to provide an algorithm for the detection and classification of AF even when a very high burden of atrial and ventricular ectopic beats is present, based only on RR intervals time series. We hypothesized that indices related to dynamics of RR series can contribute to a better distinction of SR with ectopy from AF. We tested the hypothesis using three nonlinear indices. The Coefficient of Sample Entropy (COSEn) was designated to quantify the higher entropy characteristics of AF with respect to NSR, and the algorithm was optimized for very short time series (Lake and Moorman, 2011). Local Dynamics score (LDs) is a new index proposed to capture local dynamics of the heart rate, that are related to the baseline variability and to the outliers, such as ectopy (Moss et al, 2014). Detrended Fluctuation Analysis (DFA) is a well-known method to quantify the fractal-like scaling properties of the RR interval times series (Peng et al, 1995).
The second objective was to analyze the mortality risk of the same population, based on COSEn and LDs indices only. We hypothesized that the combination of these two entropy-based dynamical measures could help to shed light on association between cardiac arrhythmias and mortality risk.
The general goal of our work was to contribute to the clinical problem of AF detection and management of outpatients, and secondly to study mortality risk associated to arrhytmias in a large population composed of 2’722 24-hour Holter recordings from ambulatory patients with a follow-up of two years.
32
Chapter 2
Cardiac rhythm classification from RR
intervals
2.1 Introduction
Since the 1980s, the rhythm of heartbeats has been contemplated as the output of a non-linear dynamical system. Mathematical tools of chaos theory and its precedents have been brought to bear on RR interval time series. Subsequently, a rich literature tests the idea that sophisticated numerical analysis of RR interval time series informs on clinical prognosis. The general finding, now clear and simple, is that the physiological variability of sinus rhythm has complex structure that gets lost with age and illness (Goldberger, 1996) (Buchman et al, 2002).
Another utility of dynamical systems analysis is in the detection of cardiac arrhythmia in clinical practice. The simplest and most intuitive application is the detection of AF, which has grossly different dynamics from sinus rhythm. This is important in clinical care, as this diagnosis leads to numerous decisions about stroke prevention with anticoagulation or left atrial appendage exclusion, rate control, cardioversion, ablation, and antiarrhythmic drugs.
Successful numerical methods for this purpose include inspection of Poincarè plots (Sarkar et al, 2008) and entropy estimation, as COSEn (Lake and Moorman, 2011). The latter work showed that RR interval time series in AF had higher entropy as expected. However, there are two challenging situations: atrial flutter, where entropy is low, but all the AF management problems still pertain, and SR with ectopy, both atrial and ventricular, where entropy is high, but not due to AF, and the therapy is different from AF.
33
The hypothesis of this work is that further analyses of the dynamics should allow better distinction of SR with ectopy from AF. The hypothesis was tested using two other dynamical techniques selected for their ability to detect the fundamental feature of SR with ectopy, that is, a baseline of normal variability punctuated by outliers. The first one is the Detrended Fluctuation Analysis (DFA), a well-characterized measure, examines variability from the mean at different time scales, and the second one is the Local dynamics score (LDs), a new index to measure variability and to detect outliers. We tested the proposed algorithms in a new database of 2’722 consecutive Holters from the University of Virginia, and validated them in the canonical MIT-BIH databases (Goldberger et al, 2000). The product – robust numerical recipes for distinguishing among NSR, SR with ectopy, and AF – are widely applicable in clinical practice, and should improve AF management.
2.2 Study population
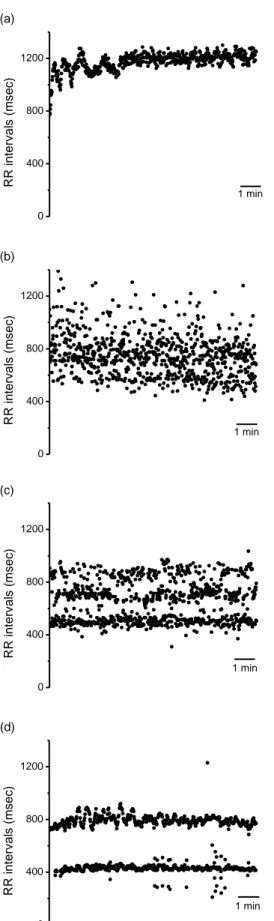
We studied RR interval time series from 24 hour Holter recordings collected from 2’722 consecutive patients at the University of Virginia (UVa) Heart Station from 12/2004 to 10/2010. The age of the patients varied from 0 to 100 years, with an average value of 47±25 years. AF, PAC and PVC labels were obtained from an automatic classifier (Philips Holter Software). The RR series were subdivided into 377’285 10-minute segments. Each 10-minute segment was classified as AF if the burden of AF was greater than 5%, as SR with ectopy if the burden of PAC or PVC was more than 10%, as NSR otherwise. Thus, the dataset is composed of 79% NSR, 8% AF and 13% SR with ectopy segments. The 3 categories are mutually exclusive and reflect clinical practice.