arXiv:1005.4320v3 [cond-mat.supr-con] 9 Sep 2010
Bi
2Sr
2Ca
0.92Y
0.08Cu
2O
8+δby ultrashort laser pulses
G. Coslovich,1, 2 C. Giannetti,3 F. Cilento,1, 2 S. Dal Conte,4 G. Ferrini,3 P. Galinetto,4
M. Greven,5, 6 H. Eisaki,7 M. Raichle,8 R. Liang,8 A. Damascelli,8 and F. Parmigiani1, 9
1Department of Physics, Universit`a degli Studi di Trieste, Trieste I-34127, Italy 2
Laboratorio Nazionale TASC, AREA Science Park, Basovizza Trieste I-34012, Italy 3Department of Physics, Universit`a Cattolica del Sacro Cuore, Brescia I-25121, Italy 4Department of Physics A. Volta, Universit`a degli Studi di Pavia, Pavia I-27100, Italy 5
School of Physics and Astronomy, University of Minnesota, Minneapolis, Minnesota 55455, USA 6Department of Applied Physics, Stanford University, Stanford, California 94305, USA
7Nanoelectronics Research Institute, National Institute of Advanced Industrial Science and Technology, Tsukuba, Ibaraki 305-8568, Japan
8Department of Physics& Astronomy, University of British Columbia, Vancouver, British Columbia V6T 1Z1, Canada 9Sincrotrone Trieste S.C.p.A., Basovizza I-34012, Italy
(Dated: September 10, 2010)
Here we report extensive ultrafast time-resolved reflectivity experiments on overdoped Bi2Sr2Ca1−xYxCu2O8+δ single crystals (TC=78 K) aimed to clarify the nature of the superconducting-to-normal-state photoinduced phase transition. The dynamics of the transient re-flectivity variation is interpreted in the frame of an ad-hoc time-dependent Rothwarf-Taylor model. This analysis shows that the non-equilibrium superconducting gap linearly decreases as the photoin-jected excitation density is increased, while the superconducting phase instability is achieved when the non-equilibrium superconducting gap is about one half of the equilibrium value. The finding is regarded as the direct evidence of a first-order superconducting-to-normal-state phase transition. PACS numbers:
74.40.+k,74.72.Hs,78.47.J-I. INTRODUCTION
The possibility of inducing an electronic first-order phase transition in high-temperature superconductors (HTSC), by means of ultra-short laser pulses, will set a new path for studying the origin of the supercon-ductivity in these materials. In facts, under such non-equilibrium conditions, the homogeneous superconduct-ing phase becomes unstable as its free energy increases during the pulse duration1–3, while the
superconduct-ing order parameter can coexist with the pseudogap or the normal-state. For many years the exploration of the physics of this process has been a difficult task because of experimental limitations, mainly arising from laser in-duced heating of the samples4–7. Only recent all-optical
pump-probe experiments on underdoped and optimally doped HTSC3,8,9 have achieved control of the impulsive
vaporization of the superconducting condensate in the high-intensity regime. This phenomenon has been ob-served as the saturation of the transient reflectivity vari-ation (∆R/R) signal associated with the superconducting phase3,8, in contrast to its linear fluence dependence in
the low intensity regime6,10–14
Nonetheless, the origin of this sub-linear response in the high-excitation regime remains unclear. So far its identification as a non-thermal electronic first-order phase transition1,2has been speculative, based on a
com-parison of the experimental fluence threshold to a sim-ple BCS-model prediction3. A clear picture of the
pho-toinduced non-equilibrium state is still lacking due to in-trinsic difficulties to disentangle pseudogap and
normal-phase signals in optimally and underdoped samples3,9,
the fingerprint of the pseudogap phase being the ∆R/R sign change observed above TC in pump-probe
experi-ments when probing at 800 nm wavelength15.
Here we report pump-probe optical reflectivity mea-surements at 800 nm in the high-excitation regime on an overdoped Bi2Sr2Ca0.92Y0.08Cu2O8+δ(Y-Bi2212)
sin-gle crystal (TC=78 K). At this doping regime the
under-lying normal phase is Fermi-liquid-like16 and no ∆R/R
sign change above TC is measured, at variance with
op-timally and underdoped samples17. These
characteris-tics are fundamental to quantitatively interpret the data within a Rothwarf-Taylor model with time-dependent pa-rameters.
Using this model, we demonstrate the instability of the superconducting state when the non-equilibrium gap reaches ≈50% of its equilibrium value. This is regarded as the clear evidence of a first-order superconducting-to-normal-state photoinduced phase transition, in strik-ing contrast to a thermally-induced 2ndorder transition,
where the superconducting order parameter gradually de-creases with temperature and vanishes at TC.
The present work represents a landmark for the grow-ing field of pump-probe techniques, which have been re-cently extended to the use of several probes, such as Ra-man scattering18, electron-diffraction19, angle-resolved
photo emission20 and broadband optical spectroscopy21.
All these techniques require an intense ultrashort pump laser pulse, ranging from 0.5 to several mJ/cm2(Ref. 20
and 19 respectively), to have reliable results. Our results finally clarify the effect of a pump laser pulse at high
fluence on the superconducting condensate of HTSC. In Sec. II we briefly report the experimental proce-dure. In Sec. III A we study the temperature depen-dence of the signal related to the superconducting phase in the low-excitation regime and we show, within the context of the Rothwarf-Taylor (RT) model22, that the
decay rate is proportional to the superconducting order parameter ∆. In particular, we focus on the decay time divergence in the vicinity of TC, where ∆ → 0 and thus
a vanishing relaxation rate is measured10,11,13,23. In Sec.
III B we discuss the dynamics as a function of fluence at a fixed temperature (10 K) well below TC. Above
a threshold pump fluence, the reflectivity variation devi-ates from the linear dependence and exhibits a saturation in agreement with previous experiments3,8,9. This
dis-continuity is identified with the condensate vaporization in the whole probed volume8. We observe the absence of
a decay time divergence above this threshold point. To relate the non-vanishing relaxation rate to a finite superconducting gap value we discuss the validity of the RT model in the high-fluence regime (Sec. III C). In particular, an extended RT model in the presence of time-dependent parameters is here reported.
In Sec. III D we present the experimental data within the analytical results of the RT model. We obtain a linear decrease of the non-equilibrium gap with pump fluence. We demostrate the first-order character of the photoin-duced phase transition and we compare the experimental results to the predictions of the non-equilibrium super-conductivity µ* model1,2.
II. EXPERIMENTAL METHODS
Pump-probe measurements have been performed on an over-doped Bi2Sr2Ca0.92Y0.08Cu2O8+δ (x=0.08)
sin-gle crystal with TC=78 K ± 5 K. The Y-substituted
Bi2212 single crystal was grown in an image furnace by the traveling-solvent floating-zone technique with a non-zero Y content in order to maximize Tc24. The crystal
was annealed in flowing oxigen in order to increase the hole concentration and reach the overdoped side of the phase diagram. The sample was subsequently homog-enized by further annealing in a sealed quartz ampoule, together with ceramic at the same oxygen content. In our experiments the 800 nm, 120 fs laser pulses are generated by a cavity dumped Ti:sapphire oscillator. The use of a tunable repetition rate laser source allows us to avoid the experimental problem of average heating effects25. These
effects prevented earlier observation of the photoinduced condensate vaporization6,7. In the time-resolved
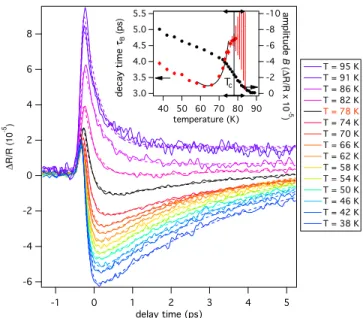
experi-ment the transient reflectivity variation is measured and we denote it as ∆R/R. 8 6 4 2 0 -2 -4 -6 ∆ R/R (10 -5 ) 5 4 3 2 1 0 -1 delay time (ps) T = 95 K T = 91 K T = 86 K T = 82 K T = 78 K T = 74 K T = 70 K T = 66 K T = 62 K T = 58 K T = 54 K T = 50 K T = 46 K T = 42 K T = 38 K -10 -8 -6 -4 -2 0 amplitude B ( ∆ R/R x 10 -5 ) 90 80 70 60 50 40 temperature (K) 5.5 5.0 4.5 4.0 3.5 3.0 decay time τB (ps) Tc
FIG. 1: ∆R/R signal (solid lines) as a function of delay time at different temperatures (from 95 K to 38 K) on Y-Bi2212 overdoped single crystal. The dashed lines are the fits to the experimental curves (see the fitting function in the text). The black line represents the ∆R/R trace at TC. In the inset we report the fit parameters of the SCS, i.e., decay time, τB (red circles), and amplitude, B (black circles). The error bars obtained from the fit procedure are displayed for all the data. The high uncertainty on the decay time above TC led us to plot just the error bar and not the data point. The black arrow on the temperature axis of the inset shows the superconducting transition amplitude of the sample.
III. RESULTS AND DISCUSSION
A. Low-fluence results as a function of temperature In the low-intensity regime several common trends have been recognized based on the large amount of ex-perimental data reported on HTSC: i) the appearence below TCof a ∆R/R signal proportional to the
photoex-cited quasi-particle (QP) density3–14,23, ii) an intensity
and temperature dependent decay time of this supercon-ducting component5,6,9–14,23 iii) the equivalence of the
decay time observed probing at 800 nm and the gap dy-namics observed in the Thz spectral region14.
In Fig. 1 we plot the raw (∆R/R) data of consec-utive series of scans taken from 95 K down to 38 K at low pump fluence (∼4 µJ/cm2). The positive signal
above TC can be reproduced by a single exponential
de-cay function, Ae−t/τA, convoluted with the time shape of the laser pulse, describing the relaxation of hot elec-trons via electron-phonon interaction26–28 with a
relax-ation time τA of about 440 fs. All the traces from room
temperature down to 95 K did not show any substantial difference from the 95 K trace. In agreement with the literature17, no ∆R/R sign change associated with the
wavelength on the overdoped sample, at variance with optimally and underdoped samples15.
The positive and fast signal survives also below TC,
su-perimposed to a negative signal that we recognize as the superconducting signal (SCS) proportional to the pho-toexcited QP density and that we capture with a single exponential function. The sum of these two functions, Ae−t/τA+ Be−t/τB, is sufficient to reproduce all the ex-perimental curves as shown in Fig. 1. The relevant fit parameters of the SCS, i.e., the amplitude B and the decay time τB, are plotted in the inset.
The decay time of the SCS, τB, is shown, as a
func-tion of temperature, in the inset of Fig.1 (red circles). Starting from 38 K the decay time decreases with tem-perature, reaching a minimum at 62 K of 3.3 ps. Above this temperature it rapidly increases reaching the value of 4.7 ps at TC. At this temperature the order parameter
vanishes (∆ → 0), the SCS amplitude, B, is much smaller than A (the normal-state signal), and the uncertainty on the determination of its decay time strongly increases.
The increase in the decay time in the vicinity of TC is
in agreement with previous observations for other HTSC in the low-fluence regime10,11,13,23 and it has been
in-terpreted as the manifestation of a ∝ 1/∆ divergence predicted by several theoretical calculations for BCS superconductors10,29,30. Experimentally, this divergence
is smeared out because of the finite superconducting tran-sition amplitude. However, from the analysis of the SCS decay time increase just below TC, we can extract
quan-titative information about the superconducting gap. A very useful model to interpret the non-equilibrium dynamics of superconductors in the low-intensity regime is the Rothwarf-Taylor model (RT)13,22,31 (See
Ap-pendix). In this model, two QPs recombine to form a Cooper pair emitting a boson with energy larger then 2∆. Since the reverse process has the same probability, the QP and the boson populations are in quasi-equilibrium and the actual relaxation is determined by inelastic pro-cesses. Within this model, one can write down a set of coupled rate equations, which have analytic solutions in two very important limiting cases, the weak and the strong bottleneck regimes13,22. In the first case, the
bo-son inelastic decay rate is fast and the relaxation dynam-ics is equivalent to simple bi-molecular dynamdynam-ics12,14. In
the second regime, namely the strong bottleneck one, the inelastic decay of the boson population strongly slows down the relaxation process. For a given superconduc-tor, the dynamical regime is determined by the partic-ular type of bosons considered in this dynamics. How-ever, in both regimes and far enough from the critical temperature32, a very simple formula for the QP decay
rate γ is valid
γ(T, ∆(nph), nph) = (nph+ nT)Γ(T, ∆(nph)) (1)
where nT are the thermal QPs, nph are the
photo-injected ones and Γ(T, ∆) is a function of the microscopic probabilities for the scattering events involving QPs and
excitation density, n (arb units)
70 60 50 40 temperature (K) 0.6 0.5 0.4 0.3 0.2 0.1 0.0 decay rate γ (ps -1 ) Tc nT nTexp nph γexp Ntot 10-5 2 4 6 8 10-4 2 4 6 8 10-3 γ / T 2 (ps -1 K -2 ) 0.01 2 3 4 5 6 7 0.1 2 3 4 5 6 7 1 reduced temperature (1-T/Tc) ~ (1-T/Tc)1/2 a) b) 12 8 4 0 ∆ (T) (meV) 80 70 60 50 40 30 temperature (K) BCS (d-wave) (1-T/Tc) 1/2
FIG. 2: Panel a) shows the excitation density for both thermal and photoinduced QP, respectively nT and nph (solid lines), and their sum Ntot(dashed line) as a function of temperature. For the thermal QP we assumed Eq. 2 and a d-wave like ∆(T ) dependence and we compared the predicted value with the one obtained through Eq. 3 from the experimental B(T ) amplitude (inset of Fig.1). On the right axis we report the experimental decay rate obtained from the fit in Fig. 1. The b) panel shows γ/T2
as a function of the reduced temperature in a double-logarithmic plot. The long-dashed line represents the (1 − T /TC)1/2 power-law dependence. In the inset we show the result of the numerical integration of the d-wave BCS gap equation as a function of temperature compared to the (1 − T /TC)1/2dependence33. In all the panels the vertical short-dashed divide the low from the high temperature regime (see text). In graph b) the error bars are within the black circles size.
bosons13. Given the QP population densities, n ph and
nT, one can extract from the experimental QP decay
rate γ the Γ(T, ∆) function in the low-excitation limit. We stress that the use of this formula does not imply any assumption on the particular boson involved in the non-equilibrium dynamics.
We use the well-known result obtained by Kabanov et al.10 that, for a d-wave superconductor with a 2D Fermi
surface with nodes and for temperatures kBT << ∆ ∼
5kBTC (Ref. 34), the QP population at thermal
nT = 1.64N (0)(kBT )2/∆ (2)
where N(0) is the density of states at the Fermi level and ∆ is the gap value at equilibrium. The temperature dependence of nT obtained from Eq. (2) is plotted in
Fig. 2a. To validate Eq. (2), we estimate nT from the
temperature dependence of the B amplitude (inset of Fig. 1) through the formula13
B(T ) ∝ 2Nph+ nph p1 + 16n2
T+ 8nT
(3) where Nph is the photoexcited boson population
den-sity and we assume, similarly to Refs. 13,23, the total population density (nph+ 2Nph) to be constant in
tem-perature since the pump fluence is constant. The B(T ) amplitude in the low-temperature limit is measured at T = 10 K. Good agreement is found between nT predicted
by Eq. (2) and the value obtained from the experimental data through Eq. (3) (Fig. 2a). Thus in the following we will use the value of nT calculated through Eq. (2).
In Fig. 2a the experimental SCS decay rate γ and the total QP density, Ntot=nph+nT, are compared. The
con-tribution due to nph is estimated in the low-temperature
limit35.
In the high-temperature limit we observe that: i) the thermal population nT is dominating on nph; ii) γexp is
not following the Ntot temperature dependence. This
finding suggests that the decay time increase observed close to TC is related to a decrease of Γ(T, ∆). We set
the separation between the high- and low-temperature regimes at 60 K, i.e, when nT > nph. Our conclusions are
independent of the particular choice of this temperature. We now verify that the increase in decay time when approaching TC is related to a real divergence arising
from the fact that Γ(T, ∆) → 0 when ∆ → 0 and we find the power-law that controls this divergence. In Fig. 2b, we plot the quantity γexp/T2as a function of the reduced
temperature (distance from the critical temperature) on a double-logarithmic scale. Using Eqs. (1) and (2), we find that this quantity is proportional to
γ T2 ∝
Γ(T, ∆)
∆ (4)
in the temperature region where nT is the dominant
term in the QP density, i.e., above 60 K.
In this region, we notice a power-law dependence with an exponent of 1/2 (solid line in Fig. 2b),
Γ(T, ∆)
∆ ∝(1 − T /TC)
1/2 (5)
which is the same mean-field critical exponent ex-pected for the order parameter ∆ in a BCS superconduc-tor. In a d-wave superconductor with TC of 78 K, the
superconducting gap dependence is well approximated by ∆ ∝ (1 − T /TC)1/2, in the temperature range from
60 to 78 K (see the inset in Fig. 2b). This assumption is still a good approximation in the case of overdoped HTSC36–38. A deviation from this exponent is found a
few degrees below TC, since Eq. (1) is not applicable in
the close vicinity of TC32.
Within the approximate analytic solution (Eq. (1))32,
we can easily derive the power-law dependence of the Γ(T, ∆) function in the RT approach :
Γ(T, ∆) ∝ (1 − T /TC) ∝ ∆2 (6)
This power-law dependence can hardly be derived by first-principles, particularly if the nature of boson in-volved in the pairing mechanism is unknown.
B. Discontinuity in the fluence dependence In Fig. 3a and 3b, we report the ∆R/R traces at 10 K obtained at increasing pump intensity. Similarly to Sec. III A, all the curves were fitted using two exponential functions convoluted with the time shape of the laser pulse. The results of the fit are superimposed to the experimental curves. Fig. 3c shows the SCS amplitude and decay time for each fit as a function of pump fluence. The low-excitation regime, i.e., the regime where the SCS is proportional to the pump fluence is reported in Fig. 3a and in Fig. 3c below 26 µJ/cm2 ≡ Φ
C. In
agreement with previous works3–14,23, we assume that
the SCS is proportional to the photoinduced QP density, nph. Thus we conclude that nph increases linearly with
the pump fluence in this regime. In the zero-fluence limit, where nph → 0, we observe a divergence of the decay
time (Fig. 3c). This is related to Eq. (1), as the total QP density, (nph+nT), become extremely small at low
fluence and at low temperature (10 K).
Above ΦC the SCS has a sub-linear dependence and
we identify this regime as the high-excitation regime3,8
(Fig. 3b and Fig. 3c for Φ > ΦC). In this regime,
the SCS exhibits a saturation at a critical fluence, Φcr,
of ∼55 µJ/cm2. This saturation means that no more
Cooper pairs can be destroyied above Φcr and it is
con-sidered as the evidence of the superconducting conden-sate vaporization during the laser pump pulse3,8. The
fact that the crossover between the linear and the satu-rated regime does not show an abrupt discontinuity here can be justified by the spatial profiles of the pump and probe light pulses8. The occurence of a real
photoin-duced phase transition in this regime has been proved by measuring the emergence of a fast component above Φcr in underdoped Bi2212 single crystals3. Similarly we
observe in Fig. 3b an enhancement of the positive signal A associated with the fast e-ph free carriers relaxation.
We can compare the SCS in the case of the photoin-duced (Fig. 3c) and the thermally inphotoin-duced phase transi-tion (inset of Fig. 1). In the former case, the parameter
setting the level of perturbation of the system is the pump fluence, while in the latter case this role is played by the sample temperature. Within this analogy, the critical fluence Φcr, at which the SCS exhibits the saturation, is
the counterpart of critical temperature, TC.
The origin of the photoinduced phase transition re-mains unclear, as it might be the experimental realiza-tion of either a first-order non-thermal phase transirealiza-tion, as predicted by the µ* non-equilibrium superconductivity model1,2, or a quasi-thermal second order phase
transi-tion (T* model)2,39.
In analogy to the thermal case (studied in Sec. III A), the quasi-thermal photoinduced vaporization would cause the superconducting order parameter to van-ish at Φcr. Thus a diverging decay time should be
mea-sured, according to Eq. (6) and Eq. (4). On the contrary, the experimental results here reported show a decay time that remains finite and below 3.2 ps, thus suggesting a finite gap at the threshold fluence as in the case of a non-thermal first-order phase transition1,2.
However, the connection between the decay time of the
-2.0 -1.5 -1.0 -0.5 0.0 0.5 ∆ R/R (10 -4 ) 1.0 µJ/cm2 1.9 µJ/cm2 3.1 µJ/cm2 3.9 µJ/cm2 4.9 µJ/cm2 6.3 µJ/cm2 7.8 µJ/cm2 9.5 µJ/cm2 11 µJ/cm2 15 µJ/cm2 18 µJ/cm2 22 µJ/cm2 26 µJ/cm2 2 1 0 -1 -2 ∆ R/R (10 -4 ) 5 4 3 2 1 0 -1 delay (picoseconds) 77 µJ/cm2 67 µJ/cm2 59 µJ/cm2 48 µJ/cm2 45 µJ/cm2 40 µJ/cm2 37 µJ/cm2 33 µJ/cm2 29 µJ/cm2 10 8 6 4 2 decay time τB (ps) 80 60 40 20 0 pump fluence (µJ/cm2) 3.0 2.5 2.0 1.5 1.0 0.5 0.0 amplitude B ( ∆ R/R x10 -4 ) ΦC Φcr a) b) c) T=10 K
FIG. 3: ∆R/R signal, solid lines in panel a) and b), at 10 K at different pump fluences. The fit to the experimental curves are shown with dashed lines. The fit parameters (decay time τB and amplitude B) are reported in panel c) as a function of pump fluence. In panel a) the low-intensity regime is shown, corresponding to Φ < ΦC in panel c). The short-dashed line in panel c) is the linear fit in the low-fluence regime. The panel b) and the panel c) for Φ > ΦCcorrespond to the high-excitation regime. The long-dashed line in panel c) represent the saturation value. The error bars In panel c) are within the circles size.
2 3 4 5 6 7 8 9 1 2 |∆ R/R| (10 -4 ) 5 4 3 2 1 0 delay time (ps) 77 µJ/cm2 67 µJ/cm2 59 µJ/cm2 48 µJ/cm2 37 µJ/cm2 29 µJ/cm2 18 µJ/cm2 7.8 µJ/cm2
FIG. 4: We report the |∆R/R| traces in logarithmic scale at several pump fluences at T = 10 K, where the exponential A component has been subtracted. The dashed lines represent the exponential fit of the decay. The solid line refers to the curve at Φ = 77µJ/cm2
.
SCS and the superconducting gap is firmly established only in the low-fluence regime within the analytical re-sults of the the RT model13 (Sec. III A, Eq. (6)). To
extend this concept to the high-fluence regime, when the non-equilibrium superconducting gap ∆(t) could strongly vary in time, a validation of the RT model is necessary.
Before we discuss this point in Sec. III C, we report three important experimental facts about the dynamics of the SCS (See Fig.4),
a) for Φ > ΦC the rise time of the SCS increases from
∼150 fs up to ∼ 1.5 ps.
The observed rise time increase is in strong disagree-ment with the prediction of the RT model8,13, where it
should instead decrease at higher pump fluences, thus suggesting a different origin of the SCS rise dynamics
b) the relaxation dynamics is well reproduced by expo-nential decays (dashed lines) in the high-fluence regime, as in the low-fluence regime. This decay is compatible with the RT model, where the gap is assumed to be con-stant in time, thus suggesting that the variations of ∆(t) are small
c) for Φ > Φcr, the decay dynamics collapse into a
sin-gle curve, indicating that the non-equilibrium gap ∆(t) reaches its minimum value at Φcr, remaining the same at
higher fluences
To quantitatively explain these results we consider a time-dependent RT model and the occurrence of a dy-namical first-order phase transition.
C. Rothwarf-Taylor model in the high fluence regime: a time-dependent approach
When a superconducting system is strongly perturbed through an ultra-short laser pulse, we expect the super-conducting order parameter ∆ to have strong variations in time. The parameters β, η and γesc of the RT model
(see Appendix for definitions) are affected by these vari-ations (Refs. 10,40) and can vary in time. Therefore the high-perturbation limit requires a new time-dependent Rothwarf-Taylor model. Herewith below we use the fol-lowing assumptions,
i) the time-dependent non-equilibrium superconduct-ing gap ∆(n(t)) can be expressed as a function of n(t) considering the T* and µ* models1,2,39. In both cases the
normalized ∆(n(t)) depends on (1-an(t)) (being n(t) the QP density and a a conversion factor) for an s-wave gap symmetry and (1-an(t)3/2) for a d-wave gap symmetry.
ii) β(∆(n(t))) is constant, being its temperature de-pendence very weak, as reported on YBCO12
iii) η(∆(n(t))) is determined with a fit of the rise time at low fluence (See Appendix) and is set to a constant. This is a justified by the weak temperature dependence of the pair-breaking time8,13observed in pump-probe
ex-periments at low fluence12,15 (see Sec. III A)
iv) γesc(∆(n(t)) is the only time-dependent parameter
and is responsible for the gap-dependence of Γ(T, ∆), ev-idenced in Sec. III A (Eq. 6). The value corresponding to the unpertubed gap, γesc(0), can be determined by
a fit of the experimental decay at low fluence using the time-indepedent RT model. (See Appendix)
v) following a well-established trend in the
literature7,8,13,41 we assume that the cuprates are
in the strong-bottleneck regime. We can thus conclude that Γ ∝ γesc (Ref. 13).
Under these approximations, the time-dependent RT equations are:
˙n = IQP(t) + 2ηp − βn2 (7)
˙p = Iph(t) − ηp + βn2/2 − γesc(t) · (p − pT) (8)
with
γesc(t) = γesc(0) · (∆(n(t))/∆(0))2 (9)
where for an s-wave gap symmetry we have:
γesc(t) = γesc(0) · (1 − an(t))2 (10)
and for a d-wave gap symmetry:
γesc(t) = γesc(0) · (1 − an(t)3/2)2 (11)
with a being a conversion factor which set the pertur-bation of the non-equilibrium gap by QPs. The time-dependent RT equations (Eqs. (7) and (8)) are then
2 3 4 5 6 7 8 9 1 2 3 ∆ R/R (10 -4 ) 3 4 5 6 7 8 9 1 2 3 4 5 6 7 8 910 2 3 delay time (ps) 26 µJ/cm2 data time-dep. RT model strongly pertubed gap time-indep. RT model 2.0 1.5 1.0 0.5 0.0 γesc 1/2 (ps -1/2 ) 1.2 1.0 0.8 0.6 0.4 0.2 0.0 gap (normalized) 81 2 4 6 810 2 delay time (ps) FIG. 5: |∆R/R| of the SCS at Φ = 26 µ J/cm2
and the corre-sponding fit (solid line) obtained with the numerical solutions of the time-dependent Rothwarf-Taylor equations (Eqs. (7) and (8)) considering a d-wave gap symmetry. The a opti-mal value is (1.0±0.2)×10−20 cm3. For comparison we also show the fits when the parameter a is fixed to the values a = 2.45×10⁻²⁰ cm3 (short-dashed) and a = 0 (long-dashed), which is equivalent to the time-independent RT model. In the inset we show the corresponding functionpγesc(t), which is proportional to the non-equilibrium superconducting gap ∆(t) (Eq. 9). We normalized the gap to the low-fluence value (See appendix).
integrated numerically and used to fit the experimental curves of the SCS.
In Fig. 5 we report the results relevant to a single ex-perimental curve at Φ = ΦC and T = 10 K, where we
assume a d-wave gap symmetry (Eq. (11)). The deter-mined a parameter is (1.0±0.2)×10−20 cm3. The
agree-ment with the experiagree-mental data is very good. The pre-dicted normalized non-equilibrium gap, ∆(t) ∝pγesc(t),
shows a minimum of 60% at the maximum SCS and an almost complete gap relaxation (85%) after a time de-lay of 5 ps. Similar results are obtained considering an s-wave gap symmetry (Eq. (10)).
For comparison, we report also two fits where a is held constant with values a = 0, equivalent to the time-independent RT model, and a = 2.45×10⁻²⁰cm3, where
the gap is suppressed by ≈ 95%. In the latter case the predicted relaxation dynamics is extremely slow (of the order of several tens of picoseconds) and strongly non-exponential. Both these characteristics are not compat-ible with any of the experimental curve reported in Fig. 4, thus ruling out the possibility that, at any time instant t and at any pump fluence Φ reported in this work, the non-equilibrium gap can be close to zero (≈ 5%).
In turn, this result excludes the complete closing of the superconducting gap expected in the case of a second-order quasi-thermal phase transition and strongly indi-cates a finite superconducting non-equilibrium gap. It is possibile to estimate a lower bound for this finite non-equilibrium gap, considering the optimal a parameter and extracting ∆(n(t))min from the maximum SCS for each
curve in Fig. 4. The result is that at any time instant t, the condition ∆(t) > 1
2∆(0) is realized.
D. First-order superconducting-to-normal dynamical phase transition
Although the time-dependent RT model discussed in the previous section provides a remarkably good descrip-tion of the experimental data, we observe that the time-independent RT model is also a valid approximation, pro-vided an average gap value (corresponding to the value predicted by the time-dependent approach at 1-2 ps de-lay) is assumed.
In particular we demonstrated that in our experimen-tal conditions we have ∆(nph, 10K) > 12∆(0, 10K), thus
we can estimate the maximum density of photoexcited QP, nph < nT =70K << η/β (according to the inset of
Fig. 2b and Ref. 2). This condition insures the validity
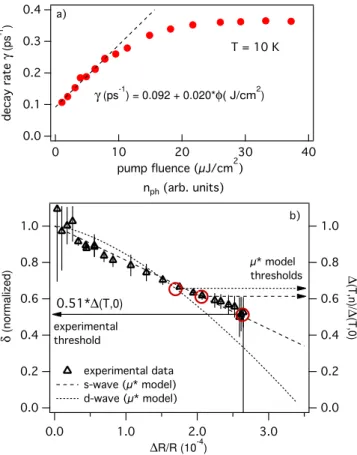
of the analytical formulas obtained in Sec. III A. We recall Eq. (1) and, plotting the decay rate as a function of pump fluence (Fig. 6a), we observe the ex-pected linear dependence at low fluence. The intercept of 0.092 ps−1 is related to the finite value of nT at T =
10 K. This linear dependence on the pump fluence fol-lows the trend observed on underdoped HTSC6,12, but
was not observed clearly on overdoped samples6,42. We
define an effective photoinduced decay rate, γph,
γph(T, ∆(nph), nph) ≡ γ(T, ∆(nph), nph)
−γT(T, ∆(0), nph= 0) (12) that represents the decay rate exclusively due to the photoinjected QPs, where the thermal contribution to the decay rate, γT, (intercept in Fig. 6a) has been
sub-stracted. We neglect the sample temperature dependence since in our pump-probe experiment this parameter re-mains constant. We thus obtain the formula
γph(∆(nph), nph) = nphΓ(∆(nph)) + nT[Γ(∆(nph)) − Γ(∆(0))] ≈ nphΓ(∆(nph)) (13)
In the right-hand side of Eq. 13 we neglected the sec-ond term of the sum. This approximation is valid in the high-excitation regime when nphis much larger than nT,
as long as Γ is not going to zero, which is suggested by the absence of a decay time divergence.
Using Eq. (6) and the proportionality between nphand
∆R/R we can rewrite Eq. (13) as
γph=
∆R
R ∆
2
(14) from which we obtain:
r γ
ph
∆R/R∝∆ (15)
We thus define the quantity δ ≡q γph
∆R/R, proportional
to the non-equilibrium superconducting gap, ∆.
In Fig. 6b we report the value of this quantity, nor-malized to the zero fluence limit value, obtained from the experimental curves of Fig. 3 as a function of the SCS amplitude. The gap value decreases with ∆R/R, hence it decreases with increasing nph, as expected1,2,39. On the
other side, above the experimental threshold, where nph
is constant, the non-equilibrium gap remains constant, reflecting the correctness of neglecting the T dependence in ∆(nph, T ) and γph(T, ∆, nph).
The experimental data are here compared to the pre-dictions of the µ* model, where a first-order phase
transition is expected1–3. Within this model the
non-equilibrium QP population is described by a Fermi-Dirac distribution with an effective chemical potential µ*, while its temperature remains at the equilibrium value T. In Fig. 6b we plot the analytical results for ∆(n, T = 0)/∆(n = 0, T = 0) in the low-excitation limit as a function of the QP density n for both s-wave and d-wave gap symmetry2. The dependence in the d-wave
case is ∝ n3/2, while it is linear in the s-wave case, as
reported in the previous section.
The µ* model predicts a superconducting-to-normal-state phase transition at a finite gap value, when the superconducting-state free energy increases above the normal-state value. At 10 K this phase transition should take place at a relative gap value of ≈60% and ≈65% in the s-wave and d-wave case, respectively2(Fig.6b)
The main features evidenced by the experimental data reported in Fig. 6 are: i) a finite value of ∆(nmax, T =
10 K) of about 1/2 of the equilibrium value at the fluence threshold, ii) the linear dependence of ∆(nph, T = 10 K)
with ∆R/R and thus with nph.
The result i) self-consistently confirms our initial assumption of a non-vanishing Γ function and of ∆(nph, 10K) > 12∆(0, 10K). The experimental value
ob-tained in this work is remarkably close to the µ* model predictions, even if a quantitative comparison would re-quire a detailed analysis of the photoinduced QP distri-bution and accurate numerical calculations in the high-fluence regime2,3.
The result ii) suggests an s-wave like dependence of the non-equilibrium gap. Even if this finding seems in
contradiction with the equilibrium gap d-wave symme-try reported for HTSC43, one should bear in mind the
fact that the non-equilibrium population photoinduced by a 100 fs laser pulse is uniformly distributed in the k-space12. This leads to a non-thermal effective
distribu-tion that can be reproduced by a Fermi-Dirac statistic with anisotropic effective chemical potential.
The results of such anistropic model are equivalent to those obtained for an wave superconductor. An s-wave like gap symmetry was previously used to explain the temperature dependence of nph in the low-excitation
regime of HTSC10 and led to a strong controversy in the
pump-probe experiments interpretation2,10. We remark
that this result does not imply an s-wave gap symmetry
1.0 0.8 0.6 0.4 0.2 0.0 δ (normalized) 3.0 2.0 1.0 0.0 ∆R/R (10-4) 1.0 0.8 0.6 0.4 0.2 0.0 ∆ (T,n)/ ∆ (T,0) nph (arb. units) 0.51*∆(T,0) experimental data s-wave (µ* model) d-wave (µ* model) experimental threshold µ* model thresholds 0.4 0.3 0.2 0.1 0.0 decay rate γ (ps -1 ) 40 30 20 10 0 pump fluence (µJ/cm2) γ (ps-1) = 0.092 + 0.020*φ( J/cm2) T = 10 K a) b)
FIG. 6: a) Experimental decay rate extracted by the fit of the ∆R/R traces at different pump fluences (see Fig. 3). The dashed line is the linear fit obtained in the low-intensity limit. The error bars are within the circles size. b) We report δ as a function of ∆R/R. We normalized the value to the zero flu-ence limit, which correspond to the equilibrium gap ∆(T, 0). The error bars indicate the difference between the results ob-tained starting from the analytic solution of the RT equations (Eq. (1)) and the numerical one (see text). On the same graph (right and upper axis) we show the analytical results of the µ* model for the superconducting gap, ∆, as a function of QP density n as reported in Ref. 2 for both s-wave and d-wave cases. The threshold values are calculated numerically within the µ* model2
at a finite temperature corresponding to 10 K in our experiment.
in HTSC at equilibrium and it is rather related to the excitation process.
Both these results suggest a strongly non-thermal QP population behind the observed dynamics. The photoin-duced discontinuity observed in several HTSC3,8,9 can
be thus interpreted as the manifestation of a first-order non-thermal phase transition predicted by the µ* model occurring when the gap value has reached about 60% of the equilibrium value.
The dynamics of such first-order phase transition as discussed in Ref. 3, in analogy to the coalescence dy-namics of a supersaturated solution44, reflects a
dynam-ical inhomogeneity in the probed area, where normal-state metastable domains compete with the surrounding superconducting state. This coalescence model can satis-factorily explain the experimental results reported in Sec. III B, i.e., (a) the SCS rise time increase observed above ΦC (Fig. 4a) alongside the deviation from its linear
flu-ence response (Fig. 3c), (b) the enhanced exponential A component (Fig. 3b) and (c) the universal SCS relax-ation at high-fluence (Φ > Φcr) (Fig. 4).
Within this model, ΦC represent the fluence above
which the formation of normal-state domains begins and Φcris reached when the full probed volume has transited
to the normal-state during the pulse duration.
The homogenous superconducting phase reconstruc-tion has a dynamics in the picoseconds timescale3, which
causes an increasing rise time of the SCS above ΦC (a).
At high-fluence (Φ > Φcr) the energy in excess to the
critical value is absorbed by normal-state regions where excitations relax rapidly via e-ph interaction, thus ex-plaining both (b) and (c).
The results reported in this manuscript are obtained assuming the validity of Eq. (1), which is an approx-imated analytic solution of the time-independent RT equations32. We repeated the same procedure starting
from the numerical solution of the time-indepedent RT equations, which is valid in the whole temperature and fluence range. However the final results of our work are unaffected. The error bars in Fig. 6b account for the deviation of the analytic results from the numerical one.
IV. CONCLUSION
We reported pump-probe experiments on an overdoped Y-Bi2212 sample at 800 nm. We explored both the low-and the high-excitation regimes to clarify the origin of the recently discovered photoinduced vaporization of the superconducting condensate3,8. The absence of a signal
related to the pseudogap phase in this overdoped sample led to a clearer interpretation of this phenomenon. We first verified the exponent of the power-law divergence at low-excitation in the vicinity of TC. Simply
assum-ing this power-law divergence and no particular bosonic mechanism, we estimated the non-equilibrium order pa-rameter (∆) in the high-excitation limit. We found a finite gap value of about 1/2 of the equilibrium gap at
the critical fluence at which the photoinduced vaporiza-tion occurs (Φcr ≈55 µJ/cm2). This result is a strong
indication that the observed photoinduced phase transi-tion has the non-equilibrium 1storder character expected
in the µ* model1–3. Numerical solutions of an extended
time-dependent Rothwarf-Taylor model confirmed these results.
This opens interesting perspectives for the study of superconductors in general. A non-equilibrium first-order phase transition implies a dynamical competition between coexisting superconducting and normal state phases3,44. We expect this dynamics to be
experimen-tally accessible with pump-probe techniques in the fem-tosecond time domain. The perspective is even more in-triguing if one extends this approach to underdoped sam-ples, where the dynamical competition would involve the pseudogap phase as well.
These findings clarify the fundamental interaction of an infrared coherent pulse with the superconducting condensate in HTSC at high excitation pump inten-sity. This is a landmark for the growing field of pump-probe techniques on HTSC3,8,9,18–21,23,45. Our
exper-iment defines the maximum pump fluence (Φcr ≈ 55
µJ/cm2) which still allows to probe the
superconduct-ing state of Y-Bi2212; it also demostrates that recent pump-probe experiments perfomed on Bi2212 at higher pump fluences18–20are dealing with a dynamical
compet-ing admixture of superconductcompet-ing, normal and possibly pseudogap phases.
Acknowledgments
F.C., G.C., and F.P. acknowledge the support of the Italian Ministry of University and Research under Grant
Nos. FIRBRBAP045JF2 and FIRB-RBAP06AWK3.
The crystal growth work at Stanford University was
supported by DOE under Contracts No.
DE-FG03-99ER45773 and No. DE-AC03-76SF00515 and by NSF under Grant No. DMR9985067.The work at UBC was supported by the Killam Program (A.D.), the Alfred P. Sloan Foundation (A.D.), the CRC Program (A.D.), NSERC, CFI, CIFAR Quantum Materials, and BCSI.
Appendix: Rothwarf-Taylor equations
The non-equilibrium dynamics in superconductors is usually successfully interpreted12,13 within the
phe-nomenological frame of the Rothwarf-Taylor equations22,
˙n = IQP(t) + 2ηp − βn2 (A.1)
˙p = Iph(t) − ηp + βn2/2 − γesc(p − pT) (A.2)
describing the density of excitations n coupled to phonons, p being the gap-energy phonon density. The non-equilibrium QP and phonons are photo-injected in the system through the IQP(t) and Iph(t) terms. A
gaussian temporal profile of IQP(t) and Iph(t), with the
same time-width as the laser pulse, is assumed. The coupling of the electronic and phonon population is ob-tained through a) the annihilation of a Cooper pair via gap phonon absorption (pη term) and b) the emission of gap phonons during the two-body direct recombina-tion of excitarecombina-tions to form a Cooper pair (βn2 term).
In the phonon bottleneck regime (η>γesc) the excitation
relaxation is ultimately regulated by the escape rate of the non-equilibrium gap-energy phonons (γesc(p − pT)
term, pT being the thermal phonon density). The γesc
value is determined both by the escape rate of the non-equilibrium phonons from the probed region and by the energy relaxation through inelastic scattering with the thermal phonons. The ∆R/R superconducting signal (SCS) is assumed to be proportional to the solution n(t) of Eq.(A.1), in agreement with previous works3–14,23. At
low fluence (Φ < ΦC), the SCS reported in Fig. 4 is
satis-factorily reproduced by considering only the Iph(t) term,
i.e. assuming that the pump energy is mainly absorbed through excitation of the phonon population. This re-sult is in agreement with both theoretical predictions within the T* model2 and experimental observations on
YBCO46,47 and MgB
231. In the fitting procedure we
assume β = 0.1cm2/s, as reported in the literature12.
The determined free parameters at low fluence (Φ = 1 µJ/cm2) are γ = (4.5±0.5) ps−1 and γ
esc=(3.3±0.1)
ps−1. These value are compatible with both the results
obtained on LSCO8 and the theoretical estimations of
anharmonic processes in YBCO10.
1 C. Owen and D. Scalapino, Phys. Rev. Lett. 28, 1559 (1972).
2
E. Nicol and J. Carbotte, Phys. Rev. B 67, 214506 (2003). 3 C. Giannetti, G. Coslovich, F. Cilento, G. Ferrini, H. Eisaki, N. Kaneko, M. Greven, and F. Parmigiani, Phys. Rev. B 79, 224502 (2009).
4 P. Gay, D. Smith, C. Stevens, C. Chen, G. Yang, S. Abell, D. Wang, J. Wang, Z. Ren, and J. Ryan, J. Low Temp. Phys. 117, 1025 (1999).
5 P. Gay, C. Stevens, D. Smith, C. Chen, and J. Ryan, Phys-ica C 341, 2221 (2000).
6
95, 117005 (2005). 7
G. Coslovich et al., AIP proceedings 1162, 177 (2009). 8 P. Kusar, V. Kabanov, J. Demsar, T. Mertelj, S. Sugai,
and D. Mihailovic, Phys. Rev. Lett. 101, 227001 (2008). 9
T. Mertelj, V. Kabanov, C. Gadermaier, N. Zhigadlo, S. Katrych, J. Karpinski, and D. Mihailovic, Phys. Rev. Lett. 102, 117002 (2009).
10
V. Kabanov, J. Demsar, B. Podobnik, and D. Mihailovic, Phys. Rev. B 59, 1497 (1999).
11 D. Dvorsek, V. Kabanov, J. Demsar, S. Kazakov, J. Karpinski, and D. Mihailovic, Phys. Rev. B 66, 0205100 (2002).
12 N. Gedik, P. Blake, R. Spitzer, J. Orenstein, R. Liang, D. Bonn, and W. Hardy, Phys. Rev. B 70, 014504 (2004). 13
V. Kabanov, D. Mihailovic, and J. Demsar, Phys. Rev. Lett. 95, 147002 (2005).
14
R. A. Kaindl, M. A. Carnahan, and D. S. Chemla, Phys. Rev. B 72, 060510 (2005).
15 Y. H. Liu et al., Phys. Rev. Lett. 101, 137003 (2008). 16
P. A. Lee, N. Nagaosa, and X. Wen, Rev. Mod. Phys. 78, 17 (2006), and references therein.
17
J. Demsar, B. Podobnik, V. Kabanov, T. Wolf, and D. Mi-hailovic, Phys. Rev. Lett. 82, 4918 (1999).
18
R. Saichu, I. Mahns, A. Goos, S. Binder, P. May, S. Singer, B. Schulz, A. Rusydi, J. Unterhinninghofen, D. Manske, et al., Phys. Rev. Lett. 102, 177004 (2009).
19
F. Carbone, D. Yanga, E. Giannini, and A. H. Zewail, Pro-ceedings of the National Academy of Sciences 105, 20161 (2008).
20
L. Perfetti, P. Loukakos, M. Lisowski, U. Bovensiepen, H. Eisaki, and M. Wolf, Phys. Rev. Lett. 99, 197001 (2007).
21
C. Giannetti et al., Phys. Rev. B 80, 235129 (2009). 22
A. Rothwarf and B. Taylor, Phys. Rev. Lett. 19, 27 (1967). 23 E. E. M. Chia, D. Talbayev, J.-X. Zhu, H. Q. Yuan, T. Park, J. D. Thompson, C. Panagopoulos, G. F. Chen, J. L. Luo, N. L. Wang, et al., Phys. Rev. Lett. 104, 027003 (2010).
24 H. Eisaki, N. Kaneko, D. L. Feng, A. Damascelli, P. K. Mang, K. M. Shen, Z. Shen, and M. Greven, Phys. Rev. B 69, 064512 (2004).
25 High pump fluence measurements were perfomed at a rep-etition rate of 108 kHz or less, while low pump fluence ones were obtained at a repetition rate of 540 kHz to max-imize the signal-to-noise ratio. The total photon intensity impinging the sample was never higher than 350 µW. 26
P. B. Allen, Phys. Rev. Lett. 59, 1460 (1987).
27
S. Brorson et al., Phys. Rev. Lett. 64, 2172 (1990). 28
S. Brorson et al., Solid State Commun. 74, 1305 (1990). 29 M. Tinkham and J. Clarke, Phys. Rev. Lett. 28, 1366
(1972). 30
A. Schmidt and G. Schon, J. Low Temp. Phys. 20, 207 (1975).
31
J. Demsar et al., Phys. Rev. Lett. 91, 267002 (2006). 32
Eq. (1) is valid as long as nT << NT, where NT is the boson population density at equilibrium. The limit nT ∼ NT is achieved only in the close vicinity of TC (see Ref. 13 ). Fig. 2a clearly shows that nT decreases rapidly below TC, setting the condition nT << NT. Thus we assume Eq. (1) to be valid few degrees below TC.
33
M. Tinkham, Introduction to Superconductivity (McGraw-Hill, Inc., 1996).
34 S. Hufner, M. A. Hossain, A. Damascelli, and G. A. Sawatzky, Rep. Prog. Phys. 71, 062501 (2008).
35
To obtain the value of the constant nph contribution to the decay rate we use the experimental values of γ at 38 K (Fig. 2)a and at 10 K, ∼ 4 µJ/cm2
(Fig. 6a). We assume Γ(T, ∆) to be constant below 40 K (inset of Fig. 2b) and nT(10K) = 0. Thus we have γ(38K) = Γ0∗ (nT+ nph) and γ(10K) ∼ Γ0∗ (nph), from which we derive both Γ0 and nph.
36
W. S. Lee, I. M. Vishik, K. Tanaka, D. H. Lu, T. Sasagawa, N. Nagaosa, T. P. Devereaux, Z. Hussain, and Z. Shen, Nature 450, 81 (2007).
37
S. Hufner and F. Muller, Phys. Rev. B 78, 014521 (2008). 38 A. Yazdani, J. Phys.: Condens. Matt. 21, 164214 (2009). 39
W. Parker, Phys. Rev. B 12, 3667 (1975). 40
J. Unterhinninghofen, D. Manske, and A. Knorr, Phys. Rev. B 77, 180509 (2008).
41
N. Cao, Y. Wei, J. Zhao, S. Zhao, Q. Yang, Z. Zhang, and P. Fu, Chin. Phys. Lett. 25, 2257 (2008).
42 The slope obtained in this work in the range form 1 to 10 µJ/cm2
is 0.02 ps−1/µJ/cm2, which is compatible, within the experimental uncertainty, with the substantially con-stant decay rate measured by Gedik et al.6 in the range from 0.1 to 1 µJ/cm2.
43
W. Hardy, D. Bonn, D. Morgan, R. Liang, and K. Zhang, Phys. Rev. Lett. 70, 3999 (1993).
44 E. M. Lifshitz and L. P. Pitaevskii, Physical Kinetics (Butterworth-Heinemann, Oxford, 1981).
45
F. Cilento et al., Appl. Phys. Lett. 96, 021102 (2010). 46 S. Han et al., PRL 65, 2708 (1990).
47