Sara
UNIVERSITÀ DEGLI STUDI DI SASSARI
University of Sassari
Department of Biomedical SciencesInternational PhD School in Biomolecular and Biotechnological Sciences
Section: Clinical Biochemistry and Clinical ProteomicsDirector: Prof. Leonardo A. Sechi
CYCLE XXVII
Proteomic analysis of human plasma and
peripheral blood mononuclear cells in
Systemic Lupus Erythematosus patients
Tutor:
Prof. Ciriaco Carru
Co-Tutor:
PhD candidate:
Prof. Luca Deiana
Dr. Sara Pinna
Sara Pinna
Proteomic analysis of human plasma and Peripheral Blood Mononuclear Cells in Systemic Lupus Erythematosus patients
International PhD School in Biomolecular and Biotechnological Sciences-University of Sassari
i
Table of contents
TABLE OF CONTENTS I
LIST OF TABLES II
LIST OF FIGURES II
LIST OF ABBREVIATIONS III
INTRODUCTION 1
AUTOIMMUNE DISEASE 2
SYSTEMIC LUPUS ERYTHEMATOSUS 4
OBJECTIVES 14
METHODS 16
PATIENTS 17
PLASMA SAMPLES 17
REMOVAL OF THE HIGH-ABUNDANCE PROTEINS FROM PLASMA SAMPLES 18
PBMCS SAMPLES 19
TWO DIMENSIONAL SDSPAGE 20
WESTERN BLOT 24
MASS SPECTROMETRY AND PROTEIN IDENTIFICATION 25
ELISA 26
CYTOKINE QUANTIFICATION 26
STATISTICAL ANALYSIS 29
RESULTS 31
2D-PAGE COMPARISONS 32
PROTEINS IDENTIFICATION BY MASS SPECTROMETRY 34
WESTERN BLOT ANALYSIS 42
ELISA 43
CYTOKINES ANALYSIS 44
DISCUSSION 53
CONCLUSIONS 64
Sara Pinna
Proteomic analysis of human plasma and Peripheral Blood Mononuclear Cells in Systemic Lupus Erythematosus patients
International PhD School in Biomolecular and Biotechnological Sciences-University of Sassari
ii
List of tables
Table 1 ... 9 Table 2 ... 36 Table 3 ... 39 Table 4 ... 40 Table 5 ... 41 Table 6 ... 43 Table 7 ... 44 Table 8 ... 47 Table 9 ... 51 Table 10 ... 51 Table 11 ... 52 Table 12 ... 52List of figures
Figure 1... 19 Figure 2... 27 Figure 3... 28 Figure 4... 28 Figure 5... 33 Figure 6... 33 Figure 7... 34 Figure 8... 34 Figure 9... 35 Figure 10 ... 37 Figure 11 ... 38 Figure 12 ... 40 Figure 13 ... 42 Figura 14 ... 42 Figure 15 ... 45 Figure 16 ... 46 Figure 17 ... 46 Figure 18 ... 49 Figure 19 ... 49 Figure 20 ... 50Sara Pinna
Proteomic analysis of human plasma and Peripheral Blood Mononuclear Cells in Systemic Lupus Erythematosus patients
International PhD School in Biomolecular and Biotechnological Sciences-University of Sassari
iii
List of abbreviations
ACN Acetonitrile
ACR American College of Rheumatology ACTH Adreno Cortico Tropic Hormone ADs Autoimmune diseases
ANA Anti-nuclear antibodies
A.O.U. Azienda Ospedaliera Universitaria APC Antigen Presenting Cell
APO Apolipoprotein AUC Area Under the Curve
BANK1 B-cell scaffold protein with ankyrin repeats 1 BILAG British Isles Lupus Assessment Group Scale BLK B lymphoid tyrosine kinase
C2 Complement component 2 C4 Complement component 4 CD40LG CD40 Ligand
sCD40L soluble CD40 ligand CD70 CD70 molecule
aCL anticardiolipin antibodies CICs Circulating immune complex CLU clusterin
CHAPS 3-[(3-cholamidopropyl)dimethylammonio]-1-propanesulfonate CHCA α-cyano-4-hydroxycinnamic acid
anti-dsDNA anti-double stranded DNA DIL drug-induced lupus DTT Dithiothreitol
2DE Two dimensional electrophoresis EBV Epstein-Barr virus
ECLAM European Consensus Lupus Activity Measure EDTA Ethylenediaminetetraacetic acid
ELISA Enzyme-linked immunosorbent assay EGF Epidermal growth factor
GST glutatione S-transferase
GWAS Genome-wide association studies
FCGR2A Fc fragment of IgG, low affinity IIa, receptor HIV human immunodeficiency virus
HLA Human leukocyte antigen HP Haptoglobin
HPV human papilloma virus HSV-1 Herpes simplex virus 1 IEF Isoelectric focusing IFN Interferon
IL Interleukin
IRAK1 Interleukin-1 receptor-associated kinase 1 IRF5 Interferon regulatory factor 5
Sara Pinna
Proteomic analysis of human plasma and Peripheral Blood Mononuclear Cells in Systemic Lupus Erythematosus patients
International PhD School in Biomolecular and Biotechnological Sciences-University of Sassari
iv
IPG strip Immobilized PH Gradient strip
ITGAL integrinalpha L (antigen CD11A (p180)lymphocyte function-associated antigen 1 alpha polypeptide)
ITGAM Integrin alpha M
IP-10 Interferon gamma-induced protein 10 LAC lupus anticoagulant
LC MS/MS Liquid chromatography tandem mass spectrometry MCP monocyte chemoattractant protein
MHC major histocompatibility complex MIP Macrophage inflammatory protein MS Multiple sclerosis
OD Optical density
aPL Antiphospholipid antibody
PBMCs Peripheral Blood Mononuclear Cells PBS Phosphate-buffered saline
PDIA Protein disulfide isomerase family A PMF Peptide Mass Fingerprinting
PK Piruvate Kinase PRDX2 Peroxiredoxin 2
PTPN22 Protein tyrosine phosphatase, non-receptor type 22 PPP2CA Protein Phosphatase 2, Catalytic Subunit, Alpha Isozyme PXK PX domain containing serine/threonine kinase
RA Reumatoid Arthritis
ROC receiver operating characteristic snRNPs small nuclear ribonucleoproteins SDS Sodium Dodecyl Sulphate
SLE Systemic Lupus Erythematosus SA-PE Streptavidin-Phycoerythrin SSc Systemic Sclerosis
SSP Standard spot number SPP1 secreted phosphoprotein 1 SIS SLE Index Score
SLAM Systemic Lupus Activity Measure SLEDAI SLE Disease Activity Index
STAT4 Signal transducer and activator of transcription 4 TALDO Transaldolase
TCA Trichloroacetic acid
TGF Transforming growth factor TFA Trifluoroacetic acid
Th T helper cell
TNFAIP3 Tumor necrosis factor, alpha-induced protein 3 Treg T Regulator cell
TREX1 Three prime repair exonuclease 1
TRIS 2-Amino-2-(hydroxymethyl)-1,3-propanediol VEGF Vascular endothelial growth factor
Sara Pinna
Proteomic analysis of human plasma and Peripheral Blood Mononuclear Cells in Systemic Lupus Erythematosus patients
International PhD School in Biomolecular and Biotechnological Sciences-University of Sassari
1
Chapter 1
Chapter 1 Introduction
Sara Pinna
Proteomic analysis of human plasma and Peripheral Blood Mononuclear Cells in Systemic Lupus Erythematosus patients
International PhD School in Biomolecular and Biotechnological Sciences-University of Sassari
2
Autoimmune Disease
The purpose of the immune system is to protect the body against infectious agents. When the immune system does not work correctly, it may cause various dis-eases.
Autoimmune diseases (ADs) are a wide range of related diseases in which the immune system produces an impaired response against its own cells, tissues and/or organs, causing inflammation and tissues damage. In most cases, the beginning of at-tacks against the body’s self-molecules is unknown. There are more than 80 different autoimmune diseases, and they vary from common to very rare [1].
ADs can be divided into tissue-specific (such as Hashimoto’s thyroiditis, Type I or Immune Mediated Diabetes Mellitus), where unique tissue-specific antigens are tar-geted, or systemic (for example Systemic Lupus Erythematosus, Rheumatoid Arthritis, Systemic Sclerosis ), in which multiple tissues are affected, and a variety of apparently ubiquitously expressed autoantigens are targeted [2].
The development of AD depends on a combination of both genetic and environmental factors. The concordance rate of the disease is generally higher in monozygotic twins compared with dizygotic twins or at least compared to other family members, suggest-ing a genetic contribution [3]. However, the concordance in identical twins is often in-complete, and this indicates the presence of additional factors, presumably from the environment [4].
From the point of view of genetic predisposition, autoimmunity is associated with cer-tain genes; some also are multigenic ADs, in which different genes contribute to the production of the abnormal phenotype [5]. Among the major candidates there are: human leukocyte antigen (HLA) allele (s) genes, T-cell receptor genes, cytokine and cy-tokine receptor genes, immunoglobulin genes and immunoglobulin Fc receptor genes for various autoimmune diseases.
Chapter 1 Introduction
Sara Pinna
Proteomic analysis of human plasma and Peripheral Blood Mononuclear Cells in Systemic Lupus Erythematosus patients
International PhD School in Biomolecular and Biotechnological Sciences-University of Sassari
3 Some of these genes confer a high level of risk than others, for instance, the strongest allelic association was shown by the HLA genes, in many cases, they are considered as primary susceptibility factors for many autoimmune diseases [6].
From the standpoint of environmental exposure to chemicals, pharmacological prod-ucts and pathogens there is a significant link with ADs in both human and animal mod-els. [7]
Some ADs may arise in response to pharmacological treatment. For example, drugs such as procaineamide and hydralazine can induce autoantibodies and lupus-like dis-orders in patients [8]. Penicillamine has been associated with myasthenia gravis and a-methyldopa is known to cause a form of hemolytic anemia. However, in some cases of AD’s drug-induced, ADs symptoms disappeared once the prescribed medication is dis-continued [9].
Infections from certain viruses, bacteria, and mycoplasma can cause the onset of sys-temic AD in genetically predisposed individuals. In addition, a bacterial or viral infec-tion can trigger a severe increase in antibodies and autoreactive T cells, which may cause a worsening of existing symptoms. The viruses most involved in the onset of var-ious ADs are: HSV-1, Coxsackie virus, EBV, HIV, HPV, or influenza virus [2]. Exposure to UV radiation, particularly UV-B rays, has been associated with the presence in flare-ups in lupus patients. In fact, in vitro studies suggest that exposure of DNA and snRNPs to UV-B cause autoreactive lymphocytes and their activation. The mechanism by which these environmental factors induce autoimmunity includes epigenetic changes (such as DNA methylation and histone modification), which can cause reaction with the self component to generate novel antigens, aberrant cell death releasing cellular material that can lead to inflammasome activation and production of pro-inflammatory cyto-kines and molecular mimicry [10].
Many ADs occur more frequently in women, but the reason has not yet been fully clari-fied. Several studies suggest a role for female sex hormones [11], which can directly in-teract with cells of the immune system through receptors, and influence by altering the production of antibodies and the proliferation of immune cells [9]. Reserchers have
Chapter 1 Introduction
Sara Pinna
Proteomic analysis of human plasma and Peripheral Blood Mononuclear Cells in Systemic Lupus Erythematosus patients
International PhD School in Biomolecular and Biotechnological Sciences-University of Sassari
4 suggested that women have a genetic predisposition to autoimmunity due to their se-cond X chromosome [12,13]. Since one X chromosome is silenced by epigenetic mech-anisms in women, it is possible that these epigenetic mechmech-anisms contribute to the predisposition to autoimmunity through effects on the inactive X [14].
The ADs incidence appear to vary from country to country: this variation may be due to the uneven prevalence of an HLA allele linked to a particular AD (due to ethnic dif-ferences) or of a triggering pathogen or chemical agent (due to geographic or envi-ronmental differences) [2].
Systemic Lupus Erythematosus
Introduction
SLE is a systemic autoimmune disease with a broad spectrum of clinical presen-tations and incompletely understood pathogenesis. This AD is characterized by altera-tions in both the innate and adaptive immune system that lead to the loss of immu-nologic tolerance and occurrence of auto-antibodies against nuclear material [15]. The term “lupus” from the Latin “wolf” has been widely used in the eighteenth century to describe a wide variety of skin lesions that was considered similar to that caused by the “wolf’s bite”. Biette et al produced one of the first descriptions of lupus in 1833. In 1846 Ferdinand von Hebra introduced the butterfly term to describe the malar rash. Later in 1872 Kaposi et al founded the systemic nature of the disease. The discovery of the LE phenomenon by Hargraves et al. in 1948 and Friou et al in 1958 provided the first bases on its pathogenesis [16].
Epidemiology
The incidence rates in North America, South America, and Europe range from 2 to 8 cases per 100,000 per person-year. The SLE sex ratio is 6-10:1 (female:male)
pri-Chapter 1 Introduction
Sara Pinna
Proteomic analysis of human plasma and Peripheral Blood Mononuclear Cells in Systemic Lupus Erythematosus patients
International PhD School in Biomolecular and Biotechnological Sciences-University of Sassari
5 marily affecting women in the fertile age. The prevalences of SLE vary considerably de-pending on ethnicity [17]. In Caucasians is estimated a prevalence of around 20 cases/100,000 per year and an incidence of 2-8 new cases per 100,000 person-year. For North America’s black population these data should be tripled. The disease appears to be more common in urban than rural areas [18].
Natural course and aetiology
SLE is a chronic disease with a variety of disease manifestations, and with et-erogenity of presentations, which often delay diagnosis. Common manifestations in-clude rashes, photosensitivity, arthritis, pleuritis, pericarditis, nephritis, neuropsychiat-ric disorders, and hematological disorders. The disease course is characterized by peri-ods of remission and exacerbation.
SLE is characterized by autoantibody non-organ specific production (nuclear anti-bodies ANA, anti-dsDNA and anti-phospholipid antibody). The aetiology of SLE includes both genetic and environmental components with female sex strongly influencing pathogenesis. [18]
Genetic factors
Genetic factors are implicated in pathogenesis with a concordance rate for lupus of 24%–60% among monozygotic twins and 2%–5% among dizygotic twins or siblings [19]. The sibling recurrence risk ratio in SLE patients is 29-fold higher than in the gen-eral population, and the higher concordance among monozygotic than dizygotic twins indicates the importance inheritance. [20]
Genome-wide association studies (GWAS) have progressively improved the under-standing of which genes are most critical to the potential for SLE: there are approxi-mately 30 susceptibility loci for SLE. The most important genes associated are impli-cated in immune response and inflammation (HLA-DR, PTPN22, STAT4, IRF5, BLK,
Chapter 1 Introduction
Sara Pinna
Proteomic analysis of human plasma and Peripheral Blood Mononuclear Cells in Systemic Lupus Erythematosus patients
International PhD School in Biomolecular and Biotechnological Sciences-University of Sassari
6 OX40L, FCGR2A, BANK1, SPP1, IRAK1, TNFAIP3, C2, C4, CIq, PXK), DNA repairs (TREX1), adherence of inflammatory cells to the endothelium (ITGAM), and tissue response to injury (KLK1, KLK3). [21]
Epigenetic effects
The risk for SLE may be influenced by epigenetic effects such as DNA methyla-tion and post-translamethyla-tional modificamethyla-tions of histones (acetylamethyla-tion, deacetylamethyla-tion and methylation), which can be either inherited or environmentally modified. The regula-tory regions of some genes known to be involved in the disease’s pathogenesis (for ex-ample ITGAL, CD40LG, CD70, and PPP2CA) have been reported to be hypomethylated in SLE [22].
Environmental factors
Epidemiological studies have identified a number of environmental factors sus-pected of modulating susceptibility to SLE; some of these factors include viruses (such as EBV that has been identified as a possible factor in the development of lupus), hor-mones, smoking, alcohol intake and exposure to ultraviolet light (the most obvious en-vironmental factor that may exacerbate SLE sintoms), silica, organic solvents, including various drugs like hydralazine and INF-α. It is well established that certain drugs induce autoantibodies in a significant number of patients. Newer biologics and antiviral agents have been reported to cause drug-induced lupus (DIL) [23]. Socioeconomic factors have been associated with poorer outcomes and higher disease activity, [24] although it remains unclear whether they play a role in disease susceptibility or subsequent pro-gression.
Chapter 1 Introduction
Sara Pinna
Proteomic analysis of human plasma and Peripheral Blood Mononuclear Cells in Systemic Lupus Erythematosus patients
International PhD School in Biomolecular and Biotechnological Sciences-University of Sassari
7
Hormonal factors
The role of sex hormones (estrogens and androgens) in the development of SLE is suggested by the marked prevalence of females and from studies in animal models, where the addition of hormones can lead to autoimmune disease with an increase in auto-reactive B cells. In clinical practice, patients receiving oral contraceptives had flares; but a randomized controlled trial found out that combined oral contraceptives do not confer a higher risk of symptoms exacerbations of the disease in women with SLE clinically stable. [25]
In postmenopausal women with SLE who have used hormone replacement therapy it was observed that there is a higher risk of getting mild to moderate lupus flares [26]. Pregnancy may aggravate SLE, in fact, the levels of estradiol and progesterone are lower during the second and third trimesters in comparison with healthy pregnant women. [27].
Pathogenesis
Disease pathogenesis in SLE manifests itself as systemic acute and cronic in-flammation that affects many organ systems. Furthermore, its onset can vary from pa-tient to papa-tient.
In SLE there is an aberrant innate immune response that causes tissue injury by released infiammatory cytokines and by impaired activation of T and B cells. IFNand tumour necrosis factor (TNF), contribute to affected tissue injury and inflammation. These mediators, together with the cells producing them (macrophages, leucocytes, dendritic cells and lymphocytes), are the subject of investigation as potential thera-peutic targets in lupus [28].
Most lupus patients have high titers of auto-reactive antibodies (such as dsDNA) asso-ciated with their autoantigens and to complememt factor, which form circulating im-mune complex (CICs). CIC deposition leads to infiammation [29]. Imim-mune complexes and complement activation pathways are central players in tissue injury. In healthy
in-Chapter 1 Introduction
Sara Pinna
Proteomic analysis of human plasma and Peripheral Blood Mononuclear Cells in Systemic Lupus Erythematosus patients
International PhD School in Biomolecular and Biotechnological Sciences-University of Sassari
8 dividuals, immune complexes are cleared by Fc and complement receptors, in patients with autoimmune disease they are not cleared because the Fc and complement recep-tors are functionally deficient. Tissue damage is mediated by recruitment of inflamma-tory cells, reactive oxygen intermediates, production of inflamainflamma-tory cytokines, and modulation of the coagulation cascade [30]. The pathogenesis of SLE involves a multi-tude of cells and molecules that participate in apoptosis, innate and adaptive immune responses.
Briefly, we can summarize the abnormalities in the immune system in: impaired clearance of immune complexes;
altered activity of networks idiotype-antidiotype that are unable to inactivate T and B lymphocytes;
Increased activity of T-helper to produce the antibodies by B-lymphocytes; The suppressor T cells do not function properly;
alterations of the mechanisms of immunological tolerance.
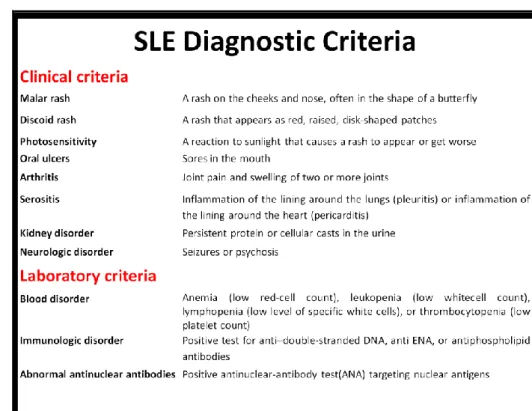
Classification criteria
Consensus guidelines provided by the American College of Rheumatology (ACR) offer the basis for accurate and standardized diagnosis of SLE. The original recommen-dations published in 1982 were updated in 1997 and contain 11 diagnostic categories (Table 1). The presence of any four of these criteria, either concurrently or consecu-tively, confirms the diagnosis of SLE. The major change in the 1997 revision was the in-clusion of newer immunological tests, namely, antiphospholipid (aPL) antibodies, anti-cardiolipin (aCL) antibodies, and lupus anticoagulant (LAC), and the removal of redun-dant histological preparations [31,32].
Chapter 1 Introduction
Sara Pinna
Proteomic analysis of human plasma and Peripheral Blood Mononuclear Cells in Systemic Lupus Erythematosus patients
International PhD School in Biomolecular and Biotechnological Sciences-University of Sassari
9
Chapter 1 Introduction
Sara Pinna
Proteomic analysis of human plasma and Peripheral Blood Mononuclear Cells in Systemic Lupus Erythematosus patients
International PhD School in Biomolecular and Biotechnological Sciences-University of Sassari
10
Activity indices
The disease course is characterized by periods of remission, followed by pro-gressive exacerbations, therefore it is important to categorize disease activity. Discern-ing in an appropriate manner the disease activity is important for improvDiscern-ing both prognosis and treatment. The indices validated and used are the following: the Euro-pean Consensus Lupus Activity Measure (ECLAM), the British Isles Lupus Assessment Group Scale (BILAG), the National Institutes of Health SLE Index Score (SIS), the Sys-temic Lupus Activity Measure (SLAM), and the SLE Disease Activity Index (SLEDAI). These indices have been developed in the context of long-term observational studies and have been shown to be strong predictors of damage and mortality, and reflect change in disease activity [18].
Bertsias et al [28] recommend the use of the ECLAM and the SLEDAI whom are more convenient for daily practice.
Proteomic and SLE
In SLE, the presence of specific serological markers is limited, and the patho-genesis has not yet been fully elucidated. The diagnosis of SLE during the initial stages may be mistaken, this happens because the symptoms may be similar to those of other rheumatic diseases (such as RA and SSc); moreover, it requires a complex interpreta-tion of the ACR criteria.
The disease is also characterized by periods of remission and flare, and, being systemic, it could also manifests itself in different sites, and so far there are no specific tests to indicate accurately the picture.
From the present literature [33-39], we note the importance of proteomics, which can help to find new therapeutic targets and it also could help to better under-stand the cellular mechanisms.
Chapter 1 Introduction
Sara Pinna
Proteomic analysis of human plasma and Peripheral Blood Mononuclear Cells in Systemic Lupus Erythematosus patients
International PhD School in Biomolecular and Biotechnological Sciences-University of Sassari
11 Proteins are indeed important executors of physiological and cellular functions; changes in their expression reflect the different physiological conditions (e.g. healthy and sick). Observing the variations may help to better understand the pathogenesis in order to improve diagnosis and treatment.
Plasma and Peripheral Blood Mononuclear Cells (PBMCs) can be obtained easily and non-invasively. Both the matrices are subjected to rapid changes in response to differ-ent signals, such as during inflammatory states. Plasma is one of the most widely used blood component, while in recent years we have seen a greater interest in PBMCs. PBMCs are mainly composed of monocytes and lymphocytes, these cells are the most involved in the immune response. Observing the changes in their proteome may help us to have a deeper knowledge of their function in various diseases [40-42].
Cytokines and SLE
Cytokines are molecules produced by various types of cells and secreted into the surrounding medium, usually in response to a stimulus. The development of an ef-fective immune response involves lymphoid, inflammatory and hematopoietic cells [43].
The term cytokine includes a large and diverse family of polypeptide regulators widely produced throughout the body by cells of different embryonic origin.
Cytokines are essential for the development and operation of both innate and adaptive immune response, even though not limited to the immune system. A large variety of cells is able to secrete cytokines, but the two main sources of these mediators are T helper and macrophages.
The general characteristics of the cytokines may be briefly summarized as follows: proteins with molecular weight comprised between 10 and 50 kD;
cytokines act on their target cells via specific receptors, usually equipped with high or very high binding affinity;
Chapter 1 Introduction
Sara Pinna
Proteomic analysis of human plasma and Peripheral Blood Mononuclear Cells in Systemic Lupus Erythematosus patients
International PhD School in Biomolecular and Biotechnological Sciences-University of Sassari
12 the actions of cytokines can be divided into "autocrine" (when the target cell of
a specific cytokine is represented by the same cell that produces it), "paracrine" (when the target cell is located in the proximity of the cell responsible for the production) or more rarely "endocrine" (if the target cell is located remote from the cell responsible for the cytokine secretion and reaches the target via the bloodstream);
cytokines can direct their action towards many different cell types. This feature is known with the term pleiotropism. Pleiotropism means also that a cytokine can perform different actions on the same cell line;
One of the features of cytokines is the redundancy of the actions of these molecules, in fact many of these soluble molecules share the same actions, sometimes even against the same cell type [43].
These mediators are involved in the pathogenesis of autoimmune diseases, including SLE and RA. In SLE, several of these cytokines are overexpressed and contribute to the pathogenesis, in the activity or organ involvement of the disease.
The most involved cytokines are those produced by the interaction of different T cell subsets. For example Th1 (IL-1, IL-6, IFN-, TNF-) and Th17 (IL-17, IL-21,IL-22) cyto-kines subset generally drive pathogenic effector responses while. Th2 (IL-4, IL-5, IL-13) and Treg (TGF- and IL-10) cytokines mediate regulatory response (44).
Even chemokines (chemoattractan cytokines) that exert their effects by attracting flammatory cells, including monocytes, neutrophils and T lymphocytes, to sites of in-flammation, are implicated in the pathogenesis of SLE, and in some studies, the ex-pression was found to be increased and correlated with renal involvement and disese activity [45,46].
The measurement of cytokines in SLE can be useful in order to monitor the dis-ease more accurately. In fact, it may be useful for identifying flare, assistance in moni-toring response to therapy, provide information regarding the organs involvement and identification of possible therapeutic targets. Indeed, some therapies that inhibit their
Chapter 1 Introduction
Sara Pinna
Proteomic analysis of human plasma and Peripheral Blood Mononuclear Cells in Systemic Lupus Erythematosus patients
International PhD School in Biomolecular and Biotechnological Sciences-University of Sassari
13 action have been successfully used for the treatment of other rheumatic autoimmune diseases (RA and Crohn's disease) [47, 48].
14
Sara Pinna
Proteomic analysis of human plasma and Peripheral Blood Mononuclear Cells in Systemic Lupus Erythematosus patients
International PhD School in Biomolecular and Biotechnological Sciences-University of Sassari Sara
Chapter 2
Chapter 2 Objectives
15
Sara Pinna
Proteomic analysis of human plasma and Peripheral Blood Mononuclear Cells in Systemic Lupus Erythematosus patients
International PhD School in Biomolecular and Biotechnological Sciences-University of Sassari Sara
In ADs, particularly in SLE, early diagnosis, flare or remission phases can be dif-ficult to identify, because of complex etiopathogenesis, heterogeneous presentation of symptoms, and unpredictable course. In addition, the initial symptoms may include signs or symptoms common among different ADs.
The definition of specific serological markers is essential for early differential diagnosis. There are no set of biomarkers that can be used reliably to confirm the presence of SLE or to monitor its progression with specificity and sensitivity.
Starting from these assumptions, the aim of this study was to observe the changes in the proteome and in cytokines expression of SLE patients, in order to in-crease our knowledge about pathogenesis and to find possible diagnostic markers and/or therapeutic targets for improving diagnosis and treatment.
16
Sara Pinna
Proteomic analysis of human plasma and Peripheral Blood Mononuclear Cells in Systemic Lupus Erythematosus patients
International PhD School in Biomolecular and Biotechnological Sciences-University of Sassari Sara
Chapter 3
Chapter 3: Methods
Sara Pinna
Proteomic analysis of human plasma and Peripheral Blood Mononuclear Cells in Systemic Lupus Erythematosus patients
International PhD School in Biomolecular and Biotechnological Sciences-University of Sassari
17
Patients
Twenty one SLE patients, (20F:1M, 48,2±6,14 years), twelve RA patients (12F, 64,15±12,17 years, used as pathological control) and twenty one healthy volunteers (20F:1M, 42,14±9.58 years) were enrolled in the study.
All subjects were recruited from the Cit.Il.AKeA Project (This project was sup-ported by Regione Autonoma della Sardegna, Legge regionale 7/2007, “Le interleuchi-ne interleuchi-nella longevità, interleuchi-nelle patologie sistemiche e interleuchi-neoplastiche: semplici marcatori o fat-tori predittivi per la risposta terapeutica?” Cit. Il.AKeA [49], P.I. Luca Deiana, approved by the local bioethics) in collaboration with the unit of Medical Pathology A.O.U. Uni-versity of Sassari and all signed a written consent prior to blood sampling.
SLE diagnosis is based on the 1987 American College of Rheumatology criteria [50]. Each SLE patient had the same disease activity, calculated with SLEDAI (Score ≤6, inactive disease). All partecipants were Caucasians people. Blood samples were col-lected into vacutainers containing potassium EDTA as anticoagulant (Vacutest Kima). For 2D analyses we have used pooled samples for each group; while for ELISA and Western Blot validations we used single samples.
All SLE patients were on treatment using standard protocol incorporating glu-cocorticoids and immunosuppressive agents while healthy subjects didn’t suffered from any autoimmune disease.
Plasma samples
The red cell fraction was separated from plasma by centrifugation at 2500 g at 4°C for 15 min and the clear plasma supernatant was stored in aliquots frozen at -80°C
Chapter 3: Methods
Sara Pinna
Proteomic analysis of human plasma and Peripheral Blood Mononuclear Cells in Systemic Lupus Erythematosus patients
International PhD School in Biomolecular and Biotechnological Sciences-University of Sassari
18 until use. For cytokines analysis plasma samples were centrifuged again at 10000g for 10min at 4°C to remove completely platelets and precipitates.
Removal of the high-abundance proteins from plasma samples
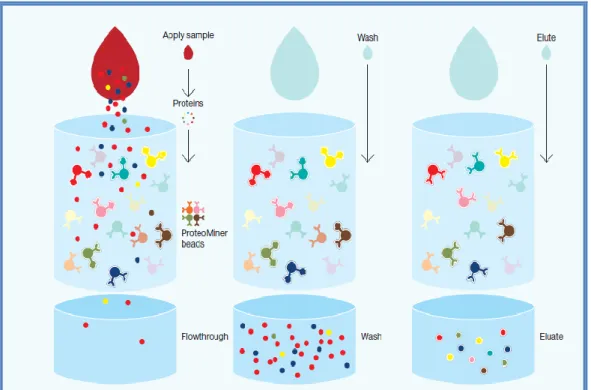
For each group (SLE, RA and Healthy), were created plasma pools.For protein extraction we used the ProteoMiner™ ProteinEnrichment Kits (Biorad). The The Proteominer is a new tool used to reduce the concentration of proteins in complex biological samples. The presence of high-abundance proteins in biological samples (such as albumin and immunoglobulins) makes the detection of medium and low abundance proteins very difficult. The technology is based on the interaction of the samples with hexapeptides related to chromatographic supports (Figure 1). The high-abundance proteins are washed during procedures, while the low-high-abundance proteins are focused on their specific ligands.
In the first step was removed the storage buffer from columns by washing them with 600 l of wash buffer (30-60 sec) twice after this process the column conteined 100 l of settled beads, ready for sample binding.
The plasma samples were centrifuged at 10000g for 10 min to clarify.
One ml of sample was added to each column. The columns were positioned on a rota-tional shaker for 2 hr at room temperature. Then, the columns were washed for 3 times with 600 l of wash buffer. After, all the buffer was removed, 600 μl of deionized water was added and the columns have been rotatedend-to-end for 1 min. The mate-rial was discarded. Then 100 l of rehydrated elution reagent was added and the col-umns were incubated at room temperature and lightly vortex several times over a pe-riod of 15 min. In the next step the eluate was placed in a clean collection tube and centrifuged at 1000g for 30–60 sec. The eluate contains the proteins at medium and low abundance ; this step was repeated two more times.
Chapter 3: Methods
Sara Pinna
Proteomic analysis of human plasma and Peripheral Blood Mononuclear Cells in Systemic Lupus Erythematosus patients
International PhD School in Biomolecular and Biotechnological Sciences-University of Sassari
19
Figure 1: High-abundance proteins saturate their ligands (yellow and red beads) and excess protein is
washed out during the procedure. Low-abundance proteins are concentrated on their specific ligands (pink and teal beads)
PBMCs samples
PBMCs were isolated using a Ficoll-Paque Plus density gradient (Amersham Pharmacia Biotech) according to the manufacturer’s instructions.
The cells were resuspended in phosphate-buffered saline (PBS). Soluble proteins were extracted from PBMCs by incubation on ice in 200 μl of lysis buffer (7M urea, 2M thiourea, 4% CHAPS, DNasi (3μl/ml), RNasi (3μl/ml)and Complete Protease Inhibitor Cocktail(5μl/ml) for 10 min. Were carried 2 freeze-thaw cycles at -80°C for 5 min. Sam-ples were centrifuged at 14000g for 30 min at 4°C and supernatant containing proteins recovered. For proteomics analyses the protein extract of PBMCs was pooled for each group (SLE,RA and Healthy). The pool is prepared by mixing defined units of protein ex-tract (50 µg of protein) belonging to the same group.
Chapter 3: Methods
Sara Pinna
Proteomic analysis of human plasma and Peripheral Blood Mononuclear Cells in Systemic Lupus Erythematosus patients
International PhD School in Biomolecular and Biotechnological Sciences-University of Sassari
20
Protein quantification
The concentration of plasma and PBMCs proteins were determined using the RC/DC Protein Assay (BioRad) according to the manufacturer’s instructions.
The RC/DC Protein Assay uses a Lowry method modified to reduce agent com-patible (RC) as well as detergent comcom-patible (DC). The assay based on the reaction of proteins with an alkaline copper tartrate solution and Folin reagent where the color development is primarily due to the aminoacids tyrosine and tryptophan, and to a lesser extent, cystine and histidine. Proteins reduce the Folin reagent by loss of 1, 2 or 3 oxygen atoms, thus producing one or more of several possible reduced species which have a characteristic blue colour with a maximum absorbance at 750 nm. A standard curve was constructed using albumin as standard sample in a range between 0.2 and 2mg/ml.
Two dimensional SDS PAGE
Total protein extracts of plasma and PBMCs samples were separated by 2D-PAGE gels. Analytical gels contained 150 μg of total protein extracts; for preparative gels 1000 μg of protein were applied. Three experimental replicates were performed for each sample pool belonging to the three different groups.
Isoelectrofocusing (IEF)
Plasma: The first dimension (Isoelectric Focusing, IEF) was performed on IPG (Immobilized pH gradient) strips linear pH 3-10, 17 cm from BioRad. At first, the strips were rehydrated for 20 hours at 20°C without voltage in rehydration buffer (Urea 8M, Tiourea 2M, 4% CHAPS, Destreak reagent, 10mM DTT, 1% carrier ampholyte pH 3-10 and 0.05% bromophenol blue) and covered with mineral oil. The proteins were sepa-rated using the Protean IEF Cell system (Biorad) according to the following protocol: 2
Chapter 3: Methods
Sara Pinna
Proteomic analysis of human plasma and Peripheral Blood Mononuclear Cells in Systemic Lupus Erythematosus patients
International PhD School in Biomolecular and Biotechnological Sciences-University of Sassari
21 hr at 250 V, 2 hr at 500 V, 2 hr at 750 V, 2 hr at 1000 V, 2 hr at 5000 V, 2 hr at 8000 V, at 8000 V for 50.000 Volthours, for a total of 80.000 V). Focused IPG strips were equili-brated in two steps (15 min each) in 1 ml freshly prepared sample buffer (50 mM Tris– HCl pH 8.8, 6 M urea, 20% (v/v) glycerol and 2% (w/v) SDS, 1% (w/v) bromophenol blue) supplemented with 2% dithiothreitol and 2.5% iodoacetamide respectively [51].
PBMCs: IEF was performed on IPG strips linear pH 4-7, 17 cm from BioRad. At first, the strips were rehydrated for 21 hours in rehydration buffer (Urea 8M, Tiourea 2M, 4% CHAPS, Destreak reagent, 10mM DTT, 1% carrier ampholyte 4-6 and 0.05% bromophenol blue) and covered with mineral oil. The proteins were separated in the first dimension according to the following protocol: 2 hr at 250 V, 2 hr at 500 V, 2 hr at 750 V, 2 hr at 1000 V, 2hr at 5000 V, 2 hr at 8000 V and at 8000 V for 50.000 Volthours for a total of 80.000 Vh. After isoelectric focusing the IPG strips were equilibrated in the same protocol of plasma.
SDS-PAGE
To separate the protein in the second dimension we performed a size denatur-ing sodium dodecylsulfate polyacrylamide gel electrophoresis (SDS PAGE). Equilibrated IPG strips were embedded into 0.5% agarose on top of SDS polyacrylamide gels. The anionic detergent sodium dodecyl sulfate (SDS) denatures the proteins and provides the protein with a negative net charge.
For the second dimension 13,5% (for plasma proteins) and 12,5% (for PBMCs proteins) SDS-polyacrylamide gels were used. The gels were made using the Multicast-ing Chamber from BioRad; usMulticast-ing this apparatus we were able to produce ten gels si-multaneously with a high reproducibility. The gels were run on a Protean Multicell (BioRad) were six gels at a time can be run. The instrument is connected to a cooling bath to avoid excessive heating of the buffer. The lower chamber was filled with buffer containing Tris 0.125M, Glycine 0.96M, SDS 1%, while the upper chamber had the same composition but with the SDS concentration doubled (2%). This modification was
Chapter 3: Methods
Sara Pinna
Proteomic analysis of human plasma and Peripheral Blood Mononuclear Cells in Systemic Lupus Erythematosus patients
International PhD School in Biomolecular and Biotechnological Sciences-University of Sassari
22 suggested by the work of Weirner et al [52] who proved that in order to minimize gel smearing the concentration of SDS in the cathodic buffer needs to be increased.
After completion of the run, analytical gels were stained in SYPRO® Ruby Pro-tein Gel Stain whereas preparative gels in Coomassie staining solution. SYPRO Ruby stain is ready to-use and is a ultrasensitive, luminescent stain for the detection of pro-teins separated by polyacrylamide gel electrophoresis.
After electrophoresis, the gel was placed in a clean container with 100 ml of fix solution (50% methanol, 7% acetic acid) and put in an orbital shaker for 30 minutes. After that, we added the SYPRO® Ruby stain and incubated in an orbital shaker over-night. The day after, the gels were transferred to a clean container and washed in 100 ml of wash solution (10% methanol, 7% acetic acid) for 30 minutes. The transfer phase helps to minimize background-staining irregularities and stain speckles spot on the gel. Before imaging the gels were rinse in ultrapure water. The gels were scanned using Chemidoc™ XRS (BioRad).
Coomassie staining is cheap, quantitative and reproducible. The staining solu-tion used was composed of 0.05% coomassie Blue R-250 dissolved in 50% methanol, 10% acetic acid and H2OmilliQ.
Gels were then washed with H2OmillQ and destained in destaining solution
containing the same components of the staining solution except for the dye. Gels were scanned using a GS-800 densitometer (BioRad).
Image analysis
Images were analysed using the PDQuest Advance 2D Analysis Software (Bio-Rad). We performed the image analysis following the steps summarized below:
Scanning: gels are turned into pixel data and then each map is turned into a se-ries of pixels describe by their optical density value (OD).
Chapter 3: Methods
Sara Pinna
Proteomic analysis of human plasma and Peripheral Blood Mononuclear Cells in Systemic Lupus Erythematosus patients
International PhD School in Biomolecular and Biotechnological Sciences-University of Sassari
23 Automated spot detection: identification of spots present in each gel in-dipendently, then spots are located on the gel image fitted by ideal gaussian distributions and quantified by the sum of the OD values within each gaussian distribution.
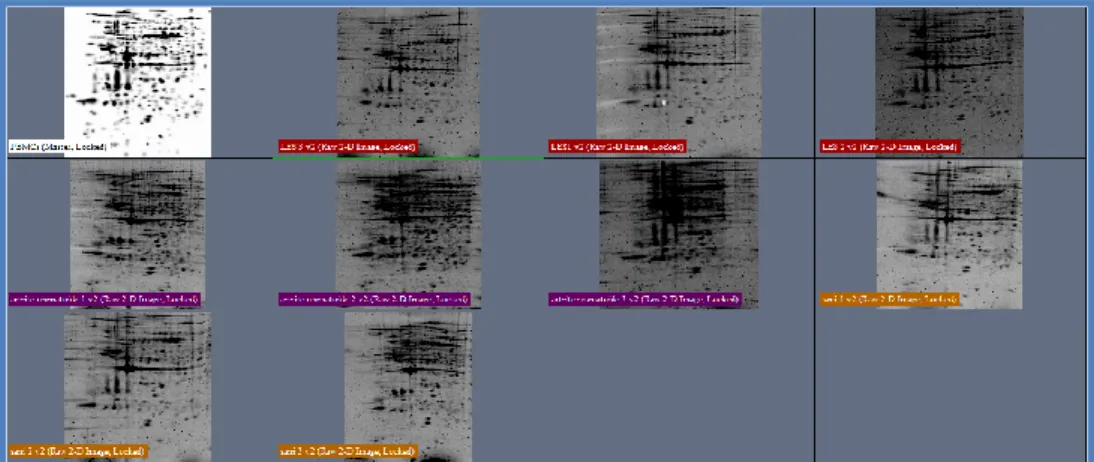
Matching of protein profiles: 2D gels are then edited and matched to one an-other in a “match set”, to achieve this, landmarks are used, consisting of refer-ence spots used by PDQuest to align and position the match set members for matching.
Normalization: is used to compensate gel to gel variations due to sample preparation and loading, staining and destaining procedures.
Spots were first detected and matched automatically to a master gel selected by the software and then we corrected manually the errors in the editing end matching steps.
Spot volumes were normalised with the option “Local Regression Model” method (LOESS); this method uses the raw quantity of each spot in a member gel, multiplied by a factor based on the local regression method of the matched spots. In order to exclude artifacts and false positive we manually confirmed both matching and data quality of all the spots: only those spots that were de-tectable in all gels of a sample set were considered for evaluation. The quantity table was exported to a spreadsheet file and submitted to statistical analyses.
Chapter 3: Methods
Sara Pinna
Proteomic analysis of human plasma and Peripheral Blood Mononuclear Cells in Systemic Lupus Erythematosus patients
International PhD School in Biomolecular and Biotechnological Sciences-University of Sassari
24
Western blot
For western blot analysis were analysed the same protein extracts used for 2D PAGE.
The samples were boiled in laemli buffer (TrisHCl 1M pH6.8, glicerol, 10% SDS, 0.5% bromophenol blue) for 4 minutes at 95°C and then loaded on a 12.5% acrylamide gel. After SDS PAGE the gel was transferred to a nitrocellulose membrane using the Trans Blot Plus Cell system from BioRad. The gel size was measured and two whatman filter papers and one nitrocellulose membrane of the same size were prepared. The fil-ter papers and nitrocellulose were soaked in transfer buffer (25mM Trizma base, 200mM glycine in H2O milliQ). Then the soaked nitrocellulose and the polyacrylamide
gel were placed on to one of the filter papers and covered with the second filter paper. This stack was placed between two sponge cloths before they were placed into the holding device of the blot chamber.
Then, blotting was performed at 60V for 1 hour. During the blotting procedure the instrument was connected to a cooling bath to avoid excessive heating of the buffer.
After disassembling, the membrane was soaked in blocking buffer containing 3% albumin in PBS-T (PBS 10X, 20% (v/v) methanol and 0.05% (v/v) Tween-20 in ddH2O) for 1 hour at room temperature. It was then shortly rinsed with washing buffer (PBS-T) and the primary antibody (mouse monoclonal antibody peroxiredoxin2, dilu-tion 1:3000, Pierce) was applied in the same buffer overnight at 4°C. The blots were washed 3 times for 10 min in washing buffer before the secondary horseadish peroxi-dase labelled goat anti-mouse antibody was applied in the same buffer at a dilution of 1:2000 for 80 minutes at RT. The membranes were washed five times in PBS-T before the blots were developed using the ECL Immunoblotting Detection Kit from Amer-sham. The images were acquired with the Chemidoc ™ XRS from BioRad. The exposure time was set at 60 sec and then the image analyzed for densitometric studies.
Chapter 3: Methods
Sara Pinna
Proteomic analysis of human plasma and Peripheral Blood Mononuclear Cells in Systemic Lupus Erythematosus patients
International PhD School in Biomolecular and Biotechnological Sciences-University of Sassari
25
Mass spectrometry and protein identification
Mass spectrometry is the most common, high throughput method for identify-ing proteins from 2D gels. It accurately weights peptides after digestion with a suitable enzyme and the masses of these peptides can then be matched against the theoretical peptide masses of known proteins for identification.
In the present work, protein spots with a statistically significant variation (p≤0.05, ANOVA), showing an over two-folds difference in volume, were selected as differentially expressed and analyzed by MS and MS/MS analyses. MS analyses were performed on a MALDI-TOF mass spectrometer micro MX™(Waters).
The main parameters used were: reflectron mode, positive polarity, mass range 800-4000 Da. Mass spectra were calculated using an external calibration, with the fol-lowing mixture of peptides: Bradykinin fragment 1-7 (m/z 757.3997),Angiotensin II (m/z 1046.5423 ), P14R synthetic peptide (m/z 1533.8582), ACTH fragment 18-39 (m/ z
2465.1989), Insulin oxidized B chain (bovine) (m/z 3494.6513) (ProteoMass™ Peptide & Protein MALDI-MS Calibration KIT, SIGMA). One μl of tryptic peptide solution of each digested spot was mixed with an equal amount of the matrix α-cyano-4-hydroxycinnamic acid (CHCA), prepared in 0,2% Trifluoroacetic acid (TFA) and in 70% Acetonitrile (ACN), applied on a MALDI plate and dried at room temperature. All spec-tra were analyzed using the Mass Linx v 4.1 software (Waters). Protein identification was performed by peptide mass fingerprinting (PMF) using MASCOT software search-ing at www.matrixscience.com. Search parameters were restricted to Homo sapiens taxonomy using the NCBInr database. Enzyme selection was trypsin, with up to one missed cleavage permitted. Carbamidomethylation of cysteines was selected as a fixed modification; Gln -> pyro-Glu (N-term Q), Oxidation (M) as variable modifications. Pro-tein mass was unrestricted and peptide mass tolerance typically set at ±150 ppm. Mass values were entered as monoisotopic MH+.
Chapter 3: Methods
Sara Pinna
Proteomic analysis of human plasma and Peripheral Blood Mononuclear Cells in Systemic Lupus Erythematosus patients
International PhD School in Biomolecular and Biotechnological Sciences-University of Sassari
26 To get a further confirmation of the proteins identified, some of them, considered most relevant, were subjected again to identification through MS/MS analyses. LC-MS/MS analyses was performed on an HPLC-Chip/Ion Trap (Agilent). All searches were performed using the Proteome Discoverer version 1.4 with the following parameters: Mascot search engine, database SwissProt , the taxonomy Homo sapiens, a maximum of 2 sites of hydrolysis missed, enzyme trypsin, oxidation of methionine and cycliza-tion of the N-terminal glutamine to pyroglutamic as the variable changes.
ELISA
A non competitive ELISA kit (Cloud-Clone Corp. Assembled by Usnc Life Science Inc. Huston, USA) for human clusterin was used following manufacturer instructions using plasma samples.
Cytokine quantification
Plasma concentration of the cytokines was determined by the Bio-Plex MAGPIX Multireader (Biorad) instrument.
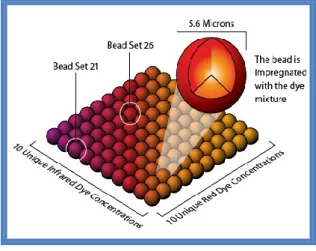
The Bio-Plex system is based on xMAP technology developed and owned by Luminex Corp, which can theoretically support up to 50 different ELISA assays for a single sample. Each test is performed on the surface of a polystyrene bead, diameter of 5.6 m. Each bead contains inside two fluofores in different ratio, which allow the beads’ classification in 100 different regions (Figure 2). Each set of beads can be conju-gated with a different antibody.
Chapter 3: Methods
Sara Pinna
Proteomic analysis of human plasma and Peripheral Blood Mononuclear Cells in Systemic Lupus Erythematosus patients
International PhD School in Biomolecular and Biotechnological Sciences-University of Sassari
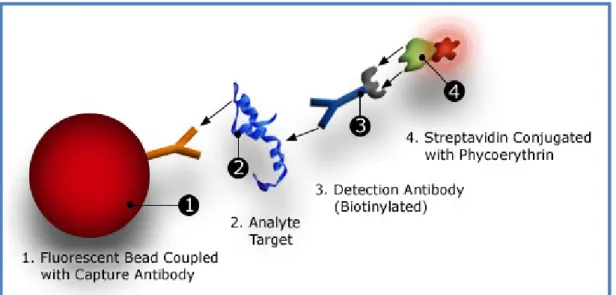
27 The principle of the Bio-Plex Pro™ Assay (Bio-Rad) is similar to the ELISA-sandwich. The beads (50 l) associated with the specific antibody are incubated with the sample (diluted 1:4 with Bio-Plex sample diluent) in a microplate. After one hour of incubation in the dark and agitation, 3 washes with wash buffer are performed, and the biotinylated secondary antibody (25 l) is added. The biotinylated secondary anti-body binds to another epitope of the molecule.
After 30’ of incubation in the dark and stirring, the streptavidin-phycoerythrin (SA-PE) (50l) is added for 10’. The phycoerythrin acts as a fluorescence detector (Figure 3).
After incubation, the plate is inserted into the player's Bio-Plex MAGPIX; the reader employs light-emitting diodes (LEDs) and a charge-coupled device (CCD) imager to illulinate and image a monolayer of immobilized magnetic beads. Precision fluidics align the beads in a single line from a stream that leads into a cell where two LED ex-cite the beads individually. The red led (635 nm) exex-cites the dye in each ball, identify-ing the specific beads. The green led (532 nm) excites phycoerythrin reporter that gen-erates a signal that is read by a photomultiplier tube which allows to quantify the ana-lyte captured (figure 4). The processor manages high-speed digital data and the Bio-Plex Manager software presents the data as mean fluorescence intensity (MFI) and as a concentration (pg/ml). Concentration of the analyte bound to each bead is propor-tional to the MFI of the reporter signal.
Chapter 3: Methods
Sara Pinna
Proteomic analysis of human plasma and Peripheral Blood Mononuclear Cells in Systemic Lupus Erythematosus patients
International PhD School in Biomolecular and Biotechnological Sciences-University of Sassari
28
Figure 3: Bio-Plex sandwich immunoassay
Chapter 3: Methods
Sara Pinna
Proteomic analysis of human plasma and Peripheral Blood Mononuclear Cells in Systemic Lupus Erythematosus patients
International PhD School in Biomolecular and Biotechnological Sciences-University of Sassari
29
Statistical analysis
All the statistical analyses were performed using STATA Release 9 and SPSS v 17 softwares. To compare changes of the mean intensity values of protein spots between healthy, SLE and RA groups a parametric test, the One Way ANOVA, was performed followed by “Fisher’s least significant difference method” (LSD); p-values ≤0.05 were considered significant.
Among all statistically significant spots, only those that showed changes of the mean intensity values at least by a factor 2 compared to the healthy group were se-lected, in order to exclude the impact of experimental variability and consider more re-liable data.
To compare the different cytokine expression patterns among the three groups, the Kruskall Wallis test and the Dunn’ methods were permormed for pair compari-sons, because the data did not follow a normal distribution.
To compare the changes in plasma clusterin concentration and in optical den-sity of Peroxiredoxin 2 among the three groups the ANOVA test was performed. Re-ceiver operating characteristic (ROC) curve was used to assess the diagnostic value of statistically significant cytokines.
Chapter 3: Methods
Sara Pinna
Proteomic analysis of human plasma and Peripheral Blood Mononuclear Cells in Systemic Lupus Erythematosus patients
International PhD School in Biomolecular and Biotechnological Sciences-University of Sassari
30
Materials
IPG strips pH 4-7 17cm and pH3-7 17cm, Bio-Plex Pro™ Assay were purchased from BioRad Laboratories (CA, USA), Ampholyte 4-6, Ampholyte 3-10, Dithiothreitol (DTT), urea and thiourea, DNasi, RNasi ProteoMass™ Peptide & Protein MALDI-MS Calibration KIT from Sigma-Aldrich (MO, USA), COmplete Protease Inhibitor Cocktail Tablets from Roche (), Mouse Monoclonal antibody Anti-Peroxiredoxin 2 from PIERCE Thermo Fisher Scientific Inc. (IL, USA) and Goat anti-mouse Secondary antibody SC-2005 from Santa Cruz Biotechnology (CA, USA), Magic Mark XP western protein stan-dard from Invitrogen (CA, USA), ELISA Kit for Clusterin (CLU) Human from Cloud-Clone Corp. Assembled by Usnc Life Science Inc. (TX, USA). All other reagents were of the highest quality available.
31
Sara Pinna
Proteomic analysis of human plasma and Peripheral Blood Mononuclear Cells in Systemic Lupus Erythematosus patients
International PhD School in Biomolecular and Biotechnological Sciences-University of Sassari Sara
Chapter 4
Chapter 4: Results
Sara Pinna
Proteomic analysis of human plasma and Peripheral Blood Mononuclear Cells in Systemic Lupus Erythematosus patients
International PhD School in Biomolecular and Biotechnological Sciences-University of Sassari
32
2D-PAGE comparisons
In order to know the pattern of protein expression on matrices of plasma and PBMCs in SLE patients a proteomic approach has been used including 2D-PAGE and mass spectrometry analyses.
2D electrophoresis maps
The proteomic comparisons were based on the differences of mean intensity values of protein spots between SLE patients, RA patients and healthy subjects. For each “matchset” (3 replicates for each group) we had the same SSP (standard spot number) assigned by the software. The software used for image analysis (PD QUEST advanced) has detected about 500 and 600 valid spots in PBMCs and plasma samples respectively. Among these 13 spots and 8 spots were found to show significant chang-es (higher than two folds, p ≤ 0.05, ANOVA tchang-est) in intensitichang-es compared with the healthy group in PBMCs and plasma samples respectively.
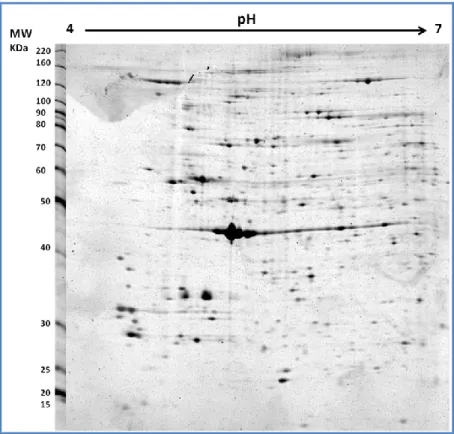
The figures 5 and 6 show the 2D PBMCs and plasma maps obtained in our labo-ratory through the method described in materials and methods. The images were found to be similar either between gels or between groups (Figures 7 and 8).
Chapter 4: Results
Sara Pinna
Proteomic analysis of human plasma and Peripheral Blood Mononuclear Cells in Systemic Lupus Erythematosus patients
International PhD School in Biomolecular and Biotechnological Sciences-University of Sassari
33
Figure 5: Typical gel image obtained in our lab for PBMCs proteins in 12.5 % gel
Figure 6: Typical gel image obtained in our lab for Plasma proteins after removal of high-abundance
Chapter 4: Results
Sara Pinna
Proteomic analysis of human plasma and Peripheral Blood Mononuclear Cells in Systemic Lupus Erythematosus patients
International PhD School in Biomolecular and Biotechnological Sciences-University of Sassari
34
Proteins identification by Mass Spectrometry
Differentially expressed protein spots were excised from the gels, digested with trypsin and the proteolytic fragments analyzed by MALDI-TOF mass spectrometry as described in materials and methods section.
Figure 7: Matchset example created by PDQuest software for PBMCs pool sample
Chapter 4: Results
Sara Pinna
Proteomic analysis of human plasma and Peripheral Blood Mononuclear Cells in Systemic Lupus Erythematosus patients
International PhD School in Biomolecular and Biotechnological Sciences-University of Sassari
35
PBMCs proteins identification
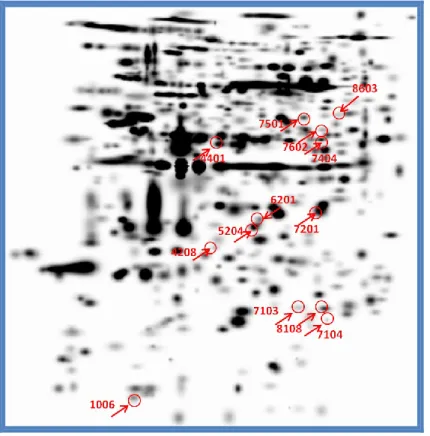
We found 13 protein spots that undergoing statistically significant changes in mean intensity values between the three groups considered (Figure 9) : six spots showed OD values higher in SLE patients than in healthy subjects; five different spots increased in intensity in RA patients compared to healthy subjects.
One spot underwent similar changes in intensity both in SLE patients and in RA patients compared with healthy controls: Finally, one spot was missing only in SLE pa-tients. (Table 2).
Figure 9: Differentially expressed protein spots on PBMCs gel
We observed that in SLE patients and in pathological controls the protein patterns that undergo changes compared to healthy subjects are different .
Chapter 4: Results
Sara Pinna
Proteomic analysis of human plasma and Peripheral Blood Mononuclear Cells in Systemic Lupus Erythematosus patients
International PhD School in Biomolecular and Biotechnological Sciences-University of Sassari
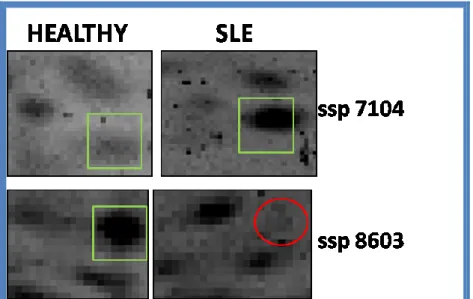
36 The data that we consider most interesting were the absence of the spot pro-tein T-complex propro-tein 1 subunit beta only in SLE patients and the overexpression of peroxiredoxin 2 (fold regulation of approximately 17 times) in SLE patients than in healthy subjects (Figure 10).
Table 2
Mass spectrometric identification of spots using the Mascot search engine. In the table are reported SSP number, NCBInr accession number, protein name, their fold regulation values (ratio), molecular weight (MW) in daltons (Da), isoelectric point (pI), sequence coverage (C%) and matching peptides (QM).
Chapter 4: Results
Sara Pinna
Proteomic analysis of human plasma and Peripheral Blood Mononuclear Cells in Systemic Lupus Erythematosus patients
International PhD School in Biomolecular and Biotechnological Sciences-University of Sassari
37
Figure 10: Zoom on the position of T-complex 1 protein spot (below in the figure) and Peroxiredoxin 2
Chapter 4: Results
Sara Pinna
Proteomic analysis of human plasma and Peripheral Blood Mononuclear Cells in Systemic Lupus Erythematosus patients
International PhD School in Biomolecular and Biotechnological Sciences-University of Sassari
38
Plasma proteins identification
Of the eight differentially expressed spots, four increased in intensity values both in SLE patients and in RA patients compared with healthy subjects (Figure 11).
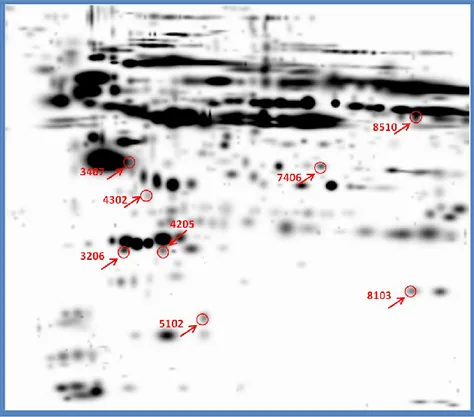
Figure 11: Differentially expressed protein spots on plasma gel
These proteins have been identified as Crystal Structure Of Lipid-Free Human Apolipoprotein A-I (two spots), apolipoprotein J precursor or clusterin, aptoglobin or HP protein, ficolin-2 isoform, Crystal Structure Of Fibrinogen Fragment D. One spot, identified as apolipoprotein E is overexpressed in RA patients compared with healthy controls; another spot identified as Chain B, Crystal Structure Of Fibrinogen Fragment D is up-regulated in SLE patients with respect to healthy subjects (Table 3).
Chapter 4: Results
Sara Pinna
Proteomic analysis of human plasma and Peripheral Blood Mononuclear Cells in Systemic Lupus Erythematosus patients
International PhD School in Biomolecular and Biotechnological Sciences-University of Sassari
39
Table 3
Mass spectrometric identification of spots using the Mascot search engine. In the table are reported SSP number, NCBInr accession number, protein name, their fold regulation values (ratio), molecular weight (MW) in daltons (Da), isoelectric point (pI), sequence coverage (C%) and matching peptides (QM).
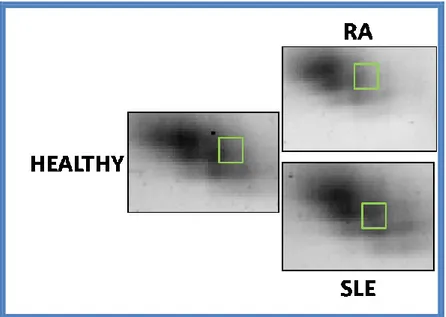
Among the identified proteins, we decided to carry out further analyses only on clusterin, because it is the only protein that shows a significant increase in the mean intensity values in SLE patients compared both in healthy that pathological controls (Figure 12).
Chapter 4: Results
Sara Pinna
Proteomic analysis of human plasma and Peripheral Blood Mononuclear Cells in Systemic Lupus Erythematosus patients
International PhD School in Biomolecular and Biotechnological Sciences-University of Sassari
40
Figure 12: Zoom on the position of clusterin in Plasma gel (ssp 3407)
In Table 4 and 5 are reported the protein spots whose identifications were con-firmed also with LC-MS/MS analyses
Table 4
Mass spectrometric identification of spots using the Mascot search engine. In the table are reported SSP number, SWISS Prot accession number, protein name, molecular weight (MW) in Kilo daltons (KDa), cal-culated isoelectric point (Calc pI), sequence coverage (C%), and ion score.
Chapter 4: Results
Sara Pinna
Proteomic analysis of human plasma and Peripheral Blood Mononuclear Cells in Systemic Lupus Erythematosus patients
International PhD School in Biomolecular and Biotechnological Sciences-University of Sassari
41
Table 5
Mass spectrometric identification of spots using the Mascot search engine. In the table are reported SSP number, SWISS Prot accession number, protein name, molecular weight (MW) in Kilo daltons (KDa), cal-culated isoelectric point (Calc pI), sequence coverage (C%), and ion score.
Chapter 4: Results
Sara Pinna
Proteomic analysis of human plasma and Peripheral Blood Mononuclear Cells in Systemic Lupus Erythematosus patients
International PhD School in Biomolecular and Biotechnological Sciences-University of Sassari
42
Western blot analysis
To validate the proteomic analysis data, western blot analysis for Peroxiredoxin 2 were performed. The Figure 13 shows the bands detected by this antibody on a 1-D gel when 50 µg of total protein extracts were loaded per well.
Our data showed that expression of the Peroxiredoxin 2 (PRDX2) protein was significantly increased in the SLE PBMCs (2.4 folds) compared to healthy subjects (Fig-ure 14, p-value= 0.025). This finding was consistent with the proteomic analysis data.
Figure 13: One-dimensional western blot analysis. PRDX2 and GAPDH immunodetection to assess PRDX2
up-expression in SLE patients.
Figura 14: Bar charts reporting PRDX 2 relative abundance in Healthy, SLE and RA subjects. Following
da-ta normalization, PRDX 2 was confirmed as differentially expressed in SLE patients compared to healthy controls (p= 0.025) and also for RA patients vs healthy controls (p = 0.05).
Chapter 4: Results
Sara Pinna
Proteomic analysis of human plasma and Peripheral Blood Mononuclear Cells in Systemic Lupus Erythematosus patients
International PhD School in Biomolecular and Biotechnological Sciences-University of Sassari
43
ELISA
We wanted to quantify with a reliable technique the clusterin concentration in our plasma samples, using an available commercial kit for human clusterin.
We found significative differences between the SLE groups versus RA patients. The table below shows the ANOVA result.
Table 6: Comparison of clusterin levels among enrolled individuals.
Chapter 4: Results
Sara Pinna
Proteomic analysis of human plasma and Peripheral Blood Mononuclear Cells in Systemic Lupus Erythematosus patients
International PhD School in Biomolecular and Biotechnological Sciences-University of Sassari
44
Cytokines Analysis
Table 7 shows the cytokines analysed, and figures 15-17 show the box plots for each analyte.
Cytokine levels that were not detectable were considered to be zero. To inves-tigated the reproducibility of cytokine levels in patients with SLE, RA and healthy trols we used a two-tailed Kruskal–Wallis test. The p-values less than 0.05 were con-sidered to be statistically significant. Table 8 reports the cytokines statistically signifi-cant with the correspondig p-values.
Chapter 4: Results
Sara Pinna
Proteomic analysis of human plasma and Peripheral Blood Mononuclear Cells in Systemic Lupus Erythematosus patients
International PhD School in Biomolecular and Biotechnological Sciences-University of Sassari
45
Figure 15: Levels of plasma Th17 cytokines in the different groups. Cytokines are expressed as pg/ml.
The median levels in the three groups (SLE, RA, Healthy) were respectively: IL-1 2.26, 1.53, 1.29; IL-4 0.12, 0.12, 0.12; IL-6 1.4, 11.46, 0.2; IL-10 1.38, 9.94, 1.38; IL-17A 26.64, 20.40, 35.87; IL-22 6.34, 10, 6.34; IL-25 0.45, 1.38, 0.45; IL-33 26.56, 35.17, 26.56; IFN- 76.40, 62.87 34.93; TNF-0.72, 4.97, 0.72;
Chapter 4: Results
Sara Pinna
Proteomic analysis of human plasma and Peripheral Blood Mononuclear Cells in Systemic Lupus Erythematosus patients
International PhD School in Biomolecular and Biotechnological Sciences-University of Sassari
46
Figure 16: Levels of plasma chemokines in the different groups. Cytokines are expressed as pg/ml. The
median levels in the three groups (SLE, RA, Healthy) were respectively: IL-8 7.32, 8.73, 5.95; MCP-1 66.67, 72.46, 27.39; MIP-1 1.78, 1.37, 1.62; MIP-183.78, 63.72, 46.38; IP-10 621.38, 476.36, 363.34. *p-value<0,05, **p-value<0,001.
Figure 17: Levels of others cytokines in the different groups. Cytokines are expressed as pg/ml. The
me-dian levels in the three groups (SLE, RA, Healthy) were respectively: IL-1ra 645.91, 223.150, 150.95; IL-5 3.75, 2.49, 1.98, IL-7 16.47,8.55, 7.35; IL-12(p70) 29.44, 13.51, 12.19; VEGF 0.62, 20.785, 0.62.*p-value<0,05.
Chapter 4: Results
Sara Pinna
Proteomic analysis of human plasma and Peripheral Blood Mononuclear Cells in Systemic Lupus Erythematosus patients
International PhD School in Biomolecular and Biotechnological Sciences-University of Sassari
47