UNIVERSITÀ DELLA TUSCIA - VITERBO
FACULTY OF AGRICULTURE
DEPARTMENT OF TECHNOLOGY, ENGINEERING AND
ENVIRONMENTAL SCIENCE AND FORESTRY
PhD Course
SCIENCES AND TECHNOLOGIES FOR FOREST AND
ENVIRONMENT MANAGEMENT XXII - cycle
EXPERIMENTAL APPLICATION OF THE CONCEPT OF
"TOTAL MAXIMUM DAILY LOAD" IN THE WATERSHED
PLANNING UNDER THE WATER FRAMEWORK DIRECTIVE
AGR/10
Gerardina Santese
Coordinator: Prof. Gianluca Piovesan Tutor: Dott. Antonio Lo Porto Tutor: Dott.ssa Maria Nicolina Ripa
UNIVERSITÀ DELLA TUSCIA - VITERBO
FACOLTÀ DI AGRARIA
DIPARTIMENTO DI TECNOLOGIE, INGEGNERIA E SCIENZE DELLE
FORESTE E DELL‟AMBIENTE
CORSO DI DOTTORATO
SCIENZE E TECNOLOGIE PER LA GESTIONE FORESTALE E
AMBIENTALE XXII - ciclo
APPLICAZIONE SPERIMENTALE DEL CONCETTO DI
"TOTAL MAXIMUM DAILY LOAD" NELLA PIANIFICAZIONE DI
BACINI IDROGRAFICI NELL’AMBITO DELLA WATER
FRAMEWORK DIRECTIVE
AGR/10Gerardina Santese
Coordinator: Prof. Gianluca Piovesan Tutor: Dott. Antonio Lo Porto
Tutor: Dott.ssa Maria Nicolina Ripa
"Only after the last tree has been cut down, Only after the last river has been poisoned, Only after the last fish been caught.... Only then you will find that money cannot be eaten"
i
ACKNOWLEDGEMENTS
I met a lot of people during the last three years and I would like to thank all of them for their support and friendship; obviously, the following words are not sufficient to express my sincere appreciation.
First of all a sincerely and warm thanks goes to my supervisor, Dr. Antonio Lo Porto, researcher at the Water Research Institute of the National Research Council in Bari, who gave me the opportunity to pursue the Ph.D. Thanks for his kindest personal guidance, support and friendship during my first steps into the watershed management studies; for all the opportunities allowed and for his trust demonstrated.
It‟s hard to find the right words to express my thanks to a special person met three years ago, Anna Maria De Girolamo, a researcher at the Water Research Institute in Bari. Her sincerely friendship, first of all, and her constant support, helped me during the difficulties; she offered me all her knowledge on hydrological modeling. A special person will be forever for me. Another person who goes my friendly thanks is Aziz, we started together the adventure into the knowledge of SWAT model and many times was helpful for me to exchange experiences on modelling. A really thanks for his friendship and sympathy, for the significant and funny moments experienced together, particularly in Temple (Texas).
Special thanks go to the peoples of the Water Research Institute of Bari that have been and will be my friends in Bari without them everything would be much more difficult.
I would like to express my gratitude to the SWAT team in Temple, Texas, at the Grassland
Soil and Water Research Laboratory of the U.S. Department of Agriculture, which allowed me to
learn much more on the SWAT model during the stage in the lab. A special thank goes to Dr. Jeffrey Arnold, the Research Leader, who give the opportunity to work with him and improve the knowledge on SWAT. Sincerely thanks also to Mike White from which I learned scientific and technical aspects of SWAT model. I remember and thank all the people that helped me to feel like at home there.
I would like sincerely thank the Prof. Srinivasan, director of Texas A&M University Spatial Sciences Laboratory and professor in the Departments of Ecosystem Science and Management and Biological and Agricultural Engineering (U.S.), for the opportunity to stay at the Texas A&M University and for his guidance on SWAT model calibration.
A warm thank also to Courtney Swyden for the friendly hospitality in College Station and also to Puspha Tuppaud for her help with SWAT at the lab and the relaxing walks.
ii I am grateful to the Water Research Institute of the National Research Council for providing the financial support with the scholarship.
iii
Abstract
The Water Framework Directive 2000/60/CE (WFD) was enacted in order to maintain and improve the aquatic environment of the Union. The protection of waters, in terms of quality and quantity, is one of the key aspects of the Directive, which requires the achievement of “good ecological status” for all water bodies by 2015. In many European countries the process of implementation of the WFD has required important changes in the development of the water management plans.
The River Basin Management Plan was indicated as the process to adopt for investigates the current status of the water bodies and define the “Programme of Measures” that permit to reach the objective of “good ecological status”.
This dissertation can be part of the definition process of a “Programme of Measures” for impaired waters through the application of a scientifically based method in order to define the “objective” to achieve, identify the measures to be taken and then evaluate their effectiveness. The method applied fulfills the requirement of the WFD within the directive to manage both types, punctual and diffuse, of pollution sources causing the deterioration of the ecological status of all European water bodies.
The management of punctual and diffuse sources requires to establish a link between input loads and the water quality standards of the receiving water bodies.
In this dissertation, the use of the concept of the “Total Maximum Daily Load” (TMDL) was applied for an Italian river. The TMDL is an instrument required in the Clean Water Act in U.S.A for the management of water bodies classified impaired. The TMDL calculates the maximum amount of a pollutant that a waterbody can receive and still safely meet water quality standards. It permits to establish a scientifically-based strategy on the regulation of the emission loads control according to the characteristic of the watershed/basin.
The implementation of the TMDL is a process analogous to the Programmes of Measures required by the WFD, the main difference is the analysis of the linkage between loads of different sources and the water quality of water bodies.
The TMDL calculation was used in this study for the Candelaro River, an intermittent Italian river, classified impaired in the first steps of the implementation of the WFD.
The “Load Duration Curves” methodology was adopted for the calculation of nutrient TMDLs due to the more robust approach than the expression based on average long term flow
iv conditions. This methodology permits to establish the maximum allowable loads across to the different flow conditions of a river.
This methodology allowed: to evaluate the allowable loading of a water body; to identify the sources and estimate their loads; to estimate the total loading that the water bodies can receives meeting the water quality standards established; to link the effects of point and diffuse sources on the water quality status and finally to individuate the reduction necessary for each type of sources.
The loads reductions were calculated for total nitrogen, total phosphorus and ammonia. The measures simulated gave results that show a remarkable ability to reduce the pollutants, for the Candelaro River. This reduction, anyway, is not enough to achieve the objective of water suitable for fish life.
The use of a mathematical model on a watershed scale, the Soil and Water Assessment Tool (SWAT), was applied in order to obtain a daily flow dataset of the Candelaro River and a daily water quality for a longer period than the measured data. The use of the model permitted to obtain a robust assessment of the present and future water quality status overcoming the lack of measured data.
The results highlighted the critical condition of water quality particularly during the dry periods and the necessity to adopt specific measures for each flow conditions, not related to the seasonality, to restore the water surface quality status of the Candelaro River.
v
Riassunto
La Direttiva Quadro Europea sulle Acque (2000/60/CE) (Water Framework Directive - WFD) è emanata allo scopo di mantenere e migliorare l‟ambiente acquatico del territorio dell‟Unione. La protezione delle acque, dal punto di vista qualitativo e quantitativo, riveste uno degli aspetti basilari della Direttiva, che richiede il raggiungimento di un buono stato ecologico di tutti i corpi idrici Europei entro il 2015. Per molti Stati Europei il processo di implementazione della WFD ha richiesto l‟attuazione di sostanziali modifiche nella predisposizione dei Piani di Gestione delle Acque. Il Piano di Gestione del Bacino Idrografico è indicato come lo strumento da adottare nel processo di pianificazione, in esso è riportata la valutazione dello stato attuale delle acque ed è definito un “Programma di Misure” che permetterà di raggiungere l‟obiettivo di “buono stato ecologico”.
Questo studio s‟inserisce nell‟ambito della definizione di un “Programma di Misure”, per un bacino italiano, attraverso l‟applicazione di un metodo scientifico che stabilisce gli obiettivi da raggiungere, individua le misure da adottare e ne valuta l‟efficacia.
Il metodo sperimentato risponde al principio guida della WFD nell‟ambito della gestione integrale delle fonti inquinanti che determinano il deterioramento dello stato ecologico dei corpi idrici dell‟Unione. Introducendo la necessità di gestire anche le fonti diffuse, non più solo quelle puntuali, in ciascun bacino idrografico degli Stati membri diviene importante mettere in relazione i carichi derivanti da ciascuna fonte e gli standard di qualità definiti per il corpo idrico recettore.
In questo studio è stato valutato l‟utilizzo del concetto di “Total Maximum Daily Load” (TMDL), ovvero carico massimo totale giornaliero, uno strumento richiesto dal Clean Water Act, negli U.S.A, per la gestione dei corpi idrici inquinati. Il concetto base del TMDL è di valutare i carichi totali derivanti, sia dalle fonti diffuse sia da quelli puntuali, che un corpo idrico può ricevere pur mantenendo gli standard di qualità per esso stabiliti. Tale metodo permette di definire una strategia, scientificamente basata, per il controllo delle emissioni dei carichi, in relazione alle caratteristiche del bacino. Il processo di implementazione del TMDL è analogo a quello del Programma di Misure richiesto dalla WFD, la sostanziale differenza si riscontra nel processo di analisi che mette in relazione i carichi derivanti dalle diverse fonti inquinanti e la qualità dei corpi idrici. In questo studio è stato utilizzato il calcolo del TMDL per il Candelaro, un fiume intermittente Italiano, classificato altamente inquinato durante i primi processi di attuazione della WFD. Per il calcolo del TMDL di nutrienti è stata adottata
vi la metodologia della “Curva di Carico” che permette di definire un carico massimo accettabile in relazione alle diverse condizioni di portata di un fiume, un fattore di particole rilievo nel caso di fiumi intermittenti che mostrano notevoli variazioni di portata durante l‟anno.
L‟utilizzo della metodologia del TMDL ha consentito di: di identificare le fonti inquinanti e stimare i carichi da esse derivanti; di valutare il carico totale inquinante ammissibile che il corpo idrico può ricevere in base alla destinazione finale assegnata; di individuare quali sono gli effetti che ciascun tipo di fonte ha sulla qualità del corpo idrico e infine di individuare e calcolare le riduzioni necessarie per ciascun tipo di fonte inquinante al fine di raggiungere l‟obiettivo stabilito.
I risultati hanno mostrato una notevole capacità di riduzione degli inquinanti ma l‟inefficacia a raggiungere uno stato delle acque idonee alla vita dei pesci.
Un modello matematico a scala di bacino, Soil and Water Assessment Tool (SWAT), è stato utilizzato per ottenere una serie di dati giornalieri di portata e di qualità delle acque per un periodo più lungo di quello dei dati misurati disponibili. L‟utilizzo del modello ha permesso di effettuare una valutazione più rappresentativa dello stato attuale e futuro del corpo idrico caratterizzato da una assenza o scarsità di dati misurati. I risultati hanno rilevato le condizioni critiche dello stato qualitativo delle acque particolarmente durante i periodi secchi e la necessità di adottare misure diverse in relazioni alle condizioni di portata e non di stagionalità per migliorare lo stato qualitativo delle acque del Candelaro.
vii
TABLE OF CONTENTS
CHAPTER 1 - INTRODUCTION ... 1
1.1 GENERAL INTRODUCTION... 1
CHAPTER 2 - WATER POLLUTION LAWS ... 4
2.1 EUROPEAN WATER FRAMEWORK DIRECTIVE ... 4
Implementation guidelines ... 6
Assessment of current status... 7
Ecological classification ... 7
Chemical classification for priority substances and other pollutants ... 7
Environmental quality standards ... 8
Programme of Measures ... 9
2.2 WFD IMPLEMENTATION IN ITALY ... 10
2.3 WATER LEGISLATION IN USA ... 12
2.4 WHAT IS A TOTAL MAXIMUM DAILY LOAD (TMDL)? ... 14
CHAPTER 3 - DEVELOPMENT OF NUTRIENTS TMDLS ... 18
3.1 PROTOCOL TO DEVELOP A NUTRIENT TMDL ... 18
3.2 METHODOLOGIES FOR TMDLs CALCULATION ... 23
3.3 TMDL CALCULATION ... 27
CHAPTER 4 - CASE STUDY CANDELARO RIVER BASIN ... 29
4.1 GENERAL DESCRIPTION ... 29
Climate ... 30
Geology ... 32
Watershed hydrology ... 33
Soils ... 35
Land use and cover condition ... 36
Pressures on water quality ... 40
4.2 IMPLEMENTATION OF WATER FRAMEWORK DIRECTIVE ... 42
Assessment of current water surface quality status ... 44
Monitoring network ... 46
Environmental Quality Objectives ... 49
Programme of Measures ... 49
Monitoring program ... 51
CHAPTER 5 - WATER QUALITY MODELLING WITH THE SOIL AND WATER ASSESSMENT TOOL FOR TMDL ... 52
viii
5.2 THE SOIL AND WATER ASSESSMENT TOOL (SWAT) ... 53
Hydrology of the SWAT model ... 54
Water quality modelling with SWAT ... 56
In-stream water quality modeling ... 59
Data Inputs ... 60
The preprocessing phase ... 61
Watershed delineation ... 62
Watershed delineation results ... 64
Land use ... 65
Climatic data ... 67
Emission data ... 67
Results ... 69
Calibration ... 70
Water budget estimation ... 75
Nutrients results ... 77
Determining the effectiveness of different mitigation measures using SWAT ... 82
Measures simulated to reduce pollution ... 82
Pollutant load reductions results ... 83
CHAPTER 6 - TMDL CALCULATION FOR CANDELARO RIVER ... 85
6.1 DEVELOPMENT OF THE DAILY LOAD EXPRESSION ... 85
Steps in developing the load duration curve for Candelaro River and results ... 87
Interpretation of Results ... 90
Advantages and Disadvantages ... 90
6.2 TMDL ALLOCATION EXPRESSION ... 91
Calculation waste loads allocation ... 93
Calculation Loads allocation ... 93
6.3 CURRENT DEVIATION FROM TARGET ... 94
6.4 IMPLEMENTATION STRATEGIES EFFECTS ON NUTRIENT TMDL ... 100
CHAPTER 7 - CONCLUSION ... 104
ix
LIST OF FIGURES AND TABLES
Figure 1: Classification of surface water bodies. ... 8
Figure 2: Components of TMDL developments (U.S. Environmental Protection Agency, 1999. Protocol for Developing Nutrient TMDLs). ... 19
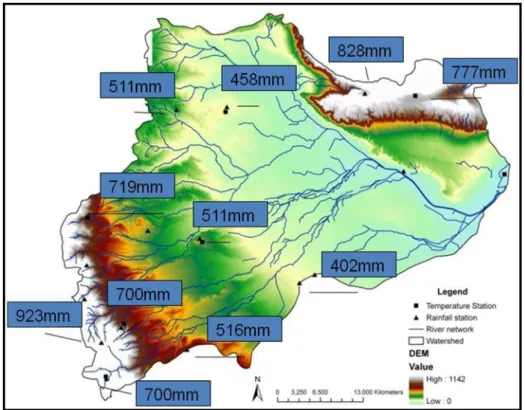
Figure 4: Average monthly precipitation at watershed scale. ... 31
Figure 5: Rainfall stations and average annual precipitation (1990-2004). ... 32
Figure 6: Measured daily flow of Candelaro River at gauge “Bonifica 24” (1970-1973). ... 33
Table 1: Hydrologic parameters of Candealro River and main tributaries. ... 34
Figure 8: Land use map during the winter period. ... 38
Figure 9: Land use map during the summer period. ... 38
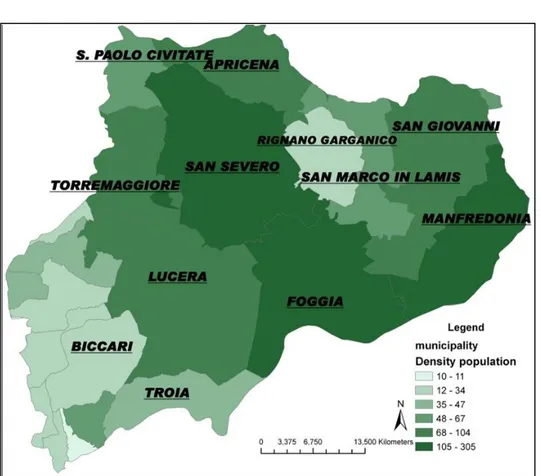
Figure 10: Municipalities and related population density. ... 39
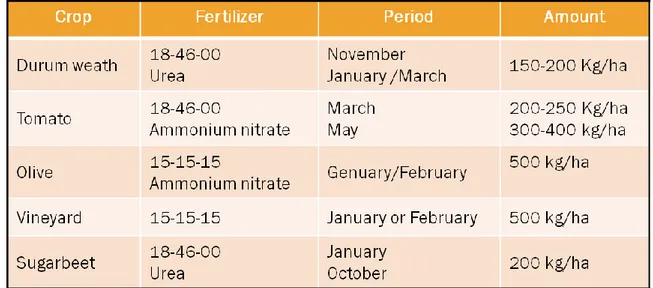
Table 2: Fertilizer operation: type, rate and period of application. ... 40
Table 3: Point source loads. ... 41
Figure 12: Monitoring network of river flow. ... 47
Figure 13: Surface water quality monitoring network. ... 48
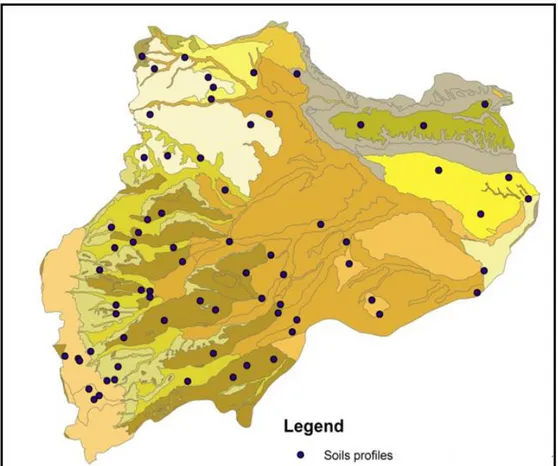
Figure 14: Soil maps and soil samples coordinate (Project ACLA2). ... 64
Figure 15: Subbasin delineation of Candelaro watershed. ... 65
Figure 17: SWAT soil map reclassified with the personal soil database. ... 67
Figure 19: Simulated and measured daily flow (cms) at Celone station. Calibration (1990-1991): NSE=0.59; R2=0.77. Validation (1994-1996): NSE=0.48; R2=0.53. ... 73
Figure 20: Monthly scatter plot with regression R2 and 1:1 line at Celone station on daily basis. ... 73
Figure 21: Simulated and measured daily flow (cms) at Salsola station. Calibration (1990-1992): NSE=0.53; R2=0.56. Validation (1995-1996): NSE=0.41; R2=0.46 ... 74
Figure 22: Monthly scatter plot with regression R2 and 1:1 line at Salsola station on daily basis. ... 74
Figure 23: Surface runoff contributions from subbasins. ... 76
Figure 24: Simulated and measured TN (Kg/ha) at the sampling station 2 (2002-2004). ... 78
Figure 25: Simulated and measured P tot (Kg/ha) at the sampling station 2 (2000-2004). ... 78
Figure 26 :Calibrated result of NH4 concentration at Candelaro River station 2 (2002-2004). ... 79
x Figure 28: GIS map of organic phosphorus (kg/ha) and sediment yield (t/ha) SWAT output at ... 81 Figure 29: Reductions in nutrient loadings for the two scenarios at watershed scale. ... 84 Figure 30: Flow Duration Curve for Candelaro River (years 1990-2004). ... 87 Figure 31: Total Nitrogen load duration curve at water quality criteria (50 mg/l) for Candelaro River simulated value (1990-2004) - sample data (2002-2004). ... 89 Figure 33: Ammonia load duration curve at water quality criteria (0.14 mg/l) for Candelaro River simulated value (1990-2004) - sample data (2002-2004). ... 89 Figure 32: Total Phosphorus load duration curve at water quality criteria (0.14 mg/l) for Candelaro River simulated value (1990-2004) - sample data (2002-2004). ... 89 Figure 34: Flow Duration curve and flow range conditions for Candelaro River. ... 92 Table 7: Summary of total Nitrogen (TN) TMDL for Candelaro River and load reductions required. ... 94 Table 8: Summary of Ammonia (NH4) TMDL for Candelaro River and load reductions required. ... 95 Table 9: Summary of Total Phosphorus TMDL for Candelaro River and load reductions required. ... 98 Figure 35: Waste loads (WLAs) contribution to the actual loads. ... 98 Figure 36: Waste loads of total Phosphorus. ... 99 Table 10: TN load reductions for each flow condition implementing measures at watershed scale. ... 100 Table 11: TP load reductions for each flow condition implementing measures at watershed scale. ... 101 Table 12: NH4 load reductions for each flow condition implementing measures at watershed scale. ... 101 Table 13: TP load reduction needed after the implementation of "measures" to meet the allowable TMDL. ... 102 Table 14: NH4 load reduction needed after the implementation of "measures" to meet the allowable TMDL. ... 102
1
CHAPTER 1 - INTRODUCTION
1.1 GENERAL INTRODUCTION
The fundamental change in the European water policy started on 2000 with the establishment of a legal framework for community action in the field of water management across Europe. The official title of this new water policy is Water Framework Directive 2000/60/CE (WFD); it points out the importance of water protection for the future in all the European States. The goal of the Directive is to achieve a “good status” for all surface waters and groundwater by 2015. The challenges introduced by WFD in the water management require adopting new strategies for all European States.
The introduction of a holistic vision requires to manage all type of sources, punctual and diffuse sources that are responsible of the deterioration or “bad” water quality status. The previously system based on emission control, effluent quality control and nutrient load regulation, was not linked to the water quality status of surface water bodies.
The WFD requires to assess the current status of water bodies, to indentify the objective (e.g. “good ecological status”) and the pressures, and finally to establish a “Programme of Measures” that will improve or permit to reach the ecological objective defined for the specific destination of the water body.
In the process of implementation of the WFD, that in many European country is still now in progress, member states had to present the management plans for their river basins by the end of 2009. These plans have to specify the measures to adopt for achieve “good status” (Article 13 and Annex VII of the Directive).
The assessment of current status is a preliminary step before to develop a River Basin Management Plan (RBMP), the evaluation of gaps with the objective of Directive permit to specify the measures to be implemented. The assessment of the actual status of all the water bodies often was conducted using calculation that not permitted to evaluate all the hydrologic aspects. The Directive outlines also the importance of understand the effect of changing pressures, including seasonal, on that status to define programmes that permit really to reach the objective. The Programme of Measures was indicated in many draft of the RBMPs without evaluate the effectiveness of the implementation on the water quality status in the future.
2 The objective of this dissertation is to apply a methodology, for the first time in Italy and in Europe, as supporting method to develop the Programme of Measures a methodology applied from many years in the U.S.A.
The U.S., within the federal water legislation, Clean Water Act (CWA) adopts a similar approach similar to the European to reduce water pollution but a different method to establish the measures. The method indicated in the CWA, to manage the pressures in the watershed, is the “Total Maximum Daily Load” (TMDL) that establishes the loads that a water body can receive and maintain the water quality standards established.
The overall objective of this dissertation is to study, test and apply the TMDL calculation for an Italian intermittent river as a supporting method for the application of the WFD.
This work will be a part of a European project of the Seventh Framework Programme on environment with the title “MIRAGE - Mediterranean Intermittent River ManAGEment”,
(see www.mirage-project.eu ), aimed to support the development of the RBMP for one of the
mirror basins adopted in the project: the Candelaro River. The MIRAGE project aims to provide specific key knowledge for a better assessment of ecological integrity in Mediterranean temporary streams. Within the framework of the project there is the development of practical measures necessary to understand their impact on nutrient dynamics, toxic substances and organic matter and to link these aspects to an integrated flood management. The goal of the project is to co-develop a River Basin Management Plan to support the applicability of the WFD for temporary river. The scientists involved in the project highlighted that an adequate implementation of the WFD and the development of RBMP, including the Programme of Measures for temporary streams, urgently require new concepts of hydrological and ecological characterization, as well as a revised and better integrated understanding of the impact of management measures, both under extreme floods and in the context of seasonal dry periods.
This dissertation will help to assess the current status of the Candelaro River to individuate the critical condition and to assess the main pressures during the different flow conditions. The TMDL is a different approach that can help to individuate the measures and it is a helpful method to asses in the future the progress in the implementation of the measures established. Without adequate characterizations of the problems appropriate solutions for the restoration plans cannot be identified and implemented.
The application of mathematical model, to assist policy, is proved, in many studies, that are useful tool to assist in the understanding of hydrological, chemical transport and processes
3 that occur in watersheds, to understand the response to anthropogenic alterations that affect them and also to evaluate the effect of scenarios. In this study the watershed loading/water quality model, Soil and Water assessment Tool (SWAT) (Arnold et al., 1998) was used to investigate the hydrologic processes, to assess the actual water quality status of Candelaro River and finally to quantify the efficiency of some measures individuate in the Program of Measures developed by the River Basin Authority of Apulia Region, defined without any evaluation of their effectiveness to reach the objectives.
The design standards and the driving legislative frameworks in Europe, Italy and the United States were compared; similarities and differences between the policies were outlined. The protocol to develop the WFD and the transposition into Italian law were described, a detailed implementation process was described only for the Candelaro River Basin due to the differences that can be found among the RBMPs developed in Italy and in Europe.
The protocol to develop a nutrient TMDLs, indicated in the guidance of USEPA for impaired waters in USA, was described. The different TMDL‟s methodologies used in US to calculate Nutrients were investigated in order to choose the more adequate to apply for the Candelaro River.
Using the TMDLs calculation, for total nitrogen, total phosphorus and ammonia, was possible to analyze the target of the problems, allocate the processes among the sources and finally to calculate the reduction needed for each nutrient. The “Load Duration Curves” methodology was adopted for the calculation of nutrient TMDLs due to the more robust approach than the expression based on average long term flow conditions. This methodology permits to establish the maximum allowable loads across to the different flow conditions of a river; this is particularly relevant for intermittent river. It provides also a visual display for people to better understand: the problem; the TMDL targets; frequency and magnitude of the water quality standards; the allowable loads of each nutrients and the magnitude of loading reduction. The load duration curve is very useful to understand and differentiate the problems between non point sources and point sources.
4
CHAPTER 2 - WATER POLLUTION LAWS
2.1 EUROPEAN WATER FRAMEWORK DIRECTIVE
The environmental policy concerning water preservation is well established with the EU Water Framework Directive 2000/60/EC (OJ L 327).
The key objective of the Directive is to achieve “good water status” for all European waters by 2015. The intent of WFD is to redesign the overall normative outlines concerning the protection of all water, both above and below ground.
The European water policy began in the 1970s with the adoption of the first directives which focused on water quality objectives.
There was a second wave of European directives in the early 1990s, with several directives (thirteen) based on the emission limit value approach. Several major directives were adopted at that time, including those on urban waste water treatment and on nitrates. However, at the end of the century, European regulations were relatively fragmented and did not provide a clear vision of European water policy. The WFD was prepared with the goal of ensuring the overall consistency of European water policy on the basis of a common objective of “good status”.
The WFD contains the following key points:
– The WFD concerns all the waters in Europe and aims at preventing further deterioration, at protecting and enhancing the status of aquatic ecosystems.
– There is a general objective to attain “good status” for all waters by 2015. This implies characterizing the chemical and ecological status of all waters, the development of measures (including legislation based on a combined approach of emission limit values and quality standards) and management plans to attain this good status.
Innovations in water policy with WFD
The WFD puts water bodies at the center of water policy, rather than water uses or functions. This change in focus can be regarded as a “green” revolution.
5 Another revolutionary idea reported in the WFD is the attention on all types of waters, not only river and lakes, but also ground water and estuarial and coastal waters.
The Integrated River Basin Management requires a number of changes in comparison with previous water management, namely considering the whole territory of the river basin instead of the lines of the rivers in the landscape. The area of interest of the administration shifts from the territory of the State or of a Region towards the consideration of bioregional catchments areas, one of the effects is the transboundary administration of river basin.
In the past some States only considered chemical parameters to assess water quality, others simply biological parameters and nobody considered morphology. The quality criteria are now based simultaneously on the biology, chemistry, morphology and the flow characteristics of water.
The integration of water quantity and water quality in one single management system is a challenge for many EU countries. Traditionally there were different sectors of the public administration system for the water quality protection and for water quantity management. The new holistic vision also includes the management of punctual and diffuse sources that are responsible of the deterioration or bad water quality status.
In the past, and in some countries today, the role of water managers was to build the infrastructure systems necessary to protect humans from water or deliver water to the humans, or to collect water for irrigation demand of water supply, generally through pipes or canals. As they were required to fulfill society‟s needs through engineering works, water managers regarded the protection of ecosystems as an obstacle to their objectives. The WFD requires an integrated approach to watershed management more focused on environmental protection. Another innovation is the economics arguments; the WFD requires the selection of measures based on economic analysis. It‟s the first time that an environmental Directive has an impact on the decision making in public finance, normally the public finance was considered very important at political level while environmental had to accept the consequences of the decisions.
Public Participation plays a key role in the implementation of the WFD. During the decision process all stakeholders are invited to contribute actively to the planning process by discussing issues and contributing to the solution.
6
Implementation guidelines
Member States are obliged to identify their national and international river basins and assign these to so called “River Basin districts”. For all districts, six-yearly River Basin Management Plans (RBMP) and programs have to be developed.
River basin planning is the process of collecting and analyzing river basin data and evaluating management measures in order to achieve the objectives of the WFD within prescribed timescales.
The river basin planning process is followed by implementation of Programme of Measures for the achievement of “good status” and is subject to public consultation, according to the requirement of social participation and transparency during the individuation of measures. The planning process together with the implementation of the Program of Measures is often referred to as River Basin Management.
According to the Directive, the general approach for water planning contains the following main components:
Setting the scene (identification of River Basin District).
Assessment of the current status and analyze preliminary gaps (identification of pressures and assessment of their impacts).
Setting up of the environmental objectives. Establishment of monitoring programs.
Gap analysis (comparison of the current status with environmental objectives). Setting up of the Programmes of Measures (POMs).
Development of River Basin Management Plans.
Implementation of the Programmes of Measures and prepare the interim report on the implementation.
Evaluation the first and the second period.
Information and consultation of the public, active involvement of interested parties. The planning process is not a linear process; all the components are involved in a non-linear iterative way (CIS, 2003).
7
Assessment of current status
In the Annex V of WFD all the elements that permit to classify the surface and groundwater status are reported.
The definition of “good status” for surface water results from a set of criteria concerning the biological and the physico-chemical status specified with their monitoring approaches and threshold values by the Member States.
The status of each surface water body is judged using separate „Ecological classification‟ and „Chemical classification‟ systems. The overall status of the water body will be determined by whichever of these is the poorer. To achieve „good status‟ overall, a water body must achieve both good ecological and good chemical status.
Ecological classification
The Ecological classification system has five classes, from high to “bad”, and uses biological, physico-chemical, hydromorphological and chemical assessments of status.
Biological assessment uses numeric measures of communities of plants and animals (e.g. fish and rooted plants). Physico-chemical assessment considers elements such as temperature and the level of nutrients, expressed in concentration limit value corresponding to the Emission limit value. The hydromorphological assessment looks at water flow and physical habitat. The Directive only gives definitions for three classes for these quality elements (high, good and moderate status).
Chemical classification for priority substances and other pollutants
The WFD report only two classes, „good‟ or „failing to achieve good‟, for the chemical classification for surface waters, that have to be used for the most polluting substances (mercury, cadmium, hexachlorocyclohexane and dangerous substances). The water has to meet Environmental Quality Standards (EQSs) for substances listed in Annex IX (Dangerous Substances Directive and associated daughter directives) and Annex X (WFD Priority List Substances). These standards are set on a European-wide basis and are considered a priority because of their high potential for pollution.Figure 1 provides an example of how to classify the surface waters status derived from the monitoring activities.
8
Figure 1: Classification of surface water bodies.
Groundwater classification uses two systems: „Groundwater quantitative‟ status, which assesses whether there is sufficient water to maintain the health of the ecosystems it feeds, and „Groundwater chemical status‟, which assesses the chemical quality against certain criteria. The Groundwater Daughter Directive details the criteria for chemical status.
The WFD looks at the way groundwater and surface waters interact, so groundwater body cannot be at good status if it causes an associated surface water body to fail its ecological or chemical status objective, or causes significant damage to a groundwater dependant wetland ecosystem. As with surface waters each groundwater body has to be classified.
On the basis of the assessed status, two classes can be defined: good and poor.
Quantitative and chemical status must be good before classifying the groundwater body as good.
Environmental quality standards
Environmental Quality Standards (EQSs) are the values for water quality, water quantity and habitat structure defined to ensure that the right environmental conditions are created to
9 support the biology. The standards will relate to and define the class boundaries for ecological and chemical classification schemes, and helps to decide what measures need to be taken to protect the water environment. For example, water quality standards define the quantity of a pollutant that can safely be present in the water environment without causing harm to the ecology.
This approach is used also for protecting the water environment from pollution and for licensing water abstraction. To implement the WFD, the environmental standards have to be identified and then used to protect the ecology from other pressures, such as over-abstraction and damaging engineering works.
Surface water chemical environmental standards for use in the Chemical classification are the EQSs in existing EU legislation such as the Dangerous Substances Directive, and the new Priority Substances and Priority Hazardous Substances. These standards are being agreed at EU level for a Priority Substances Daughter Directive.
Programme of Measures
According to the water planning, after the assessment of current status of water bodies the settlement of Programme of Measures (POMs) (Article 11 WFD) has to be defined.
The analysis of pressures (e.g. an inventory of significant point and diffuse sources) and impacts (e.g. an assessment of exceedance of national or international environmental quality standards) for priority substances and pollutants is important for the preparation of the programme of measures.
The Program of Measures consist of defining, for each district, the regulatory provisions or basic measures to be implemented in order to achieve the objectives defined for 2015 by the Management Plan in accordance with Community and/or national laws (e.g. extension of sensitive or vulnerable areas, reporting and authorization system, definition of resource protection areas, discharge control etc.). The Directive provides a list of measures that could be included within the POMs, the same required under different previously directives, and provide also a non-exclusive list of measures, which are aimed at either reinforcing the previous provisions or setting up new provisions such as: good practices codes, voluntary agreements, economic and tax instruments etc.
10 Basic measures include the so-called combined approach (Article 10). This means that water policy should be based on controlling pollution at source through setting emission limit values and environmental quality standards. The effluent limits established for urban or industrial discharge do not take the receiving environment condition and/or dilution ratios into account for derivation of the limits. For point source discharges liable to cause pollution, basic measures can be a requirement for prior regulation (e.g. a prohibition on the entry of pollutants) or a requirement of authorization or registration laying down emission controls for the pollutants concerned.
For diffuse sources liable to cause pollution, basic measures are to prevent or control the input of pollutants or prior regulation, authorization or registration in a similar way to point source discharges. One of the previously directives enhanced in order to control the pollution arising from agricultural activities is the Nitrates Directive (Directive 91/676/EEC) aimed at reducing and preventing water pollution from agricultural sources through a number of steps which shall be fulfilled by Member States: water monitoring with regard to nitrate concentration and eutrophic status, designation of nitrate vulnerable zones and establishment of action programmes and codes of good agricultural practice.
The use of economic instruments is part of the basic measures. The principle of recovery of the costs of water services, including environmental and resource costs associated with damage or negative impact on the aquatic environment should be taken into account in accordance with, in particular, the polluter-pays principle. An economic analysis of water services, based on long-term forecast of supply and demand for water in the river basin district is also necessary for this purpose.
2.2 WFD IMPLEMENTATION IN ITALY
The complete transposition of WFD into Italian law was brought into force in 2006, three years after the deadline defined by the Directive.
The Legislative Decree (L.D.) n. 152, “Norms concerning the Environment” (G.U n.88 14 April 2006) provides rules for the environmental management. The third part of this decree regards the water issues complying with the WFD. All of the previously Italian laws about water resources management are incorporated in the decree n.152/2006. Until the end of
11 2009, other decrees were originated to review and correct the third part of L.D. 152/2006 and to fulfill the transposition of the WFD into the Italian national legislation.
According to the WFD, 8 Italian River Basin Districts were identified. The River Basin Management Plan of each river basin district was produced by December 2009, according to the Art.13 of WFD.
The RBMPs cover the following main elements:
Characteristics of river basin districts, analysis of human pressures on the status of waters.
Environmental objectives established for all surface waters. Identification of protected areas.
Economic analysis of water use.
List of programmes of measures that have to be adopted to achieve the objectives.
The instruments adopted to develop a draft of the RBMPs are: the “Water Protection Plan” (PTA) and the “Hydrographic District Management Plan” (PGBI) according to the Italian Decree n.152/2006.
The PTA is a regional document, it reports the information that permits to characterize the river basin district territory, to evaluate the human pressures on water quality and quantity, to define the objective of all waters and finally to individuate the measures that have to be adopted.
The analysis of pressures and impact of human activities on water was done so by estimating the following:
Point sources loads (tons/year or tons/month). Diffuse source loads deriving from land uses. The pressures on water quantity.
The identification of reference condition, required by WFD to assess the environmental objective, is difficult for many Italian water bodies due to the presence of a lot of hydromodifications and human pressures on water quality status.
The Italian law defines the quality objectives according to the designated uses of surface waters (drinking water, water suitable for fish life, bathing waters, etc). Each pollutant has a maximum allowable concentration that can vary among the surface waters with different designated use of waters.
12 The monitoring activities began in 2000, according to previously Italian Laws on water quality protection, permitted to assess the surface waters and groundwaters quality status. A list of measures for river basins classified as “bad” or “poor” must be adopted for each basin according to the WFD.
The process of corrections and reviewing of decree 152/2006 is still going on and is producing a number of new decrees, also taking into account new European directives on water policies.
2.3 WATER LEGISLATION IN USA
United States has a major and lengthy history of federal water legislation which dates back to Nineteenth century.
The Clean Water Act (CWA), passed in 1972, is the primary federal regulation for protecting water bodies in the United States. The most fundamental goal of CWA is to achieve a level of water quality which provides for the protection and propagation of fish and wildlife and for recreation in and on the water (Gallagher, 2003).
The main objective of the CWA is to restore and maintain chemical, physical, and biological integrity of the United States‟ waters. The objectives and the goal of CWA are the same reported in the WFD.
CWA is extremely comprehensive, covering everything from water quality standards, antidegradation, water body monitoring, and assessments to pollution discharge permitting programs, point sources and non point sources funding, and provisions for citizen lawsuits. The control of point sources in the U.S. is regulated by a program called National Pollutant Discharge Elimination System (NPDES) in which discharges of pollutants from a point source is allowable only if the discharger has a NPDES permit.
The NPDES permit sets numerical concentration limit for a specified pollutant and requires monitoring activities on discharges into waters with relative report that have to be submitted to permitting authority.
Effluent limits specified in the NPDES permit consider both the technology available to treat the effluent (e.g. technology-based effluent limits) and protection of designated uses of the receiving water (water quality-based effluent limits). Effluent limits are specified in the NPDES permit to ensure that receiving water discharges do not exceed the State Water Quality Standards (WQS) criteria.
13 The CWA does not enforce the non point source control through regulatory means rather through volunteer implementation. A revision of the statue on 1987 created provision for the states to identify measures to reduce non point source contribution, develop a management plan for implementing actions to maintain and attain water quality standards, and identify the best management practices (BMP) that will address nonpoint source pollution.
The strategy adopted in U.S. for the management of surface water quality is the Water Quality Standards.
The three main elements of water quality standard are:
1. Include provisions for restoring and maintaining the chemical, physical and biological integrity of State waters.
2. Provide, wherever attainable, water quality for the protection and propagation of fish, shellfish and wildlife and recreation in and on the water (fishable/swimmable).
3. Consider the use and value of State waters for public water supplies, propagation of fish and wildlife, recreation, agriculture, industrial purposes and navigation.
The WQS are composed of three key parts:
1. The first part of the WQS involves use designations for water bodies based on an assessment of beneficial uses of those water bodies. The CWA describes various “desirable” uses for water bodies that should be protected, including public water supply, recreation and propagation of fish and wildlife. More specific uses (e.g., cold water aquatic life, agricultural and other sub-classifications) or uses not indicated in the CWA may be designated according to State values, as long as they support the defined “fishable/ swimmable” goals.
2. The second part of the WQS includes numerical and/or narrative water quality criteria sufficient to protect each of the designated uses assigned to the specific receiving water body. Numerical criteria define the magnitude (the allowable concentration of a specific parameter), duration (the period of time over which the in-stream concentration is averaged for comparison with criteria concentrations) and frequency (how often criteria may be exceeded) for each of up to 126 priority parameters as summarized in the US EPA Gold Book.
3. States may establish numerical criteria using EPA guidance (e.g., US EPA, 1991) modified to reflect site-specific conditions or other scientifically defensible methods,
14 or use EPA derived limits. The WQS numerical water quality criteria may be values expressed as levels (e.g. pH), constituent concentrations or mass loadings (e.g. metals, organic compounds), toxicity units (e.g. whole effluent toxicity) or numbers deemed necessary to protect designated uses (e.g. biological indices). The EPAs criteria for the protection of aquatic life addresses both short-term (acute) and long-term (chronic) effects on both freshwater and saltwater species. Human health criteria are designed to protect people from exposure resulting from consumption of water or fish/shellfish.
The WQS narrative criteria may supplement numerical criteria or provide the basis for limiting discharge of specific parameters where the State has no numerical criteria.
The third part of the WQS includes adoption of an antidegradation policy that includes the methods used to implement the policy.
After the implementation of the directives of CWA, there is, however, some water bodies that do not meet water quality standards, these water bodies are listed in section 303 of CWA and a formulation of Total Maximum Daily Load (TMDL) is required. A TMDL allocates pollution control responsibilities among pollution sources in a watershed, and is the basis for taking the actions needed to restore a water body.
2.4 WHAT IS A TOTAL MAXIMUM DAILY LOAD (TMDL)?
The TMDL is a tool for implementing water quality standards (designated uses, numeric and narrative criteria and antidegradation requirements) under the Clean Water Act and is based on the relationship of pollution sources and in stream and lake water quality condition. It is the summation of waste load allocations (WLA) for point sources and load allocations (LA) for nonpoint sources included natural background conditions.
The TMDL process takes a holistic view of identifying pollutants, calculating load reductions, and formulating an action plan for both point sources and nonpoint sources to attain water quality standards. The TMDL takes also into account seasonal and spatial variability of load and impact.
TMDLs are set with public consultation, and while not explicitly following an Ecological Quality Ratio approach relative to Reference Conditions as required by the WFD, in practice estimations of reference conditions are often relevant in setting targets of TMDL (Heiskary, 1989).
15 In the U.S., it is common that “reference sites” are identified as either the upper 75 percent of “high quality” sites, or the upper 25 percent of all sites. This statistical approach based in frequency data is not the same as the concept of reference state defined in the WFD. Nevertheless, the TMDL approach has many similarities to the policies of the WFD.
The point and nonpoint pollution programs managed separately, before the formulation of TMDL, resulted in a large number of water bodies that didn‟t meet the water quality standards.
The objective of the TMDL process is to systematically identify impaired or threatened water bodies and the pollutant(s) causing the impairment and ultimately establish a scientifically-based strategy for correcting the impairment or eliminating the threat and restoring the waterbody.
A TMDL implementation plan is analogous to the WFD Programmes of Measures. It requires measurable indicators, in appropriate units, and target values to evaluate attainment of water quality standards; monitoring activities. The mathematical models are used to determine effectiveness of control measures.
The US EPA (US EPA, 1999; US EPA, 1999; US EPA, 2001) has developed protocols for developing TMDLs in response to a number of pollutants. TMDLs are site specific and must include the total of all point and diffuse loads and incorporate a margin of error. They must also take into account seasonal and spatial variability of load and impact, and in its development characterize the catchment to identify all sources of pollutants as well as background loads.
To be effective in improving water quality, a TMDL must be more than an estimation of necessary pollutant reductions; it must be implemented. Therefore, every approved TMDL must include an implementation plan that explains the techniques that will be used to meet the load reductions identified.
The plan also provides the mechanism for tracking the implementation of management measures and point source controls and monitoring the various relevant indicators of water quality conditions. Evaluation of the milestones identified in the implementation plan can be used to determine whether progress is being made toward meeting water quality standards. Ten distinct elements are required as part of a TMDL submittal:
16 1. The name and geographic location of the impaired or threatened waterbody for which the TMDL is being established, as well as the geographic location of upstream waterbodies that contribute the pollutant for which the TMDL is being established. 2. Identification of the pollutant for which the TMDL is being established and
quantification of the target load of the pollutant that may be present in the waterbody and still ensure attainment and maintenance of water quality standards.
3. Identification of the amount or degree by which the current pollutant load in the waterbody deviates from the target representing attainment or maintenance of water quality standards.
4. Identification of the source categories, source subcategories, or individual sources of the pollutant for which the waste load allocations and load allocations are being established consistent.
5. Waste load allocations to each industrial and municipal point source permitted, discharging the pollutant for which the TMDL is being established; waste load allocations for storm water, combined sewer overflows, abandoned mines, combined animal feeding operations, or any other discharges subject to a general permit may be allocated to categories of sources, subcategories of sources or individual sources; pollutant loads that do not need to be allocated to attain or maintain water quality standards (minor or remotely located) may be included within a category of sources, subcategory of sources or considered as part of background loads; and supporting technical analyses demonstrating that waste load allocations when implemented, will attain and maintain water quality standards.
6. Load allocations, ranging from reasonably accurate estimates to gross allotments, to nonpoint sources of a pollutant, including atmospheric deposition or natural background sources; if possible, a separate load allocation should be allocated to each source of a pollutant, where this is not possible, load allocations may be allocated to categories of sources, subcategories of sources; pollutant loads that do not need to be allocated (minor or remotely located) may be included within a category of sources, subcategory of sources or considered as part of background loads; and supporting technical analyses demonstrating that load allocations, when implemented, will attain and maintain water quality standards.
7. A margin of safety expressed as unallocated assimilative capacity or conservative analytical assumptions used in establishing the TMDL; e.g., derivation of numeric
17 targets, modeling assumptions, or effectiveness of proposed management actions which ensures attainment and maintenance of water quality standards for the allocated pollutant.
8. Consideration of seasonal variation such that water quality standards will be met for the allocated pollutant during all seasons of the year.
9. An allowance for future growth, which accounts for reasonably foreseeable increases in pollutant loads.
18
CHAPTER 3 - DEVELOPMENT OF NUTRIENTS TMDLs
3.1 PROTOCOL TO DEVELOP A NUTRIENT TMDL
The development of a TMDL is necessary to formulate a strategy that addresses the causes and potential sources of the water quality impairment and available management options. Generically the TMDL is described by the equation:
TMDL = LC = ΣWLA + ΣLA + MOS
Where:
LC = Loading Capacity, or the greatest loading a waterbody can receive without violating water quality standards.
WLA = Waste Load Allocation, or the portion of the TMDL allocated to existing or future point sources.
LA = Load Allocation, or the portion of the TMDL allocated to existing or future nonpoint sources and natural background.
MOS = Margin of Safety, or an accounting of uncertainty about the relationship between pollutant loads and receiving water quality. The margin of safety can be provided implicitly through analytical assumptions or explicitly by reserving a portion of loading capacity.
In the framework for TMDL development seven components have to be completed: 1. Problem identification.
2. Identification of water quality indicators and targets. 3. Source assessment.
4. Linkage between water quality targets and sources. 5. Allocations.
6. Follow-up monitoring and evaluation. 7. Assembling the TMDL.
19
Figure 2: Components of TMDL developments (U.S. Environmental Protection Agency, 1999. Protocol for Developing Nutrient TMDLs).
20 Problem identification
Problem identification is a key factor in the development of a TMDL. The identification of the key cause and the knowledge of background situation that describe the nature of the impairment is the objective of this first step in the implementation process.
Target analysis
Identified the problem the next step in the process of establishes a TMDL is to define the relationship between the designated uses of waters and pollutant loading. The process of target analysis permits to identify the pollutant and evaluate its allowable load according to numeric or narrative water quality criteria; when no numeric water quality criterion is available, a site-specific quantified target that results in the attainment or maintenance of water quality standards must be developed as part of the TMDL.
The amount or degree by which the current pollutant load deviates from the target determines how much the pollutant load must be reduced to meet the maximum allowable pollutant load and therefore sets the stage for allocation of the pollutant among its sources.
Sources assessment
During the process of identification and assessment of sources some key factors have to be individuated: the type of source (point, non point and background), location of each source, magnitude of its loads, mechanism of transports, duration and frequency of pollutant transports.
The evaluation of pollutant loading is typically performed using a variety of tools, including existing monitoring information, air photography analysis, simple calculations, spreadsheet analysis using empirical methods, and a range of computer models from simple to sophisticate.
Linkage of source and target
To estimate the degree of pollution reduction needed to attain water quality standards occurs to establish the relationship between the in-stream water quality target and pollutant loads. In addition, the linkage analysis facilitates the evaluation of management options that will achieve the desired load reductions. The link can be established through a range of techniques from the use of qualitative assumptions backed by sound scientific justification to the use of
21 sophisticated modeling techniques. Ideally, the linkage will be supported by monitoring data that associate certain waterbody responses to flow and loading conditions.
When long-term monitoring data are unavailable, it might be necessary to use a combination of methods, including monitoring data, analytical tools (including simulation models), and qualitative information. The monitoring data help to define characteristics such as baseline water quality conditions, pollutant source loading rates, and waterbody system dynamics. The available monitoring data will be supplemented by analytical tools. The linkage consists of evaluating the relationship between source loadings and the waterbody‟s response to those loads over time if long-term data is available.
Allocation
The allocation of pollutant loads permits to create a technically feasible and reasonably fair division of the allowable load among sources.
The concept of allocation is central to the TMDL process because it reinforces the importance of identifying what sources need to be addressed to eliminate the impairment. The type of pollutant sources drives the way to establish the TMDL.
EPA has developed numerous technical guidance manuals to assist States, Territories, and authorized Tribes in calculating waste load and load allocations for point sources that are identified as contributing to the impairment of a waterbody. Waste load allocations should be expressed as: numeric maximum allowable loads, required numeric reductions in pollutant loads, and/or narrative effluent requirements.
Another required elements that have to be included in a TMDL is the seasonal variation that can contribute to variations in the waterbody‟s assimilative capacity caused by seasonal changes in temperature and flow, or sensitive periods for aquatic biota (e.g., algae growth, fish spawning, larval emergence), and other factors. TMDLs should also consider seasonal fluctuations in pollutant loads to the waterbody. Some nonpoint sources contribute pollutant loads only during precipitation events, a distinct rainy season, or snowmelt. Similarly, some point sources operate only during certain times of year.
In some cases it‟s important to incorporate also the future population‟s impacts on water quality.
22 Implementation and monitoring plan
The implementation plan in the establishment of a TMDL is similar to the Programmes of Measures and the Monitoring Program required by the WFD.
The implementation plan permits to identify the measures, such as specific best management practices, that must be implemented to help identified sources meet their allocations.
The implementation plan should describe what actions will be implemented by source category, source subcategory, or individual sources. The description of the actions should include an analysis of the anticipated or past effectiveness of the control actions and/or management measures expected to meet the allocations. The implementation plan should also describe where the control actions and/or management measures will be implemented.
To achieve the specified load allocation, the implementation plan should include a time line for installation of identified management actions. Especially in the case of nonpoint source controls, the specific management actions will be distributed in various locations in the watershed.
23
3.2 METHODOLOGIES FOR TMDLs CALCULATION
TMDLs are developed for a variety of pollutants, environmental settings, pollutant source types, and waterbody types. They may be calculated using an assortment of analytical approaches and commonly use time steps, ranging from daily to annual, to express the loading capacity and associated allocations. EPA encourages TMDL developers to select the most appropriate method and time step, according to the available data, watershed and waterbody characteristics, pollutant loading considerations, applicable standards.
Two types of daily load expressions are available for presentation of daily loads:
1. Static expression, a single daily load number or set of numbers applicable to all conditions in the waterbody. It is most suitable when source inputs are relatively constant and show little variability.
2. Variable expression, used when the applicable daily load value is determined as a function of a particular characteristic that affects loading or waterbody response, such as flow or season. Of these, the most common options will be targets that vary by flow (flow variable) and those that vary by month or by season (temporally variable).
For many TMDL pollutants, such as nutrients and sediment, primary threats to achieving water quality standards (WQS) can depend on cumulative load, and accuracy of pollutant loading estimates increases as the length of the calculation period increases. Therefore, establishing longer-term allocations is appropriate given the chronic nature of the pollutant loading and resulting impairments.
Traditionally the approach used in the TMDL development tends to focus on targeting a single value, which typically depends on a water quality criterion and some design flow. The single number concept does not work well when dealing with impairments caused by NPS pollutant inputs (Stiles, 2001). One of the more important concerns regarding nonpoint sources is variability in stream flows, which cause different loading mechanisms to dominate under different flow regimes (Cleland, 2002).
EPA recommends that all the TMDLs and associated load allocations (LAs) and waste load allocations (WLAs) also be expressed in terms of a daily time increment. While TMDL analytical approaches that result in longer (non-daily) averaging periods may continue to be used to demonstrate consistency with applicable water quality criteria, all final TMDL submissions should include an adequate expression of daily loads in addition to any
longer-24 term loading expression. Loading capacity of most waterbodies is not constant in time. Depending on the constituent of concern, it can vary with stream flow, temperature, and many other variables.
The TMDLs that include time-variable loading limits are often generated by using a dynamic modeling technique, which can include both continuous simulation models and statistical approaches.
While TMDLs should contain an expression of daily load, this daily load may be either a constant daily maximum load or a time-varying daily maximum load. Expressing long-term LAs as daily loads can also be used to inform post-TMDL monitoring and tracking.
Monitoring data collected during a given sampling event can then be compared to the identified daily load values to evaluate whether the TMDL is being attained.
Process for Deriving Daily Load Expressions from Typical Non-daily TMDL Analysis Whether TMDLs are expressed as daily allocations or non-daily allocations depends on such considerations as expressions of applicable WQS, pollutant type and behavior, source characteristics, critical conditions, and TMDL development methodology. If it is deemed appropriate to express a TMDL on a non-daily time frame, that non-daily TMDL should also include a daily expression.
The first step in the process to identify the daily load expression, an evaluation of the technical approach to developing the non-daily load, provides the analyst with an understanding of what information is available for the process.
The second step requires the creation of the daily load dataset from which the daily expression will be created.
The third step involves working with the dataset to identify the most appropriate daily load expression on the basis of the practitioner‟s knowledge of the system.
Allocations based on monthly, seasonal, or annual timeframes are valuable components to guide management measures and implementation plans because they are related to the overall loading capacity of the waterbody, while the daily expressions represent day to day snapshots of the total loading capacity based on ambient conditions. The daily expression can provide a useful tool for tracking the progress toward meeting the longer-term allocations and goals. Follow-up monitoring data can be compared with daily maximum loads to gather insight into how the waterbody is responding to implementation efforts and whether short-term loads and conditions are within the range of conditions represented by the longer term TMDL