Models: a point to Cobb-Douglas’ form
Paolo Chirico DIGSPES Alessandria University of Eastern Piedmont, Italty
Abstract: The first aim of this paper is to present a singular algorithm of ALSOS’s (Alternating Least Squares with Optimal Scaling). It allows to assign the same scaling to all variables measured on the same ordinal scale in a categorical regression. The algorithm is applied to a regression model to measure and evaluate Customer Satisfaction (CS) in a sanitary case. The results seem to support the use of multiplicative models like Cobb-Douglas’s, to analyze how the overall CS of goods or services is shaped. According to this evidence, the second aim intend to suggest a theory about the overall CS very similar to theory about utility in Marginal Economics. After a brief introduction to the CS measurement and evaluation methods (Sec. 1), the algorithm is presented on the Sec. 2. Sec. 3 and 4 concern the application and the theory about overall CS. Conclusions are reported in Sec. 5.
1 Features of a Customer Satisfaction model
In the last twenty years several statistical methods have been proposed to measure and to evaluate the satisfaction degree of a customer about goods or services, namely Customer Satisfaction (CS). A brief overview of these methods is not a target of the present paper, nevertheless it is useful to consider some features that can characterize and distinguish a method.
The first feature concern the measurement scale. The natural scale of CS is typically an ordinal scale (for example: very dissatisfied, dissatisfied, neither satisfied nor dissatisfied, satisfied, very satisfied) but, unfortunately, this measurement doesn’t always allow very meaningful analysis. The most diffused approaches to overcome this limit are:
• adopting a Likert scale;
• determining a metric scale from a probabilistic model; • introducing an Optimal Scaling algorithm.
The Likert scale (see Brasini et al. 2002, pp 164-168) consists on replacing ordinal categories with their ranks. Such transformation is very easy and is adopted by several statistical methods (see moreover Tab. 1), but is obviously arbitrary and can be considered acceptable only if categories are conceptually equidistanced. Probabilistic approaches are the Thurstone’s method and the Rasch Analysis model (see Andrich), but either approach imply the choice of distributional assumptions. This is a post-peer-review, pre-copyedit version of an article published in Data Analysis and Classification: from the exploratory to the confirmatory approach, 2010, Springer
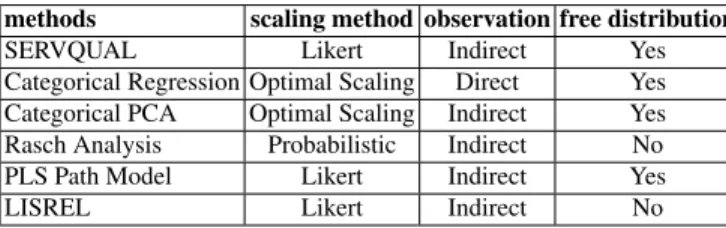
but this observation can be considered a effective degree of satisfaction only if we can assume the customer’s rationality, in other words this means that his answer in not affected by environmental and psychological influences. Otherwise the CS had to be estimated from other observable variables by means of appropriate models (indirect observation). In the following table are reported some pop-ular statistical method used for CS measurement and evaluation. They are compared in regard to the features discussed.
Table 1 Features of some popular statistical method for CS
methods scaling method observation free distribution
SERVQUAL Likert Indirect Yes
Categorical Regression Optimal Scaling Direct Yes Categorical PCA Optimal Scaling Indirect Yes
Rasch Analysis Probabilistic Indirect No
PLS Path Model Likert Indirect Yes
LISREL Likert Indirect No
In the following sections a singular Categorical Regression model is proposed for CS evaluation. It is based on an ALSOS alghorithm (Alternating Least Squares with Optimal Scaling, see Sec. 2) and allows to obtain a common scaling for all evaluation model variables measured on the same ordinal scale. This does not normally happens with the standard ALSOS programs.
2 Categorical Regression with common optimal scaling
The ALSOS algorithms are OS methods that permit the optimization of a model adopting Alter-nating Least Squares (ALS) and Optimal Scaling (OS) principles (see Young et all., 1976). More specifically they are based on a iterative two-steps estimation process (fig. 1), which permits to get least squares estimations of scaling values and model parameters. Every algorithm starts with an ex-ogenous scaling and terminates when the iterative solution converges. The models involved are linear models, which can be performed by an optimization (Regression, Principal Component Analysis, ... ); the corresponding analysis is also named with the term ”categorical”.
2.1 The pattern of the Model
Let ˜Y the overall satisfaction degree of a customer about a good or service and ˜X1, ˜X2, ..., ˜Xp the
satisfaction degrees of some aspects of the good or service. All satisfactions are measured on a scale of k ordinal categories c1, c2, ..., ck. The target is to convert a qualitative scale into a quantitative one
by means of a common transformation z( ) in order to minimize the error ε of regression:
Fig. 1 The ALSOS Algorithm
where Y = z( ˜Y), X1= z( ˜X1), ..., Xp= z( ˜Xp). Practically the transformation z( ) is defined by
kordered values z1≤ z2≤ ... ≤ zk corresponding to the k ordered categories. Assuming data are
observed on n customers, the score y, x1, x2, ... of each scaled variable can be got in the following
way:
y = Uyz
xj= Ujz (2)
where Uy, Ujare the typical indicator matrix (the generic element ui,his 1 if the i-th customer
respond ch about the corresponding variable, else 0); z is the vector of the scaling parameters
z1, z2, ..., zk.
So the model (1) can be described in the classic form:
y = Xβ + ε (3)
This form is useful for the model step, but not for the OS step, because does not point out the scaling parameters. For it, it needs to rewrite the classic form in the following scaling form:
(Uy− B)z = β01 + ε (4)
where B = ∑pj=1βjUj
2.1.1 The algorithm of the parameters estimation
According the approach of ALSOS (fig. 1), the algorithm is described by the following steps: Initialisation: an arbitrary z is chosen;
Model Step: β is estimated by classic estimator: β = (X0X)−1X0z
OS Step: a new z is estimated by minimizing SSE in the model (4) with the constrains z1= zmin
and zk= zmax
Control Step: if the absolute difference between the two last z is less than a suitable convergence, the Final Results are obtained; else it need to go back to Model Step
Final Results: the last z and β are the final results
It is easy to note that the OS model above does not include constrains for the monotonicity of transformation: If initial scaling is monotone and customer responses are rational, they are not needed, but there are no problems to include them. Indeed the minimum and the maximum of scaling
convergence on the global least squares solution. Nevertheless every final scaling is better (in terms of SSE) than an initial, supposed good scaling.
3 Multiplicative Models for CS
The proposed model was applied to a survey on CS in a Piedmont ASL (Local Sanitary Firm): 525 patients were asked about their satisfaction degree on:
• whole service (overall satisfaction);
• some aspects of the service (waiting time, suitable environment, courtesy, professionalism, etc.). Responses scale was: very dissatisfied, dissatisfied, neutral, satisfied, very satisfied. Here only the final scaling is reported in the figure 2 (for more details see Chirico (2005) ).
0.00 1.00 2.00 3.00 4.00 5.00 6.00 scaling1.00 3.68 4.76 4.88 5.00 very dissatisfieddissatisf iedneutralsatisfied very
satisf ied
Fig. 2 The optimal scaling in a sanitary case
This result contrasts with idea of conceptual equidistance among categories. Nevertheless it is possible to partially recover equidistance with a power transformation like:
˙z0= [az1, az2, ..., azk] (5)
with a > 1. It means that the scaling z could be viewed (see fig. 2) as the logarithmic transforma-tion of a more realistic scaling ˙z. Then the model (1) should be the logarithmic transformatransforma-tion of the model:
aY= aβ0+β1X1+...+βpXp+ε (6)
that can be rewritten as:
˙
Y = β0· ˙X1β1· ... · ˙X
βp
k · ε (7)
where variables with the point above correspond to avariable. Now the new variables’ values, in
model (7), better represent the the categories c1, c2, ..., ck. This fact suggests that the better relation
function, rather than linear. The linear model, thanks to the proposed algorithm, is useful to estimate the parameters β0, β1, ..., βp(they do not change in the multiplicative model) and the pre-final scaling
z1, ..., zk.
3.1 Some observations
Final Scaling. The final scaling ˙z1, ..., ˙zkcould be get from z1, ..., zkby means of a power
transfor-mation with basis a > 1:
˙zj= azj (8)
Unlikely it is not clear which value of a is better to get the final scaling, because not every value of adetermines the same effects in terms of ratio and intervals among ˙z1, ..., ˙zk. If a conceptual
equidis-tance among the categories c1, ..., ckis assumed, a could be chosen in order to minimise the
variabil-ity of the differences: ˙zh− ˙zh−1(h=2,, k). Other criteria can be adopted; each one determines different
final scaling and consequently different values of position indicators like the mean, for example. In-deed the parameters β0, β1, ..., βp(which indicate the importance of every factor X0, X1, ..., Xp) not
change and not their significance (see next section).
Weighting. As Least Squares methods are applied on the linear model (1), the fit of the multiplicative model (7) is worse in correspondence of greater value of ˙Y. To reduce this effect, it is possible to change the two estimation steps introducing a weighted least squares estimation method.
4 A theory about overall CS
According with the results underlined in the last section, the following theory about the CS is pro-posed:
• every customer determines his/her own satisfaction about a good or service (Overall Customer Satisfaction: OCS) composing the relative evaluations of some fundamental aspects of the good or service (Partial Customer Satisfaction: PCS);
• the composition criterion is approximated by a multiplicative model of the Cobb-Douglas type:
OCS= α · PCSβ1
1 · ... · PCS
βk
k (9)
The first assumption is typical of the most of CS model (SERVQUAL, ACSI, ECSI). The second one shapes the Customer Satisfaction similar to the customer utility in the marginal consumer theory. In fact it is easy to prove that:
βj=
d(OCS)/OCS d(PCSj)/PCSj
(10) that means βjis the elasticity of OCS respect to PCSj. If customer’s responses are rational, all βj
will be positive or null (negative estimates of these parameters could be obtained, but they ought to be not different from zero at the test). Generally α = 1 and ∑ βj= 1 are expected (scale effects do
d(OCS) d(PCSj = βj OCS PCSj (12) If PCSj increases, the OCS increases less proportionally (see (9) and (11)) and consequently
d(OCS)/d(PCSj) decreases. This means the improvement of one level from satisfied to very satisfied in an aspect produces a smaller increase of the overall satisfaction than the improvement of one level from neutral to satisfied in the same aspect. In other words, improvements from low quality levels are more important for customers than improvements from high quality levels. This deduction from the model (9) is consistent with the psychology of the majority of the customers. If the OCS of a good or service ought to be improved, the best strategy is not always to improve the most important aspect (that one with the biggest βj). It could be more effective to improve another aspect with a
low quality level. Each possible improvement ought to be considered and valued in regard to his marginal satisfaction and, of course, his cost (costs of needed actions to get the improvement).
5 Conclusions
The algorithm presented in this paper has the typical features of ALSOS programs: free distribu-tion method and convergence of estimates obtained by analytic funcdistribu-tions. It also ensures a common scaling for all data measured on same ordinal scale, whereas ALSOS programs included in the most popular statistic software do not. In fact these programs, as general approach, assign different scal-ing to every qualitative variable, whether it is measured on a common scale or not. However the same values should be assigned to same categories, if the scaling gives a metric significance to the measurement of qualitative data (see Chirico 2005).
The application of algorithm in a CS evaluation study has pointed out that the relation between the overall satisfaction and its factors seems to be formalized better by multiplicative models, like Cobb-Douglas ones. In other words: the overall satisfaction and its factors are conceptually comparable to overall utility and its factors in the marginal consumer theory (the Cobb-Douglas’ function was orig-inally proposed like production function, but subsequently it was also used to confirm the marginal consumer theory). This model form permits to formalized the concept of ”decreasing marginal sat-isfaction” that involves the strategic importance of improving the low quality aspects. At present, further studies on how to get the final scaling in a multiplicative model are being carried on.
References
[And88] Andrich, D.: Rasch models for measurement, Sage (1988)
[Boc60] Boch, R.D: Methods and Applications of optimal scaling, Psychometric Laboratory Report, 25, University of North Carolina (1960)
[Bra02] Brasini, S., et al.: Statistica aziendale e analisi di mercato, il Mulino, Bologna (2002)
[Chi05] Chirico, P.: Un metodo di scaling comune per modelli multivariati di valutazione della customer satisfac-tion, Working Paper, Dipartimento di Statistica e Matematica Applicata, Universita’ degli Studi di Torino (2005)
[Krs65] Kruskal, J.B.: Analysis of Factorial experiments by estimating monotone transformations of the data, Jour-nal or Royal Statistical Society, Series B, 27, (1965)
[MnC07] Montinaro, M., et al.: Customer Satisfaction measurement procedures: one-dimensional and multi-dimensional approach, Statistica Applicata, 2006/3, (2007)
[Par88] Parasuraman, A., et al.: SERVQUAL: a Multiple-Item Scale for Measuring Customer Perceptions of Ser-vice Quality, Journal of Retailing, 1,(1988)
[Vit03] Vittadini, G., et al.: Recenti sviluppi nella metodologia statistica per la valutazione nell’efficacia degli ospedali, Statistica, anno LXIII, n. 1, (2003)
[Var05] Varian, H.,R.: Microeconomic Analysis, Norton and Co., (2005)
[You76] Young, F.W., et al.: Regression with qualitative and quantitative variables: an alternating least squares method, Psychometrika, vol. 41,4, (1976)