Deterministic or stochastic seasonality in daily
electricity prices?
Paolo Chirico
AbstractThe paper presents an analysis of the seasonality of Italian daily electricity prices. Since the correct detection of the nature, stochastic or probabilistic, of the seasonality is crucial in ARIMA modeling, a test that allows such detection is pre-sented. The application of this test to the Italian daily prices in the years 2008-11 has pointed to the presence of deterministic seasonality in the short run. Nevertheless, seasonality has decreased in the last two years as consequence of a more balanced consumption of electricity over the week.
Key words: Electricity prices, seasonal unit roots, HEGY test
1 Introduction
As is well known, daily electricity prices are characterized by clear seasonal pat-terns associated with time intervals, such as the day of week or the month. Every attempt to construct a model of these prices has to take this evidence into account. In particular, the correct application of ARIMA models requires a deep analysis and identification of the nature, stochastic or deterministic, of the seasonality present in the prices. The treatment of seasonality in the ARIMA framework is conceptually similar to the treatment of trends: like these, seasonality entails the non-stationarity of the process, and its non-stationary effect has to be removed before modeling the process. More specifically, if the daily effects are constant at corresponding days (every Sunday, every Monday,...), the seasonality can be shaped by a periodic lin-ear function s(t) (deterministic seasonality). In this case, the correct treatment con-sists in extracting the seasonality by regression, and then modeling the non-seasonal prices using an ARIMA model:
Paolo Chirico
Department of Economics, University of Turin, Italy; e-mail: [email protected]
2 Paolo Chirico
ϕ(B)[pt− s(t)] =θ(B)εt (1)
where the autoregressive part of the modelϕ(B) can include unit roots characteriz-ing the model as integrated. As a whole, model 1 is also named the Seasonal
Reg-ARIMA model. On the other hand, if the daily effects are characterized by stochastic
variability (stochastic seasonality), the correct treatment consists in applying the weekly difference to the prices∆7pt= pt− pt−7, and then modeling the differences by an ARIMA model:
ϕ(B)∆7pt=θ(B)εt (2) In this case, the process is named Seasonally Integrated. The two treatments are not interchangeable. In fact, in the case of deterministic seasonality, the seasonal difference is not efficient because it introduces seasonal unit roots into the moving average part of the ARIMA model; in the case of stochastic seasonality, the first treatment does not assure the stationarity in the second moment of the data.
The following section illustrates a test that allows us to detect the kind of season-ality affecting the daily electricity prices; Section 3 reports the application of this test to the Italian daily prices of electricity in the period 2008-11. An analysis of the daily effects (seasonality) will also be provided using suitable ARIMA models.
2 HEGY test
A very common methodology to test for non-stationarity due to seasonality is the procedure developed by Hylleberg, Engle, Granger, and Yoo [1], referred to as the HEGY test. This test was originally derived for quarterly seasonality, but it was also extended for weekly seasonality in data collected on a daily basis by Rubia [2]. Under the null hypothesis, the HEGY test assumes that the relevant variable is seasonally integrated. That means, in the case of daily electricity prices (pt), that the weekly difference pt− pt−7=∆7ptis assumed to be a stationary process. Since
∆7= (1− B7) = (1− B)(1 + B + B2+ ... + B6), the null hypothesis entails the
pres-ence of a single unit root at the zero frequency and three pairs of complex roots at the seasonal frequencies 2πk/7, where k = 1, 2, 3 represents the number of cycles
per week of each frequency.
According to this fact, the test is based on the following auxiliary regression:
∆7pt=α+ 7
∑
d=2 δdDd,t+ 7∑
r=1 αrzr,t−1+ p∑
j=1 ϕj∆7pt− j+εt1 (3) where Dd,tis a zero/one dummy variable corresponding to the d-th day of the week, and the regressors zr,t are defined as follows:1This is a standard version of the HEGY test for daily data, but it can be extended including trends.
Deterministic or stochastic seasonality in daily electricity prices? 3 z1,t = 7
∑
j=1 cos( j0)pt− j z2k,t = 7∑
j=1 cos( j2πk/7)pt− jfor k = 1, 2, 3 (4) z2k+1,t = 7∑
j=1 sin( j2πk/7)pt− jEach regressor is an orthogonal variable that include only one root of the seven roots included in pt. For example, z1,t includes only the unit root corresponding
to zero frequency (random walk), but not the seasonal roots; z2,t and z3,t include
only the seasonal roots corresponding to the frequency 2π/7. Therefore, as in the
augmented unit root test of Dickey and Fuller (ADF) [3], the process includes a unit root if the null hypothesisα1= 0 is accepted against the alternative hypothesis
α1< 0 on the basis of a non-standard t-statistic. Moreover, the test allows us to
detect the presence of seasonal roots, i.e. stochastic seasonality. Indeed, the presence of a couple of complex roots corresponding to a seasonal frequency 2πk/7 implies
that both the parameters of the regressors associated with that seasonal frequency are zero: α2k =α2k+1= 0; k = 1, 2, 3. This assumption can be tested by a joint F-test; the distributions of each statistic Fk are not standard, but the critical values are reported in [4]. Finally, the auxiliary regression includes a number of lags of the dependent variable in order to avoid serial correlation in the error termεt, that reduces the test size.
3 Analysis of the Italian daily electricity prices
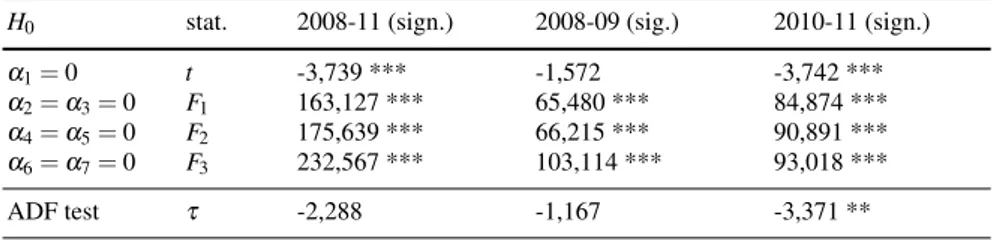
The HEGY test was performed on the 2008-2011 Italian daily PUN2(more specifi-cally the log-PUN). As observable in Table 1, none of the null hypotheses (H0) are
significant at 1% level, i.e. the test point to neither a random walk nor seasonal roots. Nevertheless, the absence of a random walk is not confirmed by the ADF test on the same data. That might mean that the prices process is nearly a random walk, but also the process is not homogeneous over the whole period. Indeed, after performing the HEGY test on the sub-periods 2008-09 and 2010-11, we can note that the statistic t concerning the presence of a random walk gives different signals: the 2008-09 daily prices seem to include a random walk movement, whereas the 2010-11 daily prices do not. Such deductions were confirmed by performing the ADF test on the data (Table 1). The absence of mean-reversion in the first period is a particular case and should be related to the high variation of the oil prices in the same period. On the other hand, the seasonality remains non stochastic in both periods (absence of sea-sonal roots). According to these findings, the 2008-09 daily electricity prices were
2The PUN is the National Single Price in the Italian electricity market (IPEX). The PUN series are
4 Paolo Chirico Table 1 HEGY and ADF tests
H0 stat. 2008-11 (sign.) 2008-09 (sig.) 2010-11 (sign.)
α1= 0 t -3,739 *** -1,572 -3,742 ***
α2=α3= 0 F1 163,127 *** 65,480 *** 84,874 ***
α4=α5= 0 F2 175,639 *** 66,215 *** 90,891 ***
α6=α7= 0 F3 232,567 *** 103,114 *** 93,018 ***
ADF test τ -2,288 -1,167 -3,371 **
shaped by a Seasonal Reg-ARIMA model, whereas the 2010-11 prices were shaped by a Seasonal Reg-ARMA model.
For reasons of space, Table 2 reports only the daily coefficients of the seasonal re-gression function s(t). Since the analyzed data are log-prices, each daily coefficient indicates the average per-cent difference between the correspondent daily price and the Sunday price (daily effect). We can note that in period 2010-11 such differences decreased, i.e. the daily effects decreased, and this is due to a more balanced con-sumption of electricity over the week. Such behavior should be related to the arrival of electricity supply contracts (e.g. Enel Bioraria) that make the consumption of electricity at the week-end more economical than on work days.
Table 2 Seasonal effects
day effect 2008-09 (sign.) 2010-11 (sign.)
Monday 0,149 *** 0,076 *** Tuesday 0,172 *** 0,093 *** Wednesday 0,190 *** 0,091 *** Thursday 0,168 *** 0,097 *** Friday 0,150 *** 0,080 *** Saturday 0,103 *** 0,072 ***
References
1. Hylleberg, S., Engle, R.F., Granger, C.W.J., Yoo, B.S.: Seasonal Integration and Cointegra-tion. Journal of Econometrics, 44, 215–238 (1990)
2. Rubia, A.: Testing for wekly seasonal unit roots in daily electricity demand: evidence from deregulated markets. Istituto Valenciano de investigaciones Economicas, WP-2001-21 (2001) http://www.ivie.es/downloads/docs/wpasec/wpasec-2001-21.pdf
3. Dickey, D.A., Fuller, W.A.: Distribution of the estimators for autoregressive time series witha unit root. Journal of American Statistical association, 74, 427–431 (1979)
4. Leon, A., Rubia, A.: Testing for wekly seasonal unit roots in the Spanish power pool. In: Bunn, D.W. (ed.) Modelling prices in Competitive electricity markets, pp. 131-145. Wiley (2004)