Atrazine (6-chloro-N-ethyl-N´-(1-methyl-ethyl)-1,3,5-triazine-2,4-diamine) is a triazine herbicide widely used in the production of corn and other agricultural crops in the United States. Atrazine loss from the soil to surface water is estimated at 1% per year (Goolsby et al. 1991) and may be transported to areas as far as 1,000 km from the site of use via atmospheric transport and deposition through precipitation (Mast et al. 2007; Thurman and Cromwell 2000). Several studies have sug-gested that atrazine is an endocrine disrup-tor in multiple species, including amphibians (Hayes et al. 2002, 2010), fish (Moore and Waring 1998), and at high exposure lev-els in birds (Matsushita 2006) and rodents (Eldridge et al. 1999; Friedman 2002; Stoker et al. 2000). Some studies have suggested that the lower exposure levels that occur in the environment may be insufficient to affect reproduction in fish, amphibians, or reptiles (Solomon et al. 2008). In 2004, the European Union banned the use of atrazine because of its contamination of water sources (European Commission 2004). The International Agency for Research on Cancer (IARC) lists atrazine as not classifiable as to its carcinogenicity to humans (Group 3), although it did determine that there is sufficient evidence that it causes
cancer in rodents (IARC 1999). The U.S. Environmental Protection Agency (EPA) is currently reviewing its registration decision on atrazine (U.S. EPA 2009).
A few epidemiologic studies have evalu-ated the relationship between atrazine and cancer. Case–control studies have shown weak associations with non-Hodgkin lymphoma (NHL) (De Roos et al. 2003; Hoar Zahm et al. 1993; Zahm et al. 1993) and have sug-gested an increased risk of ovarian (Donna et al. 1989) and prostate cancers (MacLennan et al. 2002). No associations have been observed with leukemia, Hodgkin lymphoma, multiple myeloma (Brown et al. 1993), soft-tissue sarcoma (Hoar et al. 1986), or colon cancer (Hoar et al. 1985).
Within the Agricultural Health Study (AHS), a large, prospective cohort of licensed pesticide applicators and their spouses, a previous analysis of cancer and atrazine use among pesticide applicators found suggestive associations with NHL, multiple myeloma, and cancers of the bladder and lung, but none were statistically significant (Rusiecki et al. 2004). The current study updates the previous analysis with an additional 6 years of cancer incidence and follow-up data, includ-ing more than twice as many incident cancer
cases (n = 3,146), 1,785 of which are addi-tional cases since the previous publication.
Methods
Cohort description. The AHS is a prospective cohort study that includes 57,310 licensed pes-ticide applicators in Iowa and North Carolina. Applicators were recruited and enrolled in the study during 1993–1997 when they obtained or renewed their licenses to apply restricted use pesticides. In North Carolina, only pri-vate applicators, who are primarily farmers, were recruited, whereas in Iowa, both private and commercial applicators were included. Commercial applicators included persons employed by pest control companies or busi-nesses that use pesticides. Incident cancers were ascertained through linkage to state can-cer registries in Iowa and North Carolina. First primary cancers diagnosed from enrollment through 31 December 2007 were included in this analysis. Annually, cohort members were matched to the National Death Index to iden-tify vital status and to current address records of the Internal Revenue Service, motor vehi-cle registration offices, and pesticide license registries of state agricultural departments to determine whether they continued to reside in Iowa or North Carolina. Follow-up was cen-sored at the time of cancer incidence, death,
Address correspondence to L. Beane Freeman, Occupational and Environmental Epidemiology Branch, Division of Cancer Epidemiology and Genetics, National Cancer Institute, 6120 Executive Blvd, Room 8112, MSC 7240, Bethesda, MD 20892 USA. Telephone: (301) 451-8793. Fax: (301) 402-1819. E-mail: [email protected]
*Current address: 1412 Harmony Lane, Annapolis, MD 21409 USA
We thank D. Savitz and B. Ritz for their review and helpful comments.
This study was supported by funds from the Intramural Research Program of the National Institutes of Health (National Cancer Institute Z01 CP010119 and National Institute of Environmental Health Sciences Z01ES049030).
The findings and conclusions in this report are those of the authors and do not necessarily represent the views of the National Institute for Occupational Safety and Health.
The authors declare they have no actual or potential competing financial interests.
Received 10 February 2011; accepted 27 May 2011.
Atrazine and Cancer Incidence Among Pesticide Applicators in the
Agricultural Health Study (1994–2007)
Laura E. Beane Freeman,1 Jennifer A. Rusiecki,2 Jane A. Hoppin,3 Jay H. Lubin,1 Stella Koutros,1
Gabriella Andreotti,1 Shelia Hoar Zahm,1 Cynthia J. Hines,4 Joseph B. Coble,1,* Francesco Barone-Adesi,1
Jennifer Sloan,1 Dale P. Sandler,3 Aaron Blair,1 and Michael C.R. Alavanja1
1Division of Cancer, Epidemiology, and Genetics, National Cancer Institute, National Institutes of Health, Department of Health and
Human Services, Bethesda, Maryland, USA; 2Department of Preventive Medicine and Biometrics, Uniformed Services University of
the Health Sciences, Bethesda, Maryland, USA; 3Epidemiology Branch, National Institute of Environmental Health Sciences, National
Institutes of Health, Department of Health and Human Services, Research Triangle Park, North Carolina, USA; 4National Institute for
Occupational Safety and Health, Cincinnati, Ohio, USA
Background: Atrazine is a triazine herbicide used widely in the United States. Although it is an
animal carcinogen, the mechanism in rodents does not appear to operate in humans. Few epidemio-logic studies have provided evidence for an association.
Methods: The Agricultural Health Study (AHS) is a prospective cohort that includes 57,310
licensed pesticide applicators. In this report, we extend a previous AHS analysis of cancer risk asso-ciated with self-reported atrazine use with six additional years of follow-up and more than twice as many cancer cases. Using Poisson regression, we calculated relative risk estimates and 95% confi-dence intervals for lifetime use of atrazine and intensity-weighted lifetime days, which accounts for factors that impact exposure.
results: Overall, 36,357 (68%) of applicators reported using atrazine, among whom there were
3,146 cancer cases. There was no increase among atrazine users in overall cancer risk or at most cancer sites in the higher exposure categories compared with the lowest. Based on 29 exposed cases of thyroid cancer, there was a statistically significant risk in the second and fourth quartiles of intensity-weighted lifetime days. There was a similar pattern for lifetime days, but neither the risk estimates nor the trend were statistically significant and for neither metric was the trend monotonic. conclusions: Overall, there was no consistent evidence of an association between atrazine use and
any cancer site. There was a suggestion of increased risk of thyroid cancer, but these results are based on relatively small numbers and minimal supporting evidence.
keywords: agriculture, atrazine, cancer, cohort study, epidemiology, pesticide. Environ Health
or movement out of the state. Participants provided informed consent, and the study pro-tocol was approved by the institutional review boards of the National Institutes of Health, the University of Iowa, and other contractors in compliance with all applicable requirements of the United States.
Exposure assessment. Use of atrazine and other factors was assessed through the completion of a self-administered question-naire (available at http://aghealth.nci.nih.gov/ questionnaires.html). Participants provided information on their use of 50 common pesti-cides, pesticide application and mixing meth-ods, repair of pesticide application equipment, and use of personal protective equipment. Participants also reported on potential risk factors such as smoking, alcohol consump-tion, cancer history of first-degree relatives, diet, selected medical conditions, and demo-graphic information.
Questionnaire data were used to construct two measures of atrazine use. The first metric was lifetime days of use, calculated by mul-tiplying the years of reported atrazine use by the average number of days per year of use. The second exposure metric was intensity-weighted lifetime days of use, calculated by multiplying lifetime days of atrazine use by a measure of exposure intensity based on gen-eral handling practices for pesticides. This intensity-weighting algorithm included factors that impacted exposure levels, such as whether the applicator personally mixed pesticides or repaired application equipment, the methods of applying pesticides, and the use and type of personal protective equipment when handling pesticides (Dosemeci et al. 2002). The origi-nal intensity-weighting algorithm was based on questionnaire information, expert review of relative exposure levels from published lit-erature on pesticide exposure, and informa-tion from the Pesticide Handlers Exposure Database (PHED 1992). We recently modi-fied the weighting factors for the intensity-weighting algorithm, using data from pesticide monitoring studies conducted in subsets of AHS participants (Hines et al. 2008; Thomas et al. 2010a, 2010b). The results from these substudies supported the use of the algorithm to assign exposure intensities but indicated areas where refinement could be made. The updated (v2) algorithm gave more weight to the use of chemically resistant gloves for reducing exposure, increased the score given to broadcast methods of application relative to in-furrow application, decreased the score given to mixing activities relative to the origi-nal version of the algorithm, and rescaled the range to include integer values.
Data analysis. Of the 57,310 applicators in the AHS, we excluded 2,337 who provided no or insufficient information on atrazine use to calculate lifetime or intensity-weighted
lifetime days, 1,044 with a cancer diagnosis before enrollment, and 267 who had missing or zero person-years, leaving 53,662 applica-tors available for analyses.
We categorized lifetime days of use and intensity-weighted lifetime days of use into nonexposed and quartiles of exposure among users, with categories based on the distribu-tion of all cancer cases combined. We report results for cancer sites with > 20 exposed cases and for breast and ovarian cancer, which were sites with high a priori interest because of the hormonal properties of atrazine. Relative risks (RRs) were calculated by Poisson regression using SAS (version 9.1; SAS Institute Inc., Cary, NC). Subjects contributed person-time at risk from year of enrollment (1993–1997) through 31 December 2007, date of first can-cer diagnosis or date moved out of the state, whichever was earlier.
Similar to the previous publication, unless otherwise noted, models were adjusted for race, sex, age (< 50, 50–59, 60–69, ≥ 70 years), smoking history (never, ≤ 12 pack-years, > 12 pack-pack-years, regardless of current smoking status), alcohol use (yes/no in pre-ceding 12 months), education (less than high school, high school degree, more than high school), state of residence (Iowa or North Carolina), family history of cancer, applica-tor type (private or commercial), and ever use of other pesticides most highly corre-lated with atrazine use [dicamba, cyanazine, metolachlor, trifluralin, 2,4-D (2,4-dichloro-phenoxyacetic acid)]. For lung and bladder cancer, we additionally adjusted for smoking with tertiles of pack-years among former and current smokers. For ovarian and breast can-cer, because of the small number of cases, confidence limits were calculated in STATA (StataCorp LP, College Station, TX) using exact methods. For all cancer sites evaluated, associations using both the original and the updated versions of the intensity-weighting algorithm were similar; therefore, we pres-ent results based on the updated (version 2) algorithm only. All RRs were calculated using two different referent groups, those report-ing no use of atrazine and those in the lowest quartile of atrazine use. Applicators in the highest categories of atrazine use were more similar to those in the lowest quartile of use than to nonusers on some characteristics, which might suggest the possible presence of confounding on unmeasured characteris-tics. Therefore, analyses using the low-exposed group as the referent are reported here. Tests for trend used the midpoint value of each exposure category treated as a continuous variable in Poisson regression models. All tests were two-sided and conducted at the 0.05 alpha level. We performed stratified analyses by state and by applicator type to evaluate potential differences between the two groups.
We also stratified on use of chemicals that been reported in a case–control study to have supra-additive effects with atrazine and NHL (carbofuran, diazinon, and alachlor). All data used in this analysis are based on AHS data release P1REL201005.00.
Results
Selected demographic characteristics and use of correlated pesticides by atrazine use (none, lowest quartile, highest three quartiles) are reported in Table 1. Pesticide applicators in this cohort are overwhelmingly white and male. For many characteristics, such as sex, state, alcohol use, and use of correlated pes-ticides, applicators in the highest quartiles of use are more similar to applicators in the lowest quartile of use than to the nonexposed. Private pesticide applicators were more likely to have used atrazine than were commercial applicators (70% and 50%, respectively). However, among commercial applicators who reported use of atrazine, the number of days per year and total lifetime days of use were higher than that among private applicators (lifetime days median = 116.0, interquartile range, 49.50–457.25 for commercial; life-time days median = 56.0, interquartile range, 20.0–178.50 for private applicators).
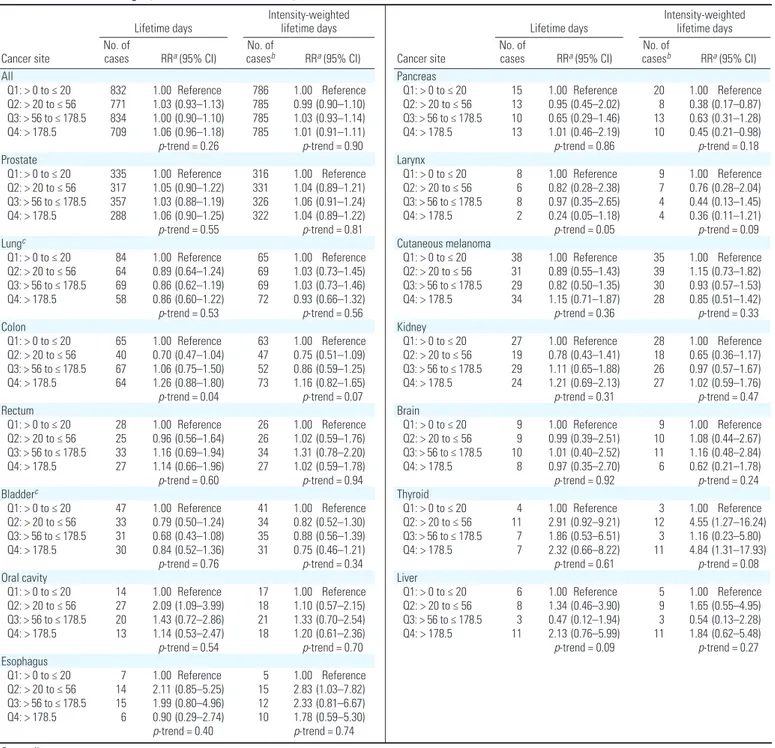
Overall, there were 4,737 incident cancers diagnosed among 53,662 applicators through 2007, including 1,785 who were diagnosed since the previous report on atrazine and can-cer incidence from the AHS (Rusiecki et al. 2004). Among the 36,357 atrazine users, there were 3,146 incident cancer diagnoses. As shown in Table 2, no association for can-cer overall with either the lifetime days or intensity-weighted metric was apparent. For most cancer sites, there was little evidence for an association between atrazine use and incident cancer, including cancers of the pros-tate and lung, two of the most common sites diagnosed in this cohort. In general, results for the intensity-weighted and lifetime days of use metrics were similar.
Based on 29 exposed cases, there was a sta-tistically significant association between thy-roid cancer and atrazine intensity-weighted lifetime days of use in the highest quartile of use [RR = 4.84; 95% confidence interval (CI), 1.31–17.93, p-trend = 0.08] (Table 2). For lifetime days of use, there was also a suggestion of an association in the highest category (RR = 2.32; 95% CI, 0.66–8.22, p-trend = 0.61). However, neither metric exhibited a mono-tonic trend. Because obesity has been linked with increased risk of thyroid cancer (Kitahara et al. 2011), we further adjusted these results for body mass index. The RRs for intensity-weighted lifetime days were 4.30 (95% CI, 1.21–15.28), 1.09 (95% CI, 0.22–5.43), and 4.30 (95% CI, 1.19–15.57) for the sec-ond, third, and fourth quartiles of exposure,
respectively, compared with the lowest quartile (p-trend = 0.30). We were not able to stratify results by applicator type, because only one case of thyroid cancer occurred in commer-cial applicators and removing this case did not change risk estimates (data not shown). Twenty-two of the 29 exposed cases occurred in Iowa, and the RRs were 3.88 (95% CI, 1.01–14.90), 0.87 (95% CI, 0.14–5.42), and 4.50 (95% CI, 1.12–18.15) for the second, third, and fourth quartiles. There were no cases in North Carolina in the lowest quartile of exposure.
Esophageal cancer was significantly ele-vated in the second category of exposure for intensity-weighted lifetime days (RR = 2.83; 95% CI, 1.03–7.82), but not in the higher categories of intensity-weighted lifetime days (RR = 2.33; 95% CI, 0.81–6.67 and RR = 1.78; 95% CI, 0.59–5.30) or for lifetime days (Table 2). Similarly, a statistically significant increased risk for cancer of the oral cavity in the second category of atrazine lifetime use compared with the lowest use category was observed (RR = 2.09; 95% CI, 1.09–3.99). However, the RRs in the higher two quartiles were closer to the null (RR = 1.43 and 1.19, respectively), and RRs for intensity-weighted lifetime days were not significantly elevated. RRs for intensity-weighted lifetime days were not elevated. For pancreatic cancer (n = 51), there were decreased risks in all exposure cat-egories, which was statistically significant in the second exposure category for intensity-weighted lifetime days (RR = 0.38; 95% CI, 0.17–0.87, p-trend = 0.18), but no evidence of any association with lifetime days of expo-sure. Based on 24 cases, there were decreased risks for laryngeal cancer for both metrics of exposure in the second, third, and fourth quartiles, although none were statistically sig-nificant (p-trend = 0.05 and p-trend = 0.09 for lifetime and intensity-weighted lifetime days, respectively).
Because of a priori interest in hormonally related cancers, we also evaluated use of atra-zine and breast cancer (n = 36) and ovarian cancer (n = 9) among female pesticide applica-tors, although the number of cases was limited. We used the nonexposed category as the refer-ent (n = 1,154) and evaluated only ever use of atrazine (n = 312). Results presented are adjusted only for age, but results adjusted for other factors, including parity, were similar (data not shown). There was no association between atrazine use and breast cancer based on 9 exposed and 27 unexposed cases (RR = 1.14; 95% CI, 0.47–2.50). Assessing risk for those above the median level of lifetime days of use also provided no evidence of risk. There were only four cases of breast cancer among male applicators, which precluded us from carrying out a separate analysis for breast cancer among men. For ovarian cancer, the RR for ever use of
atrazine was 2.91 (95% CI, 0.56–13.60), based on four cases among the women who reported atrazine use and five cases among those who reported no use. All exposed cases occurred among those with less than the median of atra-zine use among all cancer cases.
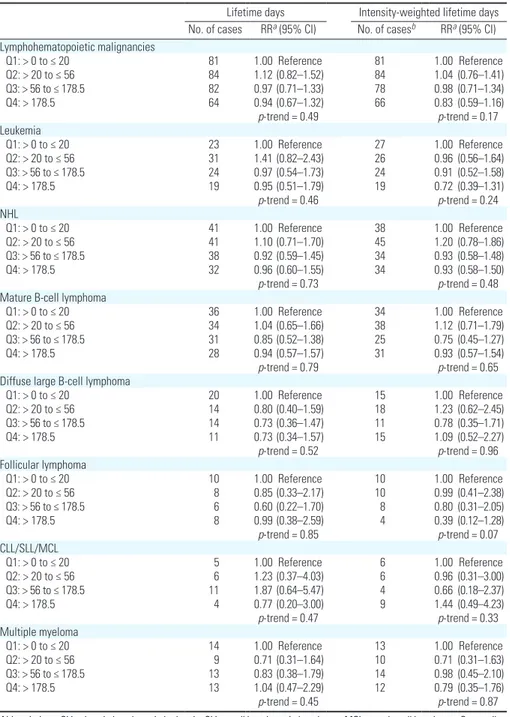
Use of atrazine did not appear to be associated with any lymphohematopoietic
malignancy (Table 3). For NHL, RRs were near 1.0 for both lifetime days and intensity-weighted lifetime days. Similarly, null patterns were observed for all subtypes. We evalu-ated potential effect modification by use of chemicals previously reported to interact with atrazine and NHL (alachlor, carbofuran, and diazinon) by conducting analyses stratified by
Table 1. Selected characteristics of pesticide applicators, by atrazine use category based on enrollment questionnaire data, 1993–1997 [n (%)].
Lifetime days of atrazine use
Characteristic No use of atrazine (n = 17,305) (n = 9,523)Quartile 1 Quartiles 2, 3, and 4 (n = 26,834) Age (years) < 50 10,958 (63.3) 5,906 (62.0) 16,526 (61.6) 50–59 3,098 (17.9) 1,897 (19.9) 5,939 (22.1) 60–69 2,292 (13.2) 1,288 (13.5) 3,503 (13.1) ≥ 70 957 (5.5) 432 (4.5) 866 (3.2) Sex Male 16,154 (93.3) 9,397 (98.7) 26,648 (99.3) Female 1,151 (6.7) 126 (1.3) 186 (0.7) State Iowa 8,583 (49.6) 6,754 (70.9) 19,780 (73.7) North Carolina 8,722 (50.4) 2,769 (29.1) 7,054 (26.3)
Smoking status (pack-years)
Never 8,580 (52.9) 5,205 (56.2) 14,408 (55.3) Former (< 3.75) 1,583 (9.8) 998 (10.8) 2,844 (10.9) Former (3.75–15 ) 1,571 (9.7) 873 (9.4) 2,440 (9.4) Former (> 15 ) 1,524 (9.4) 800 (8.6) 2,339 (9.0) Current (< 11.25) 1,283 (7.9) 475 (5.1) 1,312 (5.0) Current (11.25–28.5) 1,055 (6.5) 456 (4.9) 1,319 (5.1) Current (> 28.5) 1,031 (6.4) 450 (4.9) 1,412 (5.4) Missing 678 266 760 Alcohol use Never 6,230 (38.3) 2,836 (31.1) 7,387 (28.4)
Ever in last year 10,026 (61.7) 6,287 (68.9) 18,655 (71.6)
Missing 1,049 400 792
Education
< High school 2,143 (13.2) 836 (8.9) 1,896 (7.2)
High school graduate 7,511 (46.2) 4,496 (48.1) 12,976 (49.3)
> High school 7,200 (44.3) 4,011 (42.9) 11,456 (43.5)
Missing 451 180 506
Family history of cancer
No 10,031 (62.8) 5,297 (58.5) 14,774 (57.2) Yes 5,954 (37.2) 3,750 (41.5) 11,070 (42.8) Missing 1,320 476 990 Applicator type Private 14,967 (86.5) 9,173 (96.3) 24,888 (92.7) Commercial 2,338 (13.5) 350 (3.7) 1,946 (7.3) Use of dicamba No 11,908 (76.4) 3,790 (43.5) 9,173 (36.2) Yes 3,682 (23.6) 4,914 (56.5) 16,160 (63.8) Missing 1,715 819 1,501 Use of cyanazine No 13,922 (89.5) 5,064 (58.0) 10,290 (40.4) Yes 1,625 (10.5) 3,673 (42.0) 15,188 (59.6) Missing 1,758 786 1,356 Use of metolachlor No 12,590 (81.1) 4,605 (52.6) 9,573 (37.5) Yes 2,937 (18.9) 4,143 (47.4) 15,923 (62.5) Missing 1,778 775 1,338 Use of trifluralin No 11,369 (73.8) 3,784 (43.0) 8,626 (33.8) Yes 4,029 (26.2) 5,006 (57.0) 16,910 (66.2) Missing 1,907 733 1,298 Use of 2,4-D No 8,165 (47.8) 1,892 (20.0) 3,597 (13.5) Yes 8,901 (52.2) 7,554 (80.0) 23,056 (86.5) Missing 239 77 181
use of these chemicals. We saw no evidence of stratum-specific differences (data not shown). There was also no association with leukemia or multiple myeloma.
Because of the differences in pesticide usage patterns between private and com-mercial applicators and the higher preva-lence of atrazine usage in Iowa than in North Carolina, we also evaluated each cancer site stratified by state and by license type (private vs. commercial). We observed no meaningful differences in the results for any cancer site (data not shown).
Discussion
There was no association observed between use of atrazine and cancer overall and no evi-dence for an association with most cancer sites. However, there was limited evidence for an association with atrazine use and cancer of the thyroid and ovaries.
Atrazine is an endocrine-disrupting chemi-cal. It has been hypothesized that exposure to atrazine may alter hormone levels, possibly through induction of aromatase, which con-verts androgens into estrogens (Gammon et al. 2005). Atrazine causes mammary tumors in
rats by affecting the hypothalamus, which affects the pituitary gland and ultimately dis-rupts luteinizing hormone cycling, leading to increases in endogenous estrogen and pro-lactin (Gammon et al. 2005). In rats, this altered exposure to reproductive hormones produces accelerated reproductive aging and a hormonal environment that is conducive to mammary tumor development. This mecha-nism does not appear to operate in humans. However, the hypothalamic regulation of luteinizing hormone and prolactin secretion is similar, suggesting that atrazine may influence
Lifetime days Intensity-weighted lifetime days Cancer site No. of cases RRa (95% CI) casesNo. of b RRa (95% CI) All Q1: > 0 to ≤ 20 832 1.00 Reference 786 1.00 Reference Q2: > 20 to ≤ 56 771 1.03 (0.93–1.13) 785 0.99 (0.90–1.10) Q3: > 56 to ≤ 178.5 834 1.00 (0.90–1.10) 785 1.03 (0.93–1.14) Q4: > 178.5 709 1.06 (0.96–1.18) 785 1.01 (0.91–1.11) p-trend = 0.26 p-trend = 0.90 Prostate Q1: > 0 to ≤ 20 335 1.00 Reference 316 1.00 Reference Q2: > 20 to ≤ 56 317 1.05 (0.90–1.22) 331 1.04 (0.89–1.21) Q3: > 56 to ≤ 178.5 357 1.03 (0.88–1.19) 326 1.06 (0.91–1.24) Q4: > 178.5 288 1.06 (0.90–1.25) 322 1.04 (0.89–1.22) p-trend = 0.55 p-trend = 0.81 Lungc Q1: > 0 to ≤ 20 84 1.00 Reference 65 1.00 Reference Q2: > 20 to ≤ 56 64 0.89 (0.64–1.24) 69 1.03 (0.73–1.45) Q3: > 56 to ≤ 178.5 69 0.86 (0.62–1.19) 69 1.03 (0.73–1.46) Q4: > 178.5 58 0.86 (0.60–1.22) 72 0.93 (0.66–1.32) p-trend = 0.53 p-trend = 0.56 Colon Q1: > 0 to ≤ 20 65 1.00 Reference 63 1.00 Reference Q2: > 20 to ≤ 56 40 0.70 (0.47–1.04) 47 0.75 (0.51–1.09) Q3: > 56 to ≤ 178.5 67 1.06 (0.75–1.50) 52 0.86 (0.59–1.25) Q4: > 178.5 64 1.26 (0.88–1.80) 73 1.16 (0.82–1.65) p-trend = 0.04 p-trend = 0.07 Rectum Q1: > 0 to ≤ 20 28 1.00 Reference 26 1.00 Reference Q2: > 20 to ≤ 56 25 0.96 (0.56–1.64) 26 1.02 (0.59–1.76) Q3: > 56 to ≤ 178.5 33 1.16 (0.69–1.94) 34 1.31 (0.78–2.20) Q4: > 178.5 27 1.14 (0.66–1.96) 27 1.02 (0.59–1.78) p-trend = 0.60 p-trend = 0.94 Bladderc Q1: > 0 to ≤ 20 47 1.00 Reference 41 1.00 Reference Q2: > 20 to ≤ 56 33 0.79 (0.50–1.24) 34 0.82 (0.52–1.30) Q3: > 56 to ≤ 178.5 31 0.68 (0.43–1.08) 35 0.88 (0.56–1.39) Q4: > 178.5 30 0.84 (0.52–1.36) 31 0.75 (0.46–1.21) p-trend = 0.76 p-trend = 0.34 Oral cavity Q1: > 0 to ≤ 20 14 1.00 Reference 17 1.00 Reference Q2: > 20 to ≤ 56 27 2.09 (1.09–3.99) 18 1.10 (0.57–2.15) Q3: > 56 to ≤ 178.5 20 1.43 (0.72–2.86) 21 1.33 (0.70–2.54) Q4: > 178.5 13 1.14 (0.53–2.47) 18 1.20 (0.61–2.36) p-trend = 0.54 p-trend = 0.70 Esophagus Q1: > 0 to ≤ 20 7 1.00 Reference 5 1.00 Reference Q2: > 20 to ≤ 56 14 2.11 (0.85–5.25) 15 2.83 (1.03–7.82) Q3: > 56 to ≤ 178.5 15 1.99 (0.80–4.96) 12 2.33 (0.81–6.67) Q4: > 178.5 6 0.90 (0.29–2.74) 10 1.78 (0.59–5.30) p-trend = 0.40 p-trend = 0.74
Lifetime days Intensity-weighted lifetime days Cancer site No. of cases RRa (95% CI) casesNo. of b RRa (95% CI) Pancreas Q1: > 0 to ≤ 20 15 1.00 Reference 20 1.00 Reference Q2: > 20 to ≤ 56 13 0.95 (0.45–2.02) 8 0.38 (0.17–0.87) Q3: > 56 to ≤ 178.5 10 0.65 (0.29–1.46) 13 0.63 (0.31–1.28) Q4: > 178.5 13 1.01 (0.46–2.19) 10 0.45 (0.21–0.98) p-trend = 0.86 p-trend = 0.18 Larynx Q1: > 0 to ≤ 20 8 1.00 Reference 9 1.00 Reference Q2: > 20 to ≤ 56 6 0.82 (0.28–2.38) 7 0.76 (0.28–2.04) Q3: > 56 to ≤ 178.5 8 0.97 (0.35–2.65) 4 0.44 (0.13–1.45) Q4: > 178.5 2 0.24 (0.05–1.18) 4 0.36 (0.11–1.21) p-trend = 0.05 p-trend = 0.09 Cutaneous melanoma Q1: > 0 to ≤ 20 38 1.00 Reference 35 1.00 Reference Q2: > 20 to ≤ 56 31 0.89 (0.55–1.43) 39 1.15 (0.73–1.82) Q3: > 56 to ≤ 178.5 29 0.82 (0.50–1.35) 30 0.93 (0.57–1.53) Q4: > 178.5 34 1.15 (0.71–1.87) 28 0.85 (0.51–1.42) p-trend = 0.36 p-trend = 0.33 Kidney Q1: > 0 to ≤ 20 27 1.00 Reference 28 1.00 Reference Q2: > 20 to ≤ 56 19 0.78 (0.43–1.41) 18 0.65 (0.36–1.17) Q3: > 56 to ≤ 178.5 29 1.11 (0.65–1.88) 26 0.97 (0.57–1.67) Q4: > 178.5 24 1.21 (0.69–2.13) 27 1.02 (0.59–1.76) p-trend = 0.31 p-trend = 0.47 Brain Q1: > 0 to ≤ 20 9 1.00 Reference 9 1.00 Reference Q2: > 20 to ≤ 56 9 0.99 (0.39–2.51) 10 1.08 (0.44–2.67) Q3: > 56 to ≤ 178.5 10 1.01 (0.40–2.52) 11 1.16 (0.48–2.84) Q4: > 178.5 8 0.97 (0.35–2.70) 6 0.62 (0.21–1.78) p-trend = 0.92 p-trend = 0.24 Thyroid Q1: > 0 to ≤ 20 4 1.00 Reference 3 1.00 Reference Q2: > 20 to ≤ 56 11 2.91 (0.92–9.21) 12 4.55 (1.27–16.24) Q3: > 56 to ≤ 178.5 7 1.86 (0.53–6.51) 3 1.16 (0.23–5.80) Q4: > 178.5 7 2.32 (0.66–8.22) 11 4.84 (1.31–17.93) p-trend = 0.61 p-trend = 0.08 Liver Q1: > 0 to ≤ 20 6 1.00 Reference 5 1.00 Reference Q2: > 20 to ≤ 56 8 1.34 (0.46–3.90) 9 1.65 (0.55–4.95) Q3: > 56 to ≤ 178.5 3 0.47 (0.12–1.94) 3 0.54 (0.13–2.28) Q4: > 178.5 11 2.13 (0.76–5.99) 11 1.84 (0.62–5.48) p-trend = 0.09 p-trend = 0.27
Table 2. Solid tumors among 36,357 atrazine users in the AHS, 1993–2007.
Q, quartile.
aControlled for age, state, license type, sex, smoking (never, ≤ 12 pack years, > 12 pack-years), alcohol consumption, education, and use of most highly correlated pesticides. bNumber of
pituitary hormones (Gammon et al. 2005). In addition, inhibition of luteinizing hormone in male rats has been linked to reduction of testosterone (Trentacoste et al. 2001).
We observed a non–statistically signifi-cant increased risk of ovarian cancer among females who ever used atrazine; however, this observation is based on only four exposed cases. Because of the small number of cases, we were able to evaluate only an association for ever using atrazine and not any poten-tial exposure–response relationships, which is a limitation of this analysis. We cannot rule out chance as an explanation for this find-ing, even though we explored this association based on a priori interest because of the hor-monal properties of atrazine. Uncontrolled confounding could also explain these results. We previously reported an excess risk of ovar-ian cancer incidence and mortality among all female pesticide applicators in the AHS com-pared with the general population of Iowa and North Carolina (Alavanja et al. 2005; Koutros et al. 2010; Waggoner et al. 2010). The absence of an excess for ovarian cancer among the approximately 32,000 women married to pesticide applicators but who are not themselves licensed applicators suggests that either pesticides or other occupational factors may contribute to the excess among female pesticide applicators. There is a paucity of epidemiologic literature on ovarian can-cer and atrazine. Case–control studies in Italy and California of ovarian cancer and triazine exposure, the chemical group to which atra-zine belongs, were suggestive of an association, but neither was statistically significant (Donna et al. 1989; Young et al. 2005). An ecologic study showed an inverse association between district-level exposure metrics (which included public drinking water atrazine levels, acreage of corn planted, and sales of atrazine) and ovarian cancer (Hopenhayn-Rich et al. 2002).
Compared with nonusers, there was little evidence of an increased risk of breast can-cer among female pesticide applicators who reported use of atrazine, based on nine exposed cases. Data from other epidemiologic studies of breast cancer and atrazine are limited. An earlier study within the AHS that included wives of pesticide applicators reported no asso-ciation between breast cancer and atrazine use, whether use was classified by personal use or use by the husband (Engel et al. 2005). Ecologic studies have generally not suggested such associations (Hopenhayn-Rich et al. 2002; Mills and Yang 2006), although one study in England observed a spatial association between breast cancer incidence rates and the application of atrazine in one county, but not another (Muir et al. 2004). The IARC classifi-cation for atrazine is Group 3 (not classifiable), but the Working Group determined that there was sufficient evidence for carcinogenicity in
animals because of the association with mam-mary tumors. However, they determined that the atrazine-associated mammary tumors observed in rats involved a hormonally medi-ated mechanism not relevant for humans (IARC 1999).
Prostate cancer is a site hypothesized to be potentially associated with atrazine because of its hormonal etiology. We saw no evidence of an association with atrazine use and pros-tate cancer in this study, which is consistent with earlier results from the AHS (Alavanja et al. 2003; Rusiecki et al. 2004). In a study of pesticide manufacturing workers, there was
an increased risk of prostate cancer, but this population had a very high rate of prostate cancer screening and 9 of the 11 cases were diagnosed at an early stage (MacLennan et al. 2002), suggesting that detection bias might be partially responsible for the observed results.
We found some evidence for a positive association between atrazine use and thyroid cancer in this analysis. The epidemiologic evidence on pesticides and thyroid cancer is scarce. A report from Yugoslavia suggested an association with agricultural chemicals (Sokic et al. 1994), but no specific pesticides were implicated. A cohort of female farm
Table 3. Lymphohematopoietic malignancies among 36,357 atrazine users in the AHS, 1993–2007. Lifetime days Intensity-weighted lifetime days No. of cases RRa (95% CI) No. of casesb RRa (95% CI) Lymphohematopoietic malignancies Q1: > 0 to ≤ 20 81 1.00 Reference 81 1.00 Reference Q2: > 20 to ≤ 56 84 1.12 (0.82–1.52) 84 1.04 (0.76–1.41) Q3: > 56 to ≤ 178.5 82 0.97 (0.71–1.33) 78 0.98 (0.71–1.34) Q4: > 178.5 64 0.94 (0.67–1.32) 66 0.83 (0.59–1.16) p-trend = 0.49 p-trend = 0.17 Leukemia Q1: > 0 to ≤ 20 23 1.00 Reference 27 1.00 Reference Q2: > 20 to ≤ 56 31 1.41 (0.82–2.43) 26 0.96 (0.56–1.64) Q3: > 56 to ≤ 178.5 24 0.97 (0.54–1.73) 24 0.91 (0.52–1.58) Q4: > 178.5 19 0.95 (0.51–1.79) 19 0.72 (0.39–1.31) p-trend = 0.46 p-trend = 0.24 NHL Q1: > 0 to ≤ 20 41 1.00 Reference 38 1.00 Reference Q2: > 20 to ≤ 56 41 1.10 (0.71–1.70) 45 1.20 (0.78–1.86) Q3: > 56 to ≤ 178.5 38 0.92 (0.59–1.45) 34 0.93 (0.58–1.48) Q4: > 178.5 32 0.96 (0.60–1.55) 34 0.93 (0.58–1.50) p-trend = 0.73 p-trend = 0.48
Mature B-cell lymphoma
Q1: > 0 to ≤ 20 36 1.00 Reference 34 1.00 Reference
Q2: > 20 to ≤ 56 34 1.04 (0.65–1.66) 38 1.12 (0.71–1.79)
Q3: > 56 to ≤ 178.5 31 0.85 (0.52–1.38) 25 0.75 (0.45–1.27)
Q4: > 178.5 28 0.94 (0.57–1.57) 31 0.93 (0.57–1.54)
p-trend = 0.79 p-trend = 0.65
Diffuse large B-cell lymphoma
Q1: > 0 to ≤ 20 20 1.00 Reference 15 1.00 Reference Q2: > 20 to ≤ 56 14 0.80 (0.40–1.59) 18 1.23 (0.62–2.45) Q3: > 56 to ≤ 178.5 14 0.73 (0.36–1.47) 11 0.78 (0.35–1.71) Q4: > 178.5 11 0.73 (0.34–1.57) 15 1.09 (0.52–2.27) p-trend = 0.52 p-trend = 0.96 Follicular lymphoma Q1: > 0 to ≤ 20 10 1.00 Reference 10 1.00 Reference Q2: > 20 to ≤ 56 8 0.85 (0.33–2.17) 10 0.99 (0.41–2.38) Q3: > 56 to ≤ 178.5 6 0.60 (0.22–1.70) 8 0.80 (0.31–2.05) Q4: > 178.5 8 0.99 (0.38–2.59) 4 0.39 (0.12–1.28) p-trend = 0.85 p-trend = 0.07 CLL/SLL/MCL Q1: > 0 to ≤ 20 5 1.00 Reference 6 1.00 Reference Q2: > 20 to ≤ 56 6 1.23 (0.37–4.03) 6 0.96 (0.31–3.00) Q3: > 56 to ≤ 178.5 11 1.87 (0.64–5.47) 4 0.66 (0.18–2.37) Q4: > 178.5 4 0.77 (0.20–3.00) 9 1.44 (0.49–4.23) p-trend = 0.47 p-trend = 0.33 Multiple myeloma Q1: > 0 to ≤ 20 14 1.00 Reference 13 1.00 Reference Q2: > 20 to ≤ 56 9 0.71 (0.31–1.64) 10 0.71 (0.31–1.63) Q3: > 56 to ≤ 178.5 13 0.83 (0.38–1.79) 14 0.98 (0.45–2.10) Q4: > 178.5 13 1.04 (0.47–2.29) 12 0.79 (0.35–1.76) p-trend = 0.45 p-trend = 0.87
Abbreviations: CLL, chronic lymphocytic leukemia; SLL, small lymphocytic lymphoma; MCL, mantle cell lymphoma; Q, quartile.
aControlled for age, state, license type, sex, smoking (never, ≤ 12 pack years, > 12 pack-years), alcohol consumption,
education and use of most highly correlated pesticides. bNumber of cases differ between the two metrics because of
residents in New York indicated a nonsig-nificant increased standardized incidence ratio for thyroid cancer, but without evaluation of specific exposures (Wang et al. 2002). The previous report from the AHS on cancer inci-dence and atrazine did not include thyroid cancer, because there were < 20 exposed cases, the cutoff for presenting results in the ear-lier paper (Rusiecki et al. 2004); with this update, there were 29 cases exposed to atra-zine. Thyroid cancer is more common among women than men; in this study of primarily male applicators, there was only one female case among 312 atrazine users compared with 28 among the 36,045 male applicators who applied atrazine. Hyperthyroidism has been linked to thyroid cancer in some stud-ies; however, in a study among spouses of applicators in the AHS who applied pesti-cides, there was no association between use of atrazine and this condition (Goldner et al. 2010). Endocrine-disrupting substances can disrupt hormonal synthesis or metabolism and may impact the thyroid function in a variety of ways (Diamanti-Kandarakis et al. 2009). However, studies based on bioassays specific for atrazine have been generally null (Hasegawa et al. 1993), and studies in rodents have shown limited effects of atrazine on the thyroid (Laws et al. 2000; Son et al. 2003). We found a significantly elevated risk for the highest versus lowest category of intensity-weighted atrazine use, but the findings were based on a relatively small number of exposed cases, and the trend was not monotonic. We know of no other reports that have investi-gated atrazine and thyroid cancer, and this association needs further evaluation.
There is some epidemiologic evidence for an association between atrazine exposure and NHL. Three early case–control studies focused on triazine herbicides and showed non–statistically significant increased NHL risk (Cantor et al. 1992; Hoar et al. 1986; Zahm et al. 1993). NHL was more common among those who used atrazine compared with those who had never worked on a farm, based on a pooled analysis of these studies (Hoar Zahm et al. 1993); further analysis of these pooled data included evidence of supra-additive effects when atrazine was considered in conjunction with other pesticides, namely, carbofuran, diazinon, and alachlor (De Roos et al. 2003). We saw no such evidence in this analysis. In the previous analysis of atra-zine within the AHS, there was a nonsignifi-cant excess reported with NHL based on 68 exposed cases (Rusiecki et al. 2004). Here, we observed 152 exposed cases and no evidence of association. Other studies of atrazine and NHL include a mortality study of pesticide manufacturing workers that showed a non– statistically significant excess of NHL based on four deaths (MacLennan et al. 2003).
Schroeder et al. (2001) evaluated associations with agricultural exposures by t(14;18) sub-types and reported that atrazine was associated with NHL among those cases with the trans-location, but not among those without. The translocation was most common in follicular (46%), diffuse B cell (39%), other (66%), and unclassified (52%) subtypes. In our study, we did not have tumor tissue to evaluate such an association but were able to look at histologic subtypes based on cancer registry records and saw no association for any subtype.
We found no association with multiple myeloma with either lifetime days of use or intensity-weighted lifetime days of use. In the previous AHS analysis of atrazine, there was a suggestion of an association based on 23 exposed cases (Rusiecki et al. 2004). Our analysis includes an additional 26 exposed cases for a total of 49. The only other study specifically evaluating multiple myeloma showed little evidence for such an association (Brown et al. 1993).
A previous analysis of atrazine use in the AHS also suggested non–statistically signifi-cant associations with cancers of the blad-der and lung (Rusiecki et al. 2004). In this update, with more than twice as many cases for these sites, we observed no evidence of association. To our knowledge, no other stud-ies support an association at these sites.
Strengths of this study include the collec-tion of informacollec-tion on atrazine use before the diagnosis of cancer, the relatively large num-ber of exposed cases, and the ability to control for potential confounding by use of other agricultural chemicals. Although this is a large cohort study, there are still few female appli-cators, limiting the power to evaluate female-specific cancers such as breast and ovarian cancer, which have been hypothesized to be associated with atrazine. Additionally, we used self-reported information on the use of atra-zine, the methods of application, and the use of personal protective equipment. Although this is a limitation, the reliability of the data on use of pesticides within this cohort is comparable with or more reliable than other self-reported data such as diet and medical conditions (Blair et al. 2002), and pesticide applicators in the AHS report the duration and time of first use of specific chemicals con-sistent with the time that the chemicals first became available (Hoppin et al. 2002).
Conclusion
In summary, there was no strong or consis-tent evidence of an association between atrazine and any cancer. There was a non–statistically significant increased risk of ovarian cancer among female applicators who reported ever using atrazine compared with those who did not; however, this observation was based on a small number of cases among atrazine users
(n = 4). We found an elevated risk of thyroid cancer for the highest versus lowest category of intensity-weighted atrazine use, but the trend was not monotonic and not statistically signifi-cant when lifetime days of use was used as the exposure metric. An association between atra-zine and thyroid cancer has not been previously reported, to our knowledge. In contrast, we saw little evidence for an association between atra-zine use and other cancers previously reported in the literature, such as NHL and leukemia, or with cancers of the breast or prostate, for which atrazine has been hypothesized to be a risk fac-tor because of its hormonal properties.
RefeRences
Alavanja MC, Samanic C, Dosemeci M, Lubin J, Tarone R, Lynch CF, et al. 2003. Use of agricultural pesticides and prostate cancer risk in the Agricultural Health Study cohort. Am J Epidemiol 157:800–814.
Alavanja MC, Sandler D, Knott C, Lubin J, Tarone R, Dosemeci M, et al. 2005. Cancer incidence in the Agricultural Health Study. Scand J Work Environ Health 31:39–45.
Blair A, Tarone R, Sandler D, Lynch C, Roland A, Wintersteen W, et al. 2002. Reliability of reporting on lifestyle and agricul-tural factors by a sample of participants in the Agriculagricul-tural Health Study from Iowa. Epidemiology 13:94–99. Brown LM, Burmeister LF, Everett GD, Blair A. 1993. Pesticide
exposures and multiple myeloma in Iowa men. Cancer Causes Control 4:153–156.
Cantor K, Blair A, Everett G, Gibson R, Burmeister L, Brown L, et al. 1992. Pesticides and other agricultural risk factors for non-Hodgkin’s lymphoma among men in Iowa and Minnesota. Cancer Res 52:2447–2455.
De Roos AJ, Zahm SH, Cantor KP, Weisenburger DD, Holmes FF, Burmeister LF, et al. 2003. Integrative assessment of multi-ple pesticides as risk factors for non- Hodgkin’s lymphoma among men. Occup Environ Med 60:E11.
Diamanti-Kandarakis E, Bourguignon JP, Giudice LC, Hauser R, Prins GS, Soto AM, et al. 2009. Endocrine-disrupting chem-icals: an Endocrine Society scientific statement. Endocr Rev 30:293–342.
Donna A, Crosignani P, Robutti F, Betta PG, Bocca R, Mariani N, et al. 1989. Triazine herbicides and ovarian epithelial neo-plasms. Scand J Work Environ Health 15:47–53. Dosemeci M, Alavanja M, Rowland A, Mage D, Zahm S,
Rothman N, et al. 2002. A quantitative approach for esti-mating exposure to pesticides in the Agricultural Health Study. Ann Occup Hyg 46:245–260.
Eldridge J, Wetzel L, Tyrey L. 1999. Estrous cycle patterns of Sprague-Dawley rats during acute and chronic atrazine administration. Reprod Toxicol 13:491–499.
Engel LS, Hill DA, Hoppin JA, Lubin JH, Lynch CF, Pierce J, et al. 2005. Pesticide use and breast cancer risk among farm-ers’ wives in the agricultural health study. Am J Epidemiol 161:121–135.
European Commission. 2004. Commission Decision of 10 March 2004 concerning the non-inclusion of atrazine in Annex I to Council Directive 91/414/EEC and the withdrawal of authorisations for plant protection products containing this active substance, 2004/248/EC. OJEU. L78:53–55. Friedman A. 2002. Atrazine inhibition of testosterone
produc-tion in rat males following peripubertal exposure. Reprod Toxicol 16:275–279.
Gammon D, Aldous C, Carr Jr W, Sanborn J, Pfeifer K. 2005. A risk assessment of atrazine use in California: human health and ecological aspects. Pest Manag Sci 61:331–355. Goldner WS, Sandler DP, Yu F, Hoppin JA, Kamel F, Levan TD.
2010. Pesticide use and thyroid disease among women in the Agricultural Health Study. Am J Epidemiol 171:455–464. Goolsby DA, Thurman EM, Kolpin DW. 1991. Geographic and
temporal distribution of herbicides in surface waters of the upper Midwestern United States, 1989–90. In: US Geological Survey Toxic Substances Hydrology Program — Proceedings of the Technical Meeting, Monterey, California, 11–15 March 1991 (Mallard GE, Aronson DA, eds). US Geological Survey Water-Resources Investigations Report 91–4034, 183–188.
Hasegawa R, Cabral R, Hoshiya T, Hakoi K, Ogiso T, Boonyaphiphat P, et al. 1993. Carcinogenic potential of some pesticides in a medium-term multi-organ bioassay in rats. Int J Cancer 54:489–493.
Hayes TB, Collins A, Lee M, Mendoza M, Noriega N, Stuart AA, et al. 2002. Hermaphroditic, demasculinized frogs after exposure to the herbicide atrazine at low ecologically rel-evant doses. Proc Natl Acad Sci USA 99:5476–5480. Hayes TB, Khoury V, Narayan A, Nazir M, Park A, Brown T,
et al. 2010. Atrazine induces complete feminization and chemical castration in male African clawed frogs (Xenopus laevis). Proc Natl Acad Sci USA 107:4612–4617. Hines CJ, Deddens JA, Jaycox LB, Andrews RN, Striley CA,
Alavanja MC. 2008. Captan exposure and evaluation of a pesticide exposure algorithm among orchard pesticide applicators in the Agricultural Health Study. Ann Occup Hyg 52:153–166.
Hoar SK, Blair A, Holmes FF, Boysen C, Robel RJ. 1985. Herbicides and colon cancer. Lancet 1:1277–1278. Hoar SK, Blair A, Holmes FF, Boysen CD, Robel RJ, Hoover R,
et al. 1986. Agricultural herbicide use and risk of lymphoma and soft-tissue sarcoma. JAMA 256:1141–1147. Hoar Zahm S, Weisenburger DD, Cantor KP, Holmes FF, Blair A.
1993. Role of the herbicide atrazine in the development of non-Hodgkin’s lymphoma. Scand J Work Environ Health 19:108–114.
Hopenhayn-Rich C, Stump ML, Browning SR. 2002. Regional assessment of atrazine exposure and incidence of breast and ovarian cancers in Kentucky. Arch Environ Contam Toxicol 42:127–136.
Hoppin JA, Yucel F, Dosemeci M, Sandler DP. 2002. Accuracy of self-reported pesticide use duration information from licensed pesticide applicators in the Agricultural Health Study. J Expo Anal Environ Epidemiol 12:313–318. IARC (International Agency for Research on Cancer). 1999.
Some Chemicals that Cause Tumours of the Kidney or Urinary Bladder in Rodents and Some Other Substances. IARC Monogr Eval Carcinogen Risk Hum 73:1–54. Kitahara C, Platz E, Beane Freeman L, Hsing A, Linet M, Park Y,
et al. 2011. Obesity and thyroid cancer risk among U.S. men and women: a pooled analysis of 5 prospective studies. Cancer Epidemiol Biomarkers Prev 20:464–472. Koutros S, Alavanja M, Lubin J, Sandler D, Hoppin J, Lynch C,
et al. 2010. An update of cancer incidence in the Agricultural Health Study J Occup Environ Med 52:1098–1105.
Laws SC, Ferrell JM, Stoker TE, Schmid J, Cooper RL. 2000. The effects of atrazine on female Wistar rats: an evaluation of the protocol for assessing pubertal development and thyroid function. Toxicol Sci 58:366–376.
MacLennan PA, Delzell E, Sathiakumar N, Myers SL. 2003. Mortality among triazine herbicide manufacturing work-ers. J Toxicol Environ Health A 66:501–517.
MacLennan PA, Delzell E, Sathiakumar N, Myers SL, Cheng H, Grizzle W, et al. 2002. Cancer incidence among triazine herbicide manufacturing workers. J Occup Environ Med 44:1048–1058.
Mast M, Foreman W, Skaates S. 2007. Current-use pesticides and organochlorine compounds in precipitation and lake sedi-ment from two high-elevation national parks in the Western United States. Arch Environ Contam Toxicol 52:294–305. Matsushita S. 2006. Effects of in ovo exposure to imazalil and
atrazine on sexual differentiation in chick gonads. Poult Sci 85:1641–1647.
Mills PK, Yang R. 2006. Regression analysis of pesticide use and breast cancer incidence in California Latinas. J Environ Health 68:15–22; quiz 43–14.
Moore A, Waring C. 1998. Mechanistic effects of a triazine pesticide on reproductive endocrine function in mature male Atlantic salmon (Salmo solar L.) parr. Pestic Biochem Physiol 62:41–50.
Muir K, Rattanamongkolgul S, Smallman-Raynor M, Thomas M, Downer S, Jenkinson C. 2004. Breast cancer incidence and its possible spatial association with pesticide applica-tion in two counties of England. Public Health 118:513–520. PHED (Pesticide Handlers Exposure Database). 1992. US
EPA, Health and Welfare Canada and the American Crop Protection Association, version 1.0. Springfield, IL:Versar. Rusiecki JA, De Roos A, Lee WJ, Dosemeci M, Lubin JH,
Hoppin JA, et al. 2004. Cancer incidence among pesticide applicators exposed to atrazine in the Agricultural Health Study. J Natl Cancer Inst 96:1375–1382.
Schroeder JC, Olshan AF, Baric R, Dent GA, Weinberg CR, Yount B, et al. 2001. Agricultural risk factors for t(14;18) subtypes of non-Hodkins lymphoma. Epidemiology 12:701–709.
Sokic SI, Adanja BJ, Vlajinac HD, Jankovic RR, Marinkovic JP, Zivaljevic VR. 1994. Risk factors for thyroid cancer. Neoplasma 41:371–374.
Solomon KR, Carr JA, Du Preez LH, Giesy JP, Kendall RJ, Smith EE, et al. 2008. Effects of atrazine on fish, amphibians,
and aquatic reptiles: a critical review. Crit Rev Toxicol 38:721–772.
Son HY, Nishikawa A, Okazaki K, Lee K, Imazawa T, Hirose M. 2003. Lack of modifying effects of atrazine and/or tamox-ifen on thyroid carcinogenesis in rats pretreated with N-bis(2-hydroxypropyl)nitrosamine (DHPN). Food Chem Toxicol 41:1811–1816.
Stoker T, Laws S, Guidici D, Cooper R. 2000. The effect of atra-zine on puberty in male Wistar rats: an evaluation in the protocol for the assessment of pubertal development and thyroid function. Toxicol Sci 58:50–59.
Thomas KW, Dosemeci M, Coble JB, Hoppin JA, Sheldon LS, Chapa G, et al. 2010a. Assessment of a pesticide exposure intensity algorithm in the Agricultural Health Study. J Expo Sci Environ Epidemiol 20:559–569.
Thomas KW, Dosemeci M, Hoppin JA, Sheldon LS, Croghan CW, Gordon SM, et al. 2010b. Urinary biomarker, dermal, and air measurement results for 2,4-D and chlor-pyrifos farm applicators in the Agricultural Health Study. J Expo Sci Environ Epidemiol 20:119–134.
Thurman E, Cromwell A. 2000. Atmospheric transport, deposi-tion, and fate of triazine herbicides and their metabolites in pristine areas at Isle Royale National Park. Environ Sci Technol 34:3079–3085.
Trentacoste S, Friedmann A, Youker R, Breckenridge C, Zirkin B. 2001. Atrazine effects on testosterone levels and androgen-dependent reproductive organs in peripubertal male rats. J Androl 22:142–148.
U.S. EPA (U.S. Environmental Protection Agency). 2009. Atrazine Science Reevaluation: Potential Health Impacts. Available: www.epa.gov/oppsrrd1/reregistration/atrazine/ atrazine_update.htm [accessed 31 October 2010]. Waggoner J, Kullman G, Henneberger P, Umbach D, Blair A,
Alavanja M, et al. 2010. Mortality in the Agricultural Health Study: 1994–2007. Am J Epidemiol 11:74–83.
Wang Y, Lewis-Michl EL, Hwang SA, Fitzgerald EF, Stark AD. 2002. Cancer incidence among a cohort of female farm resi-dents in New York State. Arch Environ Health 57:561–567. Young HA, Mills PK, Riordan DG, Cress RD. 2005. Triazine
herbicides and epithelial ovarian cancer risk in central California. J Occup Environ Med 47:1148–1156. Zahm SH, Weisenburger DD, Saal RC, Vaught JB, Babbitt PA,
Blair A. 1993. The role of agricultural pesticide use in the development of non-Hodgkin’s lymphoma in women. Arch Environ Health 48:353–358.
![Table 1. Selected characteristics of pesticide applicators, by atrazine use category based on enrollment questionnaire data, 1993–1997 [n (%)].](https://thumb-eu.123doks.com/thumbv2/123dokorg/4806296.49599/3.904.329.841.262.1096/selected-characteristics-pesticide-applicators-atrazine-category-enrollment-questionnaire.webp)