Contents lists available atScienceDirect
Clinical Mass Spectrometry
journal homepage:www.elsevier.com/locate/clinmsA targeted proteomics approach to amyloidosis typing
Matteo Conti
a,⁎, Irene Poppi
a, Thomas Matulli Cavedagna
a, Elena Zamagni
b, Ornella Leone
c,
Barbara Corti
c, Agnese Milandri
d, Francesco Bacci
e, Eric Ramazzotti
a, Rita Mancini
a,
Michele Cavo
b, Candida Cristina Quarta
f, Claudio Rapezzi
daClinical Mass Spectrometry, Metropolitan Laboratory AUSL, Bologna, Italy
bInstitute of Hematology“L. & A.Seragnoli”, Department of Experimental Diagnostic and Specialty Medicine, Alma Mater Studiorum-University of Bologna, Bologna, Italy cPathology Unit, Department of Diagnostic and Prevention Medicine, S. Orsola-Malpighi Hospital, Bologna, Italy
dInstitute of Cardiology, Department of Experimental Diagnostic and Specialty Medicine, Alma Mater Studiorum-University of Bologna, Bologna, Italy eHematopathology Unit, Department of Oncology and Hematology, S. Orsola-Malpighi Hospital, Bologna, Italy
fNational Amyloidosis Centre, Royal Free Hospital, London, UK
A R T I C L E I N F O
Keywords: Amyloidosis
Subcutaneous adipose tissue Cardiac muscle tissue Protein typing Targeted proteomics Mass spectrometry Transthyretin
Immunoglobulin light chains
A B S T R A C T
Background: Amyloidosis is a life threatening disease caused by deposition of various types of blood serum proteins in organs and tissues. Knowing the type of protein involved is the basis of a correct diagnosis and personalized medical treatment. While the classical approach uses immunohistochemistry, in recent years, laser micro-dissection, followed by high resolution LC-MS/MS, has been shown to provide superior diagnostic sen-sitivity and specificity. This techniques, however, is only available at major reference proteomics centers. Objective: To perform clinical amyloid protein typing using low-resolution mass spectrometry and no laser micro dissection (LMD), we developed a targeted proteomics approach for the determination of both frequently en-countered amyloid proteins (i.e.,κ and -λ immunoglobulin light chains and transthyretin (TTR)) and specific reference proteins (i.e., actin (A) for cardiac muscle tissue, or fatty acid binding protein 4 (FBP4) for sub-cutaneous adipose tissue) in histologic specimens.
Method: Small tissue fragments and/or histological sections were digested to yield a protein mixture that was subsequently reduced, alkylated and trypsinized to obtain a peptide mixture. After SPE purification and LC separation, proteotypic peptides were detected by their MRM transitions.
Results: The method showed high specificity and sensitivity for amyloid protein proteotypic peptides. LODs were 1.0, 0.1, 0.2 picomoles in cardiac muscle tissue (CMT) and 0.1, 0.2, 0.5 picomoles in subcutaneous adipose tissue (SAT) for TTR,κ-, and λ-LC proteins, respectively. Amyloid to tissue-specific protein signal ratios correlated with the presence of amyloid deposits in clinical samples.
Conclusions: This targeted proteomics approach enables sensitive and specific discrimination of amyloidosis affected tissues for the purpose of clinical research.
1. Introduction
Amyloidosis is a life threatening pathology caused by extracellular deposition of insolublefibrillar aggregates of a variety of blood serum proteins and/or their low molecular subunits (5–25 kD) in organs and tissues[1–7]. A variety of organs, such as the heart, kidney, liver, and autonomic nervous system can be affected by amyloidosis [8,9]. Al-though the pathogenesis is unknown, at least 30 proteins types have
been determined to be involved in the formation of amyloidfibrils in humans[10].
Diagnosis of amyloidosis is primarily based on histological ex-amination. Amyloidfibrils have a characteristic appearance and gen-erate green birefringence under polarized light when stained with Congo red dye. Electron microscopy can also be used to reveal the presence of rigid, non-branchingfibrils, 7.5–10 nm in diameter, dis-rupting surrounding tissues [13–15]. Proper classification of
https://doi.org/10.1016/j.clinms.2018.02.001
Received 1 September 2017; Received in revised form 6 February 2018; Accepted 6 February 2018
⁎Corresponding author.
E-mail address:[email protected](M. Conti).
Abbreviations: ACN, acetonitrile; ACN, acetonitrile; A, actin (UNIPROT ID:); CMT, cardiac muscle tissue; DTT, dithiothreitol; EtOH, ethanol; FBP4, fatty acid binding protein 4 (UNIPROT ID:); FFPE, formalin-fixed paraffin-embedded; FOA, formic acid; HA, horse apomyoglobin (UNIPROT ID:); IgGs, Immunoglobulins G; HCs, IgG heavy chains, type 1–4 (UNIPROT ID:);κ−LC, immunoglobulinlight chain, κ−Type (UNIPROT ID:); λ−LC, immunoglobulinlight chain, λ−type (UNIPROT ID:); XIC, ion extraction chromatogram; LMD, laser micro-dissection; MeOH, methanol; MRM, multiple reaction monitoring; ESI+, positive electrospray; SDS, sodium dodecyl sulfate; SAT, subcutaneous adipose tissue; TTR, transthyretin (UNIPROT ID:); Tris-HCl, tris(hydroxymethyl)-aminomethane hydrochloride
Available online 13 February 2018
2376-9998/ © 2018 The Association for Mass Spectrometry: Applications to the Clinical Lab (MSACL). Published by Elsevier B.V. All rights reserved.
amyloidosis also requires an understanding offibril distribution (i.e., systemic or localized) and protein composition. Accurate interpretation of the protein composition of amyloidfibrils, also known as amyloid typing, is critical for personalizing medical treatment since prognosis and treatment can vary substantially for each sub-type, ranging from targeted drug therapy to intensive chemotherapy, or even multi-organ transplant[10–12].
Historically, amyloid typing using immunohistochemistry and im-munofluorescence methods has been widely employed. However, these methods are hindered by limited antibody availability, non-specific signal interference due to tissue contamination from serum proteins, and false-negative signals due to the loss of epitopes in fixed and stained tissue sections. The disadvantages of antibody-based ap-proaches have been comprehensively reviewed in the literature [13–15].
More recently, literature reports have outlined an approach to amyloidosis protein typing that employs laser micro dissection (LMD) to select fibrils from histological sections, and High Resolution (HR) Liquid Chromatography coupled to Tandem Mass Spectrometry (LC-MS/MS) to identify peptides obtained after a top-down proteomic processing of isolated fibrils [16–18]. While this approach has re-volutionized the field of tissue protein typing for amyloidosis, it re-quires highly specialized instrumentation and a multidisciplinary team of trained professionals; its application is, therefore, limited to only a few reference proteomics centers throughout the world.
Here, we present the development of a standard-resolution LC-MS/ MS targeted proteomics approach[19,20]with the potential to enable MS/MS-based identification of amyloid proteins. We focus on cases of systemic amyloidosis with myocardial involvement that we frequently encounter in our clinical practice.
The samples most frequently examined in this work were cardiac muscle tissue (CMT) biopsies, and/or their sections fixed on optical glass slides for immunohistological examination, since these were al-ready part of our routine procedures for diagnosis of amyloidosis. In addition, a modified procedure for processing subcutaneous adipose tissue (SAT) was developed, since this sample type involves a less in-vasive bioptic procedure that has been demonstrated to be convenient and informative in diagnosis of systemic amyloidosis[21,22].
The three most frequent and clinically challenging subtypes of amyloidosis with cardiac involvement, as reported in the literature, are: (i) theκ– or λ type immunoglobulin light chains (LCs)-related amy-loidosis (AL) caused byfibrillar deposits of an excess of circulating LCs produced by clonal plasma cells in the bone marrow; (ii) the hereditary transthyretin (TTR)-related amyloidosis (ATTRm) caused by deposition of mutant forms of the TTR protein, produced mainly by the kidney and corneas; and (iii) the wild-type TTR related amyloidosis (ATTRwt), also defined as “senile amyloidosis”, caused by deposition of non-mutant TTR protein in elderly patients[23].
Hence, we chose to targetκ– and λ–LCs and TTR in our analysis. However, since κ–LCs, λ-LCs and TTR are physiologically circulating proteins present in blood serum, identifying their presence in bioptic samples is not sufficient to make a conclusive diagnosis without also confirming the absence of blood serum in the sample being analyzed. While hemoglobin and albumin could have been employed as controls to signal blood serum inclusions, we instead chose to monitor peptide signatures of the constant regions of IgG Heavy Chains (HC)s, Types 1–4, since these full-structured antibodies are normally present in blood serum and are also, generally, unrelated to amyloidosis[10]. Although MS analysis of IgGs can be troublesome due to various post-transla-tional modifications and poor reproducibility of proteolysis, this choice was influenced by their availability in our laboratory and our previous experience with their use.
When amyloid and HC signals were detected in our analyzed sam-ples, it provided suspicion of a blood serum inclusion, but for further verification we additionally evaluated the relative abundance of amy-loid proteins in relation to tissue-specific proteins (i.e., actin (A) for
CMT, and fatty acid binding protein 4 (FBP4) for SAT); the tenet being that in the presence of amyloid fibrils disrupting normal tissues, the relative abundance of these tissue-specific proteins would increase. By analyzing 132 samples from known cases of amyloidosis with this ap-proach, we were able to structure an algorithm to discriminate amyloid from non-amyloid affected tissues.
2. Materials and methods
2.1. Chemicals, reagents and instruments
Water, methanol (MeOH), 95% ethanol (EtOH), acetonitrile (ACN), acetic acid (AcA), formic acid (FoA), xylene, tris(hydroxymethyl)-ami-nomethane hydrochloride (Tris-HCl), sodium dodecyl sulfate (SDS), dithyothreitol (DTT) were all LC-MS grade (VWR International Inc., Bridgeport, NJ, USA). Pure human polyclonal IgGs solution 12.5 mg/ml (81.7 nmol/ml), lyophilized TTR (reconstituted in-house to 1 mg/ ml–18 nmol/ml with water) and horse apomyoglobin (HA) (recon-stituted in-house to 1.2 mg/ml–69 nmol/ml with water) were from Sigma Aldrich (St. Louis, MO, USA).
Amicon® centrifugal filter units were from Merck Millipore Ltd. (Tullagreen, Carrigtwohill, Co. Cork, IRL). Pierce™ In-Solution Tryptic Digestion Kits, Pierce™ C18 (100 μl) SPE Tips and Pierce™ Detergent Compatible Bradford Assay Kits were obtained from Thermo Fisher Scientific (West Palm Beach, Florida, USA).
The dry block heater used was from Thermo Fisher Scientific (West Palm Beach, FL, USA).
Microcentrifuge 1.5 ml tubes and 5430 Microcentrifuges were from Eppendorf (Vienna, Austria).
The LC column used was a reverse-phase Biobasic C18 column 5μm, 50 × 2.1 mm (Thermo Fisher Scientific, West Palm Beach, FL, USA). The ultracentrifuge used was a 40R Megafuge (Thermo Fisher Scientific, West Palm Beach, FL, USA).
LC was performed on a Shimadzu Nexera X2 UHPLC system (Shimadzu Corporation, Kyoto, Japan).
Detection was performed using a Sciex 5500 Q-TRAP mass spec-trometer equipped with a Turbo-V electrospray ionization (ESI) source (Sciex, Concord, Ontario, Canada) operated in positive electrospray (ESI+) MRM mode. Analyst 1.6.1 (Sciex, Concord, Ontario, Canada) was used for the system control, data acquisition, peak integration and quantification.
2.2. Samples
CMT biopsies were formalinfixed and paraffin embedded (FFPE) and kept in a histology repository at the Pathology Unit of the S. Orsola – Malpighi Hospital in Bologna. They were retrospectively analyzed using the developed LC-MS/MS approach.
Histological sections of CMT that were used for MS analysis were those that occurred in between two histological sections found to be positive for amyloidfibrils by a pathologist. Analysis of identical his-tological sections by the pathologist and mass spectrometrist was not feasible due to the preparation required by the pathologist for optical observation that included glue and a coverslip.
SAT sample biopsies were brought to the laboratory in sterile vials after their sampling during“Out Patient” examinations. SAT samples were obtained by random puncture of the abdominal wall in the peri-umbilical region. Due to their size and nature, these samples could not be cut into serial histological sections and were analyzed as single en-tities by either the pathologist or the mass spectrometrist.
Positive diagnosis was based on clinical evidence and histological observations (i.e., positive birefringence under polarized light after Congo red staining offibrils). Amyloidosis subtypes were determined according to current diagnostic standards, including determination of the presence of concomitant plasma cell disorders, and im-munohistochemistry forκ- or λ-LCs and TTR.
2.3. CMT processing
FFPE CMT, or glass microscope slides containing multiple micro-tome sections of CMT, were heated on a thermal block for 15 min at 60 °C to melt any paraffin. Single microtome sections were then trans-ferred into glass test tubes using a scalpel. Paraffin removal was com-pleted by immersion in 1.5 ml of xylene in a glass test tube for 5 min with intermittent vortexing. Centrifugation at 0.78G for 3 min followed, and the surnatant was discarded before fresh xylene was added. This washing was repeated 3 times.
After xylene removal, tissue rehydration was performed by bathing the tissue in 1.5 ml of 95% EtOH for 5 min with vortexing. Centrifugation at 0.78G for 3 min followed and the surnatant was dis-carded prior to fresh 95% EtOH being added. This rehydration step was repeated twice. Tissue was further rehydrated by immersion into a 70–30% v/v EtOH-water solution, following the preceding procedure. Final rehydration was performed by immersion in water, again, fol-lowing the procedure as described above.
After water surnatant was removed, rehydrated CMT was digested
at 90 °C overnight inside a screw-capped vial by adding 400μl of a tissue digestion solution composed of 500 mM Tris-HCl plus 0.2% w/v SDS in water.
Following the overnight incubation, tubes were capped, clipped and placed at 105 °C for 2 h on a dry-block heater. The resulting digested tissue broth was loaded onto 3 kDa cut-off ultra-filtration centrifugal filter units to remove detergents and other low-molecular-weight con-taminants. Denatured protein solution (50μl) was recovered from the filter and the protein concentration was determined using a Pierce™ Detergent Compatible Bradford Assay Kit.
The protein solution was diluted with 50 mM Ammonium Bicarbonate buffer to yield a total protein concentration of 1 μg/μl. 2.4. SAT processing
SAT samples were weighed on an analytical balance. Fragments weighing more than 1 mg (dry weight) were cut into smaller pieces with a scalpel before being processed. No rehydration was needed for SAT samples, since they were immediately sent to the laboratory in a
Table 1
MRM transition specific parameters. For each protein, in column 1, proteotypic peptide transition names, in column 2, have been given by peptide primary sequence (position in brackets) followed by a suffix reflecting signal intensity and intended use (quant for the more intense, qual for the less intense). Parent ion apparent mass (selected by the first quadrupole, Q1) and daughter ion apparent mass (selected by the third quadrupole, Q3) are reported in columns 3 and 4, respectively. Optimized transition specific parameters were common for all transitions on the API 5500 system were: dwell time (DT) = 10 ms, declustering potential (DP) = 110 V, entrance potential EP = 10 V, collision exit potential CXP = 15 V. The Collision energy (CE), determining considerable column 5.
PROTEIN TRANSITION ID Q1 (m/z) Q3 (m/z) CE (volts)
TTR (P02766) GSPAINVAVHVFR (22–34) quant 697.8 606.3 40 GSPAINVAVHVFR (22–34) qual 697.8 921.4 32 AADDTWEPFASGK (36–48) quant 683.9 941.5 40 AADDTWEPFASGK (36–48) qual 683.9 827.5 40 ALGISPFHEHAEVVFTANDSGPR (81–103) quant 613.6 416.0 35 ALGISPFHEHAEVVFTANDSGPR (81–103) qual 613.6 645.3 35 k-LC (P01834) TVAAPSVFIFPPSDEQLK (1–18) quant 973.5 913.5 50 TVAAPSVFIFPPSDEQLK (1–18) qual 973.5 272.2 45 SGTASVVCLLNNFYPR (19–34) quant 899.4 272.2 35 SGTASVVCLLNNFYPR (19–34) qual 899.4 810.4 35 DSTYSLSSTLTLSK (62–78) quant 751.9 836.5 35 DSTYSLSSTLTLSK (62–78) qual 751.9 448.3 35 λ-LC (P0CG04) ATLVCLISDFYPGAVTVAWK (24–43) quant 872.4 687.3 40 ATLVCLISDFYPGAVTVAWK (24–43) qual 872.4 788.4 35 YAASSYLSLTPEQWK (66–80) quant 737.7 464.7 25 YAASSYLSLTPEQWK (66–80) qual 737.7 928.5 30 AAPSVTLFPPSSEELQANK (107–125) quant 993.5 787.4 35 AAPSVTLFPPSSEELQANK (107–125) qual 993.5 640.4 35 HCs (P01857) GPSVFPLAPSSK (5–16) 593.8 699.4 25 GPSVFPLAPSSK (5–16) 593.8 846.5 25 DTLMISR (132–138) quant 418.3 619.4 25 DTLMISR (132–138) qual 418.3 506.3 20 TTPPVLDSDGSFFLYSK (276–293) 625.3 657.4 25 TTPPVLDSDGSFFLYSK (276–293) 625.3 397.2 25 A (P62736) AGFAGDDAPR (21–30) quant 488.7 343.2 35 AGFAGDDAPR (21–30) qual 488.7 458.2 30 AVFPSIVGR (40–49) quant 473.3 628.4 30 AVFPSIVGR (40–49) qual 473.3 531.3 30 ETTALAPSTMK (281–291) quant 581.3 634.3 30 ETTALAPSTMK (281–291) qual 581.3 379.2 35 FABP4 (P15090) LVSSENFDDYMK (11–32) quant 724.3 1235.5 30 LVSSENFDDYMK (11–32) qual 724.3 213.2 35 EVGVGFATR (32–41) quant 468.3 551.3 30 EVGVGFATR (32–41) qual 468.3 707.4 30 NTEISFILGQEFDEVTADDR (59–79) quant 767.0 577.3 30 NTEISFILGQEFDEVTADDR (59–79) qual 767.0 805.4 30 HA (P68082) GLSDGEWQQVLNVWGK (2–17) quant 908.5 390.4 40 GLSDGEWQQVLNVWGK (2–17) qual 908.5 716.6 40 VEADIAGHGQEVLIR (21 33) quant 804.0 1009.0 40 VEADIAGHGQEVLIR (21–33) qual 804.0 815.0 40 HGTVVLTALGGILK (65–78) quant 690.0 886.0 40 HGTVVLTALGGILK (65–78) qual 690.0 985.0 40
sterile vial without preservatives. Each tissue fragment (weighing less than 1 mg) was digested, following the same procedure used for the rehydrated CMT, by immersing it in 400μl of the tissue digestion so-lution and incubating at 90 °C overnight in a screw-capped vial. Following the overnight incubation, the resultant tissue broth was processed as noted in Section 2.3 for CMT to yield a total protein concentration solution of 1μg/μl.
2.5. Tryptic digestion and peptide extraction
A 10μl aliquot of the 1 μg/μl total protein solution obtained following 2.3 or 2.4, as described above, was spiked with a 2μl aliquot of HA so-lution (3.45 nmol/ml in water) as an internal standard and processed ac-cording to the manufacturer’s instructions for the Tryptic Digestion Kit. In brief, reduction was conducted in a buffer composed by 50 mM ammo-nium bicarbonate and 100 mM DTT at 95 °C for 5 min. Alkylation was conducted by adding 3μl of 100 mM iodoacetamide solution at room temperature for 20 min in the dark. Finally, trypsin digestion was per-formed with a serine protease (from porcine pancreatic extracts) in buf-fered solution (100 ng/µl) added in a trypsin:protein 1:20 w/w ratio at 37 °C for at least 2 h, or overnight for higher reaction yields.
Peptides were extracted by C18 SPE tips according to the manu-facturer’s instructions. The final elution volume was 20 μl of a solution composed by 0.1% v/v FOA in ACN.
2.6. Liquid chromatography
The purified peptide solution was diluted 1:4 v/v with mobile phase A (0.1% v/v FOA in water) before injection. The injection volume was 20μl. A simple binary concentration gradient on a Biobasic C18 column was suitable for peptide detection. Phase B (0.1% v/v FOA in ACN) was held at 0% for 0.5 min, and then increased to 95% over 3 min, held at 95% for 0.5 min, decreased to 0% over 0.01 min and then held at 0% for 0.49 min. Total run time was 4.0 min. Theflow rate was held constant at 0.5 ml/min.
2.7. Tandem mass spectrometry
ESI ion source parameters strongly depend on chromatographicflow and were held constant during the run. They were: curtain gas = 20 psi, ion spray voltage = 5500 V, temperature = 550 °C, GS1 = 30 psi, GS2 = 50 psi. MS/MS transitions for all peptides of interest were
Table 2
Proteotypic peptide identifying parameters. For each protein (column 1) peptides (column 2) with parent ion and daughter ion apparent masses (columns 3 and 4, respectively) quant and qual transition coincident retention times are reported in column 5. Quant over qual transition relative intensity (XIC area ratios) are reported in column 6. Overall relative intensities of each transition belonging to the same protein are reported in column 7.
protein transition id Q1 (m/z) Q3 (m/z) retention time (min) peak area ratio relative response TTR (P02766) GSPAINVAVHVFR (22–34) quant 697.8 606.3 1.90 1.3 12.0 GSPAINVAVHVFR (22–34) qual 697.8 921.4 7.0 AADDTWEPFASGK (36–48) quant 683.9 941.5 1.88 6.9 6.9 AADDTWEPFASGK (36–48) qual 683.9 827.5 1.0 ALGISPFHEHAEVVFTANDSGPR (81–103) quant 613.6 416.0 1.86 3.0 6.0 ALGISPFHEHAEVVFTANDSGPR (81–103) qual 613.6 645.3 2.1 k-LC (P01834) TVAAPSVFIFPPSDEQLK (1–18) quant 973.5 913.5 2.05 1.2 8.5 TVAAPSVFIFPPSDEQLK (1–18) qual 973.5 272.2 7.0 SGTASVVCLLNNFYPR (19–34) quant 899.4 272.2 2.15 1.1 1.8 SGTASVVCLLNNFYPR (19–34) qual 899.4 810.4 1.5 DSTYSLSSTLTLSK (62–78) quant 751.9 836.5 1.88 2.0 2.0 DSTYSLSSTLTLSK (62–78) qual 751.9 448.3 1.0 λ-LC (P0CG04) ATLVCLISDFYPGAVTVAWK (24–43) quant 872.4 687.3 1.97 1.1 8.0 ATLVCLISDFYPGAVTVAWK (24–43) qual 872.4 788.4 7.5 YAASSYLSLTPEQWK (66–80) quant 737.7 464.7 2.27 1.5 1.5 YAASSYLSLTPEQWK (66–80) qual 737.7 928.5 1.0 AAPSVTLFPPSSEELQANK (107–125) quant 993.5 787.4 1.90 4.0 8.0 AAPSVTLFPPSSEELQANK (107–125) qual 993.5 640.4 2.0 HCs (P01857) GPSVFPLAPSSK (5–17) quant 593.8 699.4 1.90 1.1 4.5 GPSVFPLAPSSK (5–17) qual 593.8 846.5 4.0 DTLMISR (132–138) quant 418.3 619.4 1.78 3 3.0 DTLMISR (132–138) qual 418.3 506.3 1.0 TTPPVLDSDGSFFLYSK (276–293) quant 625.3 657.4 2.04 1.1 2.9 TTPPVLDSDGSFFLYSK (276–293) qual 625.3 397.2 2.8 A (P62736) AGFAGDDAPR (21–30) quant 488.7 343.2 1.65 1.5 6.5 AGFAGDDAPR (21–30) qual 488.7 458.2 4.0 AVFPSIVGR (40–49) quant 473.3 628.4 1.92 1.8 7.1 AVFPSIVGR (40–49) qual 473.3 531.3 4.5 ETTALAPSTMK (281–291) quant 581.3 634.3 1.80 1.5 1.5 ETTALAPSTMK (281–291) qual 581.3 379.2 1.0 FABP4 (P15090) LVSSENFDDYMK (11–32) quant 724.3 1235.5 1.85 1.2 2.0 LVSSENFDDYMK (11–32) qual 724.3 213.2 1.5 EVGVGFATR (32–41) quant 468.3 551.3 1.75 2 12.0 EVGVGFATR (32–41) qual 468.3 707.4 8.0 NTEISFILGQEFDEVTADDR (59–79) quant 767.0 577.3 2.15 1.2 1.2 NTEISFILGQEFDEVTADDR (59–79) qual 767.0 805.4 1.0 HA (P68082) GLSDGEWQQVLNVWGK (2–17) quant 908.5 390.4 2.12 2.5 7.0 GLSDGEWQQVLNVWGK (2–17) qual 908.5 716.6 2.8 VEADIAGHGQEVLIR (21 33) quant 804.0 1009.0 1.80 1.1 1.1 VEADIAGHGQEVLIR (21–33) qual 804.0 815.0 1.0 HGTVVLTALGGILK (65–78) quant 690.0 886.0 2.05 1.1 3.5 HGTVVLTALGGILK (65–78) qual 690.0 985.0 3.0
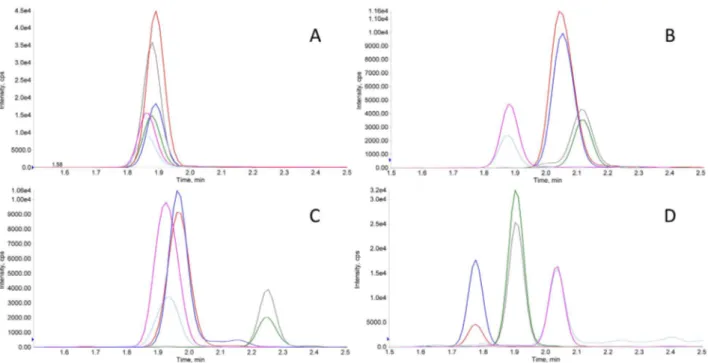
Fig. 1. Typical XICs recorded in MRM mode of pure proteins. XICs obtained in the analysis of a solution of pure commercial human TTR (1 nmole/ml in carbonate buffer) showing intense signals for TTR proteotypic peptides (in A) and of a solution of pure commercial human polyclonal IgGs (1 nmole/ml in carbonate buffer) showing peptide signals for k, λ-LC and HCs (in B, C and D, respectively).
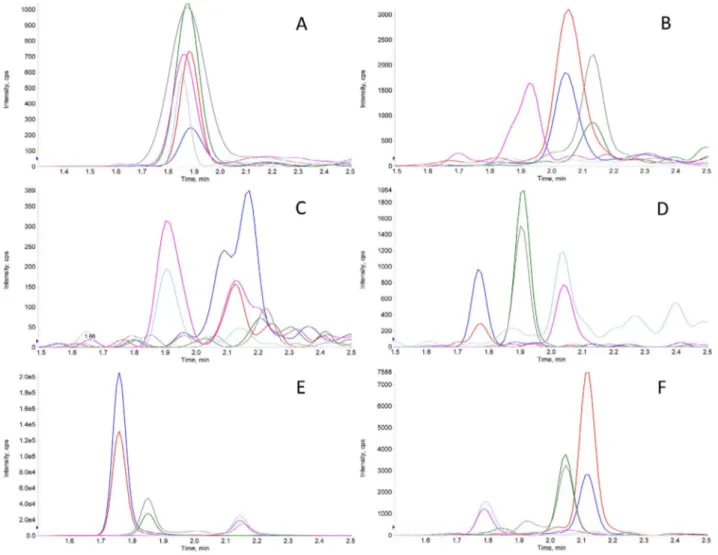
Fig. 2. Typical XICs of non-amyloid CMT. XICs obtained in the analysis of a typical non-amyloid CMT. TTR, k-LCs,λ-LC and HCs signals in A, B, C, and D, respectively, were very low (confront cfr. absolute y-axis scale count values). Peaks in 2E clearly attested the presence of the A in the sample. The exogenous non-human protein (HA) spiked in the digested tissue was accordingly detected in 2F.
retrieved from the SRMAtlas database (www.srmatlas.org).[24], except for the horse HA protein, MRM transitions were retrieved on another database atwww.ionsource.com. Transition-specific parameters for the API 5500 were optimized experimentally by syringe infusion of purified peptides obtained by tryptic digestion of pure proteins. The declus-tering potential and collision energies, in particular, were optimized over successive LC-MS/MS runs in order to take into account possible effects of the change in mobile phase composition during the chroma-tographic gradient that could not be accurately modeled by syringe infusion.
3. Results
A fundamental initial step in this work was optimizing multiple reaction monitoring (MRM) transition-specific parameters for proteo-typic peptides. For each targeted protein, at least three different pro-teotypic peptides needed be monitored to meet requirements for use in clinical applications [20]. For each peptide, various transitions are available on internet databases. We found usable transitions to be in the 5–1250 m/z range, due to the limits of the mass axis for the API 5500 instrument in MRM mode. After experimental verification with default transition-specific parameters typically employed with our system (i.e., DP = 110, EP = 10, CE = 35, CXP = 15), two transitions were selected for each peptide, among those available: a quantifier (characterized by the most intense response in our mass spectrometer), and a qualifier
(with a less intense response). Transition-specific parameters were op-timized in two phases:first, by syringe infusion of tryptic digests of pure protein mixtures (at a concentration of 1 nM each); and second, by injection of the same tryptic digests in successive chromatographic runs while varying parameters of the ESI ion source (e.g., GS1, GS2, Ion source temperature, Ion Voltage), and then of the mass spectrometer (e.g., DP and CE, in particular) in successive chromatographic runs. The results of the tuning on our API 5500 are reported inTable 1.
Coincident retention times for the quantifier and the qualifier transitions and their ion extraction chromatogram (XIC) peak area ra-tios were used as identifying features for proteotypic peptides mon-itored in MRM mode. Mean values of these parameters, obtained by the analysis of 10 independent pure protein mixtures containing 1 nmol/ml of each protein, are reported inTable 2.
Typical XICs obtained in the analysis of pure commercial human TTR (1 nmole/ml in water) are reported inFig. 1A. XICs obtained in the analysis of pure commercial human IgG (1 nmole/ml in water) are re-ported inFig. 1B–D, and show simultaneous detection of k, λ-LC and HCs peptide signatures, as expected.
Typical XIC traces obtained in the analysis of non-amyloid CMT and SAT samples are reported inFigs. 2 and 3, respectively, as examples. Essentially negative signals (very low absolute y-axis scale counts) for TTR, k-LCs,λ-LC and HCs, as those inFig. 2A–D, respectively, were associated with a negligible (at least to the aims of the present study) presence of these proteins in the sample. Peaks, as those in Fig. 2E,
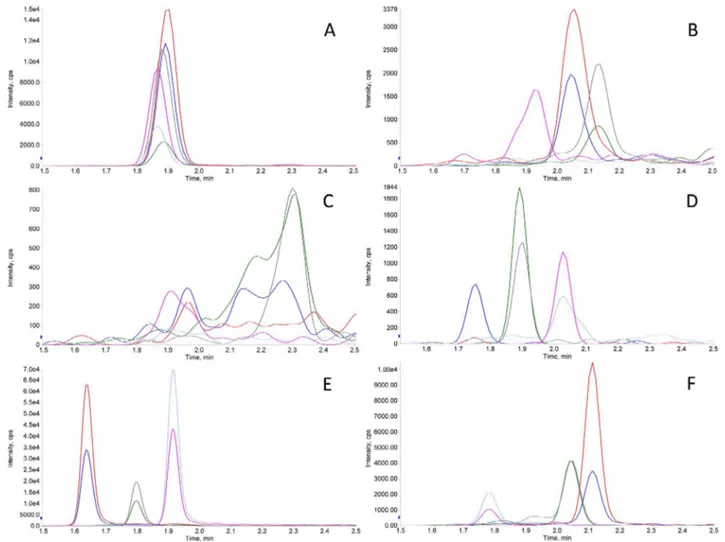
Fig. 3. Typical XICs of non-amyloid SAT. XICs obtained in the analysis of a non-amyloid SAT. TTR, k-LCs,λ-LC and HCs signal intensities in 3A, B, C, and D, respectively, were negligible (very low absolute y-axis scale counts). Peaks in 3E clearly confirmed the presence of the FBP4 in the sample. The exogenous non-human protein (HA) spiked in the digested tissue was accordingly detected in 3F.
confirming the presence of A in CMT samples, were taken as an in-dication of the overall efficiency of the analytical steps. Similarly, sig-nals for TTR, k-LCs,λ-LC and HCs, as those inFig. 3A–D, respectively, were considered negative, whereas relatively intense peaks inFig. 3E, with expected relative area ratio of their transitions, were associated with the presence of the FBP4 peptides in SATs. Peptides belonging to the non-human protein HA, spiked in each digested tissue, as indicated in section2.5, were detected with an almost constant intensity in every sample, as in Figs.2F or3F. Even higher signals for TTR, k andλ-LC could be detected in about 20% of non-amyloid CMT and SAT samples (data not shown), most probably due to the presence of blood serum; a hypothesis supported by the detection of HC in these samples.
The matrix effect on peptide MS/MS signals was evaluated by comparing qualifier transition XIC mean peak areas obtained in the analysis of: (i) 1 nmol each mixture of pure proteins after tryptic di-gestion; (ii) 1 nmol each mixture of pure proteins spiked into denatu-rated protein mixture obtained (method 2.3) from CMT before per-forming method 2.5; (iii) 1 nmol each mixture of pure proteins spiked into denaturated proteins mixture (see method 2.4) from SAT before performing method 2.5. Analyses were performed in triplicate and mean results are reported inTable 3.
The limit of detection (LOD) for each peptide was evaluated by successive dilutions of pure peptide mixtures, spiked before performing tryptic digestion and peptide extraction of non-amyloid CMTs or SATs, until the recorded signal-to-noise ratio for the qualifier transition of
each peptide was > 3. Results of these experiments are reported in Table 4. Sub-picomole sensitivity, in matrix, was achieved for all tar-geted peptides.
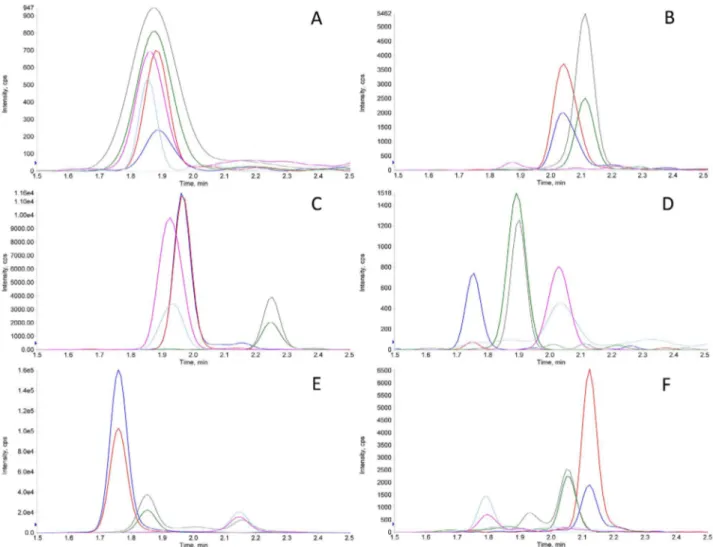
Typical XICs obtained in the analysis of an amyloid (i.e., ATTR) CMT sample are reported inFig. 4. Marked signals for TTR inFig. 4A could be linked to its pathological presence in the bioptic specimen. Low level k- andλ-LCs and HCs signals, as inFig. 4B–D, respectively, may indicate blood serum inclusions in this CMT. The presence of A and HA signals, similar to those inFig. 2E and F, were a confirmation of the efficiency of the analytical process.
Typical XICs obtained in the analysis of one SAT sample in a case of AL amyloidosis are shown inFig. 5.κ-LC signal peaks inFig. 5C were ascribed to the presence of pathological inclusion of λ-LCs in this bioptic sample. Very low signals for TTR, k-LCs and HCs, as in Fig. 5A–D, respectively, may indicate blood serum inclusions in this SAT. FBP4 and HA peaks, as those inFig. 3E and F, respectively, were used to confirm the efficiency of the analytical process.
To more effectively evaluate whether detection of amyloid proteins is a function of the presence of amyloid fibrils and/or blood serum inclusions in tissues, we calculated the relative abundance of amyloid versus tissue-specific proteins (i.e., A for CMT or FBP4 for SAT) based on their normalized relative area ratios in a number of pathological vs. non-pathological samples. However, since our method is qualitative, it was necessary to evaluate relative protein abundances based on nor-malized peak areas in our XICs. And, since the mass spectrometer re-sponds with different sensitivity to different peptides, peak areas were normalized among peptides belonging to the same protein using re-sponse ratios measured in standard mixtures (seeTable 2, column 5) in order to express a unique ratio value. Ratio values were further nor-malized to the relative internal standard (i.e., HA) peak area among samples to correct for variations in the efficiency of analytical steps. Average ratios of amyloid to tissue-specific proteins, as calculated, are shown for CMT and SAT, inTables 5 and 6, respectively.
4. Discussion
Here, we present a targeted proteomics approach for typing cases of amyloidosis that are the most frequently encountered in our clinical practice. To achieve this we first identified proteotypic peptide sig-natures for targeted proteins. The historical approach to determine signature MRM transitions has been to identify them with an HR-MS/ MS instrument and then tentatively extrapolate to lower resolution triple quadrupole instruments. Currently, however, thanks to open source bioinformatics tools that are readily available on the internet, transitions for a large number of proteotypic peptides are easily
Table 3
Estimation of the matrix effect on XICs. Mean peak area (N = 3) of qual transitions obtained in the analysis of: a) 1 nmol each mixture of pure proteins in carbonate buffer after tryptic digestion; b) 1 nmol each mixture of pure proteins spiked into denaturated protein mixture obtained (method 2.3) from CMT before performing method 2.5; c) 1 nmol each mixture of pure proteins spiked into denaturated proteins mixture (see method 2.4) from SAT before performing method 2.5, d) percent response (b area / a area) in the CMT matrix, e) percent response (c area / a area) in the SAT matrix.
transition id a (peak area) b (peak area) c (%) c (peak area) d (%) GSPAINVAVHVFR (22–34) qual 85,350 110,955 130 81,709 96 AADDTWEPFASGK (36–48) qual 69,152 56,511 82 79,411 115 ALGISPFHEHAEVVFTANDSGPR (81–103) qual 40,255 35,244 88 37,988 95 TVAAPSVFIFPPSDEQLK (1–18) qual 39,700 39,224 99 37,377 94 SGTASVVCLLNNFYPR (19–34) qual 21,520 46,525 216 46,912 218 DSTYSLSSTLTLSK (62–78) qual 14,965 9763 65 13,222 88 ATLVCLISDFYPGAVTVAWK (24–43) qual 30,450 20,423 68 17,051 58 YAASSYLSLTPEQWK (66–80) qual 9980 4033 40 4230 42 AAPSVTLFPPSSEELQANK (107–125) qual 17,215 7828 45 10,119 59 GPSVFPLAPSSK (5–17) qual 101,244 75,225 75 69,256 69 DTLMISR (132–138) qual 20,956 14,057 69 12,977 65 TTPPVLDSDGSFFLYSK (276–293) qual 59,967 43,123 72 42,899 73 GLSDGEWQQVLNVWGK (2–17) qual 9998 9494 95 9145 91 VEADIAGHGQEVLIR (21–33) qual 4858 5201 105 5004 103 HGTVVLTALGGILK (65–78) qual 12,021 13,051 110 12,784 102 Table 4
Analytical sensitivity. For each protein (column 1) and proteotypic peptides (column 2) analytical limits of detection (LODs) observed in the CMT and in the SAT matrices are reported in column 3 and 4, respectively. They were obtained by analysis of successive dilution of pure protein solutions spiked into denaturated proteins mixture from CMT or SAT (according to method 2.3 or 2.4) before tryptic digestion (method 2.5) until recorded signal to noise (S/N)≥ 3.
protein proteotypic peptide LOD (pmoli) LOD (pmoli) TTR GSPAINVAVHVFR (22–34) 0.10 0.10 AADDTWEPFASGK (36–48) 0.20 0.20 ALGISPFHEHAEVVFTANDSGPR (81–103) 1.00 0.20 k-LC TVAAPSVFIFPPSDEQLK (1–18) 0.05 0.10 SGTASVVCLLNNFYPR (19–34) 0.10 0.10 DSTYSLSSTLTLSK (62–78) 0.10 0.10 λ-LC ATLVCLISDFYPGAVTVAWK (24–43) 0.05 0.10 YAASSYLSLTPEQWK (66–80) 0.20 0.10 AAPSVTLFPPSSEELQANK (107–125) 0.20 0.50
accessible. In the present study, we used the SRMAtlas database (www. srmatlas.org), from which we were able to retrieve MRM transitions for all of our targeted human proteins, as determined using the same type of mass spectrometer as we employ in this study; whereas, for the horse HA protein, MRM transitions were retrieved on a different website (www.ionsource.com). This information contributed greatly towards accelerating our progress during the early stages of this project. Three signature peptides, a number considered to be minimal confidence measure for clinical proteomic applications[20], were used to confirm identification of each of the targeted proteins. However, when em-ploying only three peptides, most of the primary sequence of the tar-geted proteins is not covered, hence, intrinsic limitations of the method for the purpose of qualitative protein identification must be considered. For instance, the possibility of detecting truncated protein forms, which could constitute certain amyloidfibrils[10], is clearly impaired. Like-wise, the possibility of identifying point mutations in targeted peptides can only be indirect, with homozygous and heterozygote mutations leading to either complete ablation or a 50% reduction in the corre-sponding peptide’s signal, respectively. In our experiments, we were able to observe the absence of the GSPAINVAVHVFR peptide signals in two cases of TTR-m amyloidosis, in which a methionine-30 transthyr-etin variant was known from previous genetic analysis (data not shown). Additional coverage of the primary sequence would greatly improve specificity of a targeted approach, such as that described here, but will require the availability of additional peptide MRM transitions (for mutated peptides as well).
Proteotypic peptide identification parameters in targeted mode in-cluded: (i) the presence of peaks with a signal-to-noise > 3 in the XICs of both the quantifier and the qualifier transition, (ii) coincidence of their retention time, and (iii) a characteristic peak area ratio. We adopted a tolerance of 2% for retention time and 10% for the quantifier over qualifier area. These identification criteria were used as we pro-ceeded to optimize the chromatographic conditions.
Chromatographic conditions were a compromise between analytical speed and sensitivity, since fast chromatography is usually the option of choice in clinical chemistry applications. Ion suppression due to peptide and/or matrix component co-elution did not compromise sensitivity or specificity in our method. Various run times and gradient elution rates (in the 0.1–1 B%/sec range) were tested. Longer runs did not con-siderably improve sensitivity to targeted peptides. This was possibly due to the strong ionizing conditions employed in the ESI source (i.e., 5500 V and 550 °C) that enabled maximum ion yields even in condi-tions of potential co-elution. The effect of different acids in the mobile phases was tested in order to further amplify ion yields. FOA at 0.1% v/ v in both phases provided improved signal intensity compared to TCA 0.1% or a 50–50% v/v mixture of the two. Additionally, higher acid concentrations resulted in lower signals, most likely due to an increase in multi-charged ions of the same peptides.
Various total LC flows were tested in the 0.1–1 ml range. This parameter substantially altered MRM signal intensity and peak width. A totalflow of 0.5 ml/min provided an optimal peak area/width ratio and signal intensities for all MRM signals for the LC column employed.
Fig. 4. Typical XICs of amyloid CMT. XICs obtained in the analysis of an amyloid (ATTR amyloidosis) CMT sample. Marked signals for TTR were detected, as shown in 4A. Low level k-, λ-LCs and HCs signals in 4B, C and D, respectively, were probably due to blood serum inclusions in this CMT sample. Peaks in 4E attesting the presence of the A in the sample confirmed the efficiency of the overall analytical process. The exogenous non human protein (HA) spiked in the digested tissue was accordingly detected in 4F.
Other chromatographic columns were tested and resulted in differing elution series and peak shapes, but a sensitivity gain was not observed. ACN as the B phase was selected because it provided lower back pres-sure in the LC system when compared to MeOH, without substantial variations in signal intensity or elution order with the same gradient. Optimization of these experimental conditions enabled us to reach ac-ceptable sensitivities for all targeted proteins for both CMT and SAT (Table 3).
To investigate potential ion suppression in the ESI source due to a matrix effect, we also performed a post-column infusion experiment in which a tryptic digest of pure proteins (1 nmole each) was infused post-column by means of the API 5500 integrated syringe pump at a constant
flow of 10 μl/min, while a tryptic digest of CMT and SAT was injected on-column. Signal intensity in the XICs was within ± 20% during the 5 min run, essentially confirming the level of signal suppression/am-plification seen in the experiment for all peptides (Table 3). Based on these results, we concluded that ion suppression in the ESI source was limited and did not dramatically impair detection sensitivity.
In order to monitor the efficiency of the pre-analytical steps for the proposed method, a non-human protein (HA) was used as an internal standard. This choice was clearly a compromise since isotopically la-beled pure proteins, or at least lala-beled peptides, would have been a better option. However, our experimental data indicated that this was an acceptable substitute. Furthermore, even if we could follow the ideal
Fig. 5. Typical XICs of amyloid SAT. XICs obtained in the analysis of an amyloid (AL amyloidosis) SAT sample.λ-LC peaks in 5C could be attributed to the presence of this type of amyloid protein in the sample. Low signals for TTR, k-LCs and HCs in 5A, B and D, respectively, (confront cfr. very low absolute y-axis scale counts) were probably due to blood serum inclusions in this SAT sample. Peaks in 5E attesting the presence of the FBP4 in the sample, confirmed the efficiency of the overall analytical process. The exogenous non human protein (HA) spiked in the digested tissue was accordingly detected in 5F.
Table 5
Amyloid over CMT-specific protein normalized peak area ratios. Relative abundance of indicated amyloid proteins over A (in column 1) have been calculated by means of peak area ratios (normalized by peptide relative response and internal standard (HA) sample relative intensity) obtained in the analysis of non-amyloid (column 2) and amyloid CMTs (column 3). The number of examined cases, reported in brackets, was a function of sample availability.
Protein ratio / tissue type non-amyloid CMT amyloid CMT avg ± std. (N) avg ± std. (N) TTR/A 0.02 ± 0.002 (50) 5.07 ± 0.45 (51) k-LC/A 0.26 ± 0.02 (50) 8.57 ± 0.55 (22) λ-LC/A 0.05 ± 0.003 (50) 1.10 ± 0.51 (18)
Table 6
Amyloid over SAT-specific protein normalized peak area ratios. Relative abundance of indicated amyloid proteins over FABP4 (in column 1) have been calculated by means of peak area ratios (normalized by peptide relative response and internal standard (HA) sample relative intensity) obtained in the analysis of non-amyloid (column 2) and amy-loid SATs (column 3). The number of examined cases (in brackets) was a function of sample availability.
Protein ratio / tissue type non-amyloid SAT amyloid SAT avg ± std. (N) avg ± std. (N) TTR/FABP4 0.32 ± 0.24 (20) 1.27 ± 0.51 (12) k-LC/FABP4 0.76 ± 0.26 (20) 2.47 ± 0.66 (15) λ -LC/FABP4 0.34 ± 0.25 (20) 4.51 ± 0,45 (14)
path of using isotopically labeled proteins it would still not achieve precise quantitative tissue analysis. In actuality, to monitor overall tissue processing accurately would require isotopically labeled amyloid fibrils embedded in tissues, which is not an available option. However, by monitoring the presence of common tissue specific proteins (i.e., A for CMT and FBP4 for SAT) we were able to gain insight into tissue digestion efficiency. Indeed, tissue processing conditions were opti-mized by monitoring the A or FBP4 signals on different fragments of the same non-amyloid bioptic specimens by varying sensible parameters such as rehydrating conditions, digestion buffer composition, digestion temperature and duration. Parameters presented in Section 2.3 are those that resulted in optimal yields in term of A and FBP4 signals.
In practice, it was necessary to evaluate method sensitivity as the ability to efficiently process our smallest bioptic samples, which were single histological sections2μm thick (and about 2–3 mm in diameter), fixed and stained on histological glass slides. Acceptable tissue protein concentration (above 10 ug/ml) was always obtained, even after pro-cessing our smallest samples.
Tryptic digestion and peptide extraction conditions reported in Section2.5were those suggested in the producers’ manual. We did not attempt variations of the suggested parameters. We only tested the ef-fect of different dilution procedures on extracted peptides. The 1:4 v/v dilution with mobile phase improved peak shape, intensity, and re-tention time stability compared with undiluted, smaller volume injec-tions.
To confirm the specificity of our proposed method in the evaluation of amyloidosis, without the aid of LMD to pick-out amyloidfibrils from histology sections, it was necessary to acknowledge the fact that k-, λ-LCs and TTR are also circulating in the blood of patients without amyloidosis and could, thus, be present in non-amyloid tissues as a result of blood serum inclusions. To address this possible interference, we also measured HC peptide signatures that we found to be reliable monitors of the presence of serum contamination in tissues.
However, the determination of serum contamination, in addition to the presence of k-LCs,λ-LCs or TTR does not, in itself, negate a diag-nosis of amyloidosis, it only creates doubt as to the source of the pro-posed amyloid markers. Are they from a pathological process (i.e., amyloidosis) or are they from the serum of an otherwise healthy in-dividual? Hence, with afinding of HC, in combination with the amyloid markers, it is necessary to take further measures to confirm the pre-sence, or abpre-sence, of amyloidosis. Our solution was to measure the abundance of the amyloid marker proteins relative to tissue-specific proteins. As mentioned in the Results section, it is expected that in-creased presence of amyloid fibrils within tissues would disrupt the surrounding tissue and result in an decrease in the levels of normal tissue proteins. Since our method is qualitative, we used a normalized peak area ratio in this evaluation. By analyzing 132 samples from AL, ATTR and mixed-type amyloidosis patients we observed that area ratio values (for each of the three protein ratios showed in Table 5) in amyloid tissues were significantly higher than corresponding values in non-amyloid ones (p < 0.05, unpaired T-test). This was true both in CMTs and in SATs (Tables 5 and 6, respectively).
Although the average ratios were significantly different between amyloid and non-amyloid tissues, there were few instances where we found low ratio values in amyloid cases that were confirmed by other means. These discrepancies were ascribed to the fact that since amy-loidosis deposits are not evenly distributed in tissues, the bioptic sam-pling can sometimes probe an unaffected zone by chance. As a con-firmation of our hypothesis, we analyzed independent SAT samples from the same amyloidosis patients with the mass spectrometry method proposed here and observed positive results in most cases, but also a few negatives among them.
5. Conclusions
Here, we present a targeted proteomics approach for specifically
and sensitively detecting targeted amyloid proteins in bioptic speci-mens (both CMT and SAT) taken from AL, ATTR or mixed type amy-loidosis affected patients. We believe that this approach could be a useful analytical tool for smaller to mid-size clinical laboratories that are not equipped with LMD and high resolution mass spectrometry for amyloid typing, as are larger proteomics reference centers.
Conflicts of Interest: none to be declared
This work was partially supported by the grant from the Italian Ministry of Health—GR-2011-02352282 (C.C.Q.).
Author contributorship
Wrote the manuscript: M.C. Conception of the method: M.C. Development and validation of the method: M.C. and I.P. Performed the experiments: M.C. and I.P. Performed analysis of the data: all the au-thors. Revised and approved thefinal version of the manuscript: all the authors.
References
[1] M.D. Benson, Pathogenesis of transthyretin amyloidosis, Amyloid Int. J. Exp. Clin. Investig. Off. J. Int. Soc. Amyloidosis 19 (Suppl 1) (2012) 14–15,http://dx.doi.org/ 10.3109/13506129.2012.668501.
[2] F. Brambilla, F. Lavatelli, V. Valentini, D. Di Silvestre, L. Obici, P. Mauri, G. Merlini, Changes in tissue proteome associated with ATTR amyloidosis: insights into pa-thogenesis, Amyloid Int. J. Exp. Clin. Investig. Off. J. Int. Soc. Amyloidosis 19 (Suppl 1) (2012) 11–13,http://dx.doi.org/10.3109/13506129.2012.674989. [3] V.-K. Ton, M. Mukherjee, D.P. Judge, Transthyretin cardiac amyloidosis:
patho-genesis, treatments, and emerging role in heart failure with preserved ejection fraction, Clin. Med. Insights Cardiol. 8 (2014) 39–44,http://dx.doi.org/10.4137/ CMC.S15719.
[4] G.T. Westermark, M. Fandrich, P. Westermark, AA amyloidosis: pathogenesis and targeted therapy, Annu. Rev. Pathol. 10 (2015) 321–344,http://dx.doi.org/10. 1146/annurev-pathol-020712-163913.
[5] Y. Sekijima, Transthyretin (ATTR) amyloidosis: clinical spectrum, molecular pa-thogenesis and disease-modifying treatments, J. Neurol. Neurosurg. Psychiatry 86 (2015) 1036–1043,http://dx.doi.org/10.1136/jnnp-2014-308724.
[6] H. Naiki, T. Okoshi, D. Ozawa, I. Yamaguchi, K. Hasegawa, Molecular pathogenesis of human amyloidosis: lessons from beta2 -microglobulin-related amyloidosis, Pathol. Int. 66 (2016) 193–201,http://dx.doi.org/10.1111/pin.12394. [7] E. Ihse, C. Rapezzi, G. Merlini, M.D. Benson, Y. Ando, O.B. Suhr, S.-I. Ikeda,
F. Lavatelli, L. Obici, C.C. Quarta, O. Leone, H. Jono, M. Ueda, M. Lorenzini, J. Liepnieks, T. Ohshima, M. Tasaki, T. Yamashita, P. Westermark, Amyloidfibrils containing fragmented ATTR may be the standardfibril composition in ATTR amyloidosis, Amyloid Int. J. Exp. Clin. Investig. Off. J. Int. Soc. Amyloidosis 20 (2013) 142–150,http://dx.doi.org/10.3109/13506129.2013.797890.
[8] Y. Misumi, Y. Ando, Classification of amyloidosis, Brain Nerve 66 (2014) 731–737. [9] J.D. Sipe, M.D. Benson, J.N. Buxbaum, S.-I. Ikeda, G. Merlini, M.J.M. Saraiva,
P. Westermark, Amyloidfibril proteins and amyloidosis: chemical identification and clinical classification International Society of Amyloidosis 2016 Nomenclature Guidelines, Amyloid Int. J. Exp. Clin. Investig. Off. J. Int. Soc. Amyloidosis 23 (2016) 209–213,http://dx.doi.org/10.1080/13506129.2016.1257986. [10] A. Dogan, Amyloidosis: insights from proteomics, Annu. Rev. Pathol. 12 (2017)
277–304,http://dx.doi.org/10.1146/annurev-pathol-052016-100200. [11] C. Rapezzi, C.C. Quarta, L. Riva, S. Longhi, I. Gallelli, M. Lorenzini, P. Ciliberti,
E. Biagini, F. Salvi, A. Branzi, Transthyretin-related amyloidoses and the heart: a clinical overview, Nat. Rev. Cardiol. 7 (2010) 398–408,http://dx.doi.org/10.1038/ nrcardio.2010.67.
[12] O. Leone, S. Longhi, C.C. Quarta, T. Ragazzini, L.B. De Giorgi, F. Pasquale, L. Potena, L. Lovato, A. Milandri, G. Arpesella, C. Rapezzi, New pathological in-sights into cardiac amyloidosis: implications for non-invasive diagnosis, Amyloid Int. J. Exp. Clin. Investig. Off. J. Int. Soc. Amyloidosis 19 (2012) 99–105,http://dx. doi.org/10.3109/13506129.2012.684810.
[13] M. Hinton, V.M. Lucke, Histologicalfindings in amyloidosis of rabbits, J. Comp. Pathol. 92 (1982) 285–294.
[14] S. Fujihara, Differentiation of amyloid fibril proteins in tissue sections. Two simple and reliable histological methods applied tofifty-one cases of systemic amyloidosis, Acta Pathol. Jpn. 32 (1982) 771–782.
[15] Y. Levo, N. Livni, A. Laufer, Diagnosis and classification of amyloidosis by an im-muno-histological method, Pathol. Res. Pract. 175 (1982) 373–379.
[16] P. Mollee, S. Boros, D. Loo, J.E. Ruelcke, V.A. Lakis, K.-A. Le Cao, P. Renaut, M.M. Hill, Implementation and evaluation of amyloidosis subtyping by laser-cap-ture microdissection and tandem mass spectrometry, Clin. Proteomics 13 (2016) 30,
http://dx.doi.org/10.1186/s12014-016-9133-x.
[17] D. Loo, P.N. Mollee, P. Renaut, M.M. Hill, Proteomics in molecular diagnosis: typing of amyloidosis, J. Biomed. Biotechnol. 2011 (2011) 754109,http://dx.doi.org/10. 1155/2011/754109.
[18] Y. Sun, M. Li, Y. Wen, X. Li, J. Sun, W. Sun, Laser microdissection and mass spec-trometry based proteomics in the diagnosis of kidney diseases, Sheng Wu Gong Cheng Xue Bao. 30 (2014) 1134–1140.
[19] C. Mesaros, I.A. Blair, Mass spectrometry-based approaches to targeted quantitative proteomics in cardiovascular disease, Clin. Proteomics. 13 (2016) 20,http://dx.doi. org/10.1186/s12014-016-9121-1.
[20] B. Domon, S. Gallien, Recent advances in targeted proteomics for clinical applica-tions, Proteomics Clin. Appl. 9 (2015) 423–431,http://dx.doi.org/10.1002/prca. 201400136.
[21] F. Lavatelli, D.H. Perlman, B. Spencer, T. Prokaeva, M.E. McComb, R. Theberge, L.H. Connors, V. Bellotti, D.C. Seldin, G. Merlini, M. Skinner, C.E. Costello, Amyloidogenic and associated proteins in systemic amyloidosis proteome of adi-pose tissue, Mol. Cell. Proteomics 7 (2008) 1570–1583,http://dx.doi.org/10.1074/ mcp.M700545-MCP200.
[22] J.A. Vrana, J.D. Theis, S. Dasari, O.M. Mereuta, A. Dispenzieri, S.R. Zeldenrust, M.A. Gertz, P.J. Kurtin, K.L. Grogg, A. Dogan, Clinical diagnosis and typing of systemic amyloidosis in subcutaneous fat aspirates by mass spectrometry-based proteomics, Haematologica 99 (2014) 1239–1247,http://dx.doi.org/10.3324/
haematol.2013.102764.
[23] C. Rapezzi, C.C. Quarta, L. Obici, F. Perfetto, S. Longhi, F. Salvi, E. Biagini, M. Lorenzini, F. Grigioni, O. Leone, F. Cappelli, G. Palladini, P. Rimessi, A. Ferlini, G. Arpesella, A.D. Pinna, G. Merlini, S. Perlini, Disease profile and differential di-agnosis of hereditary transthyretin-related amyloidosis with exclusively cardiac phenotype: an Italian perspective, Eur. Heart J. 34 (2013) 520–528,http://dx.doi. org/10.1093/eurheartj/ehs123.
[24] U. Kusebauch, D.S. Campbell, E.W. Deutsch, C.S. Chu, D.A. Spicer, M.-Y. Brusniak, J. Slagel, Z. Sun, J. Stevens, B. Grimes, D. Shteynberg, M.R. Hoopmann, P. Blattmann, A.V. Ratushny, O. Rinner, P. Picotti, C. Carapito, C.-Y. Huang, M. Kapousouz, H. Lam, T. Tran, E. Demir, J.D. Aitchison, C. Sander, L. Hood, R. Aebersold, R.L. Moritz, Human SRMAtlas: a resource of targeted assays to quantify the complete human proteome, Cell 166 (2017) 766–778,http://dx.doi. org/10.1016/j.cell.2016.06.041.