1004
THE ROLE OF PUBLIC AUTHORITIES IN SUPPORTING REGIONAL
INNOVATION ECOSYSTEMS: THE CASES OF SAN DIEGO AND
BOSTON REGIONS (USA)
C. Bevilacqua, A. Spisto and F. CappellanoPAU Department – University “Mediterranea” of Reggio Calabria, Italy Email: [email protected]
Abstract: The EU has recently recognised the crucial role of public authorities in promoting the interfaces between innovation actors in order to orchestrate regional innovation ecosystems (EU CoR, 2016). This paper aims to contribute to the body of knowledge of regional innovation policy-making by analysing the role that has been performed by the U.S. public sector in boosting two successful innovation ecosystems, namely the Life Science Clusters of San Diego (CA) and Boston (MA). By adopting a policy monitoring methodology, the paper breaks-down the different policy inputs and processes delivered by the public sector, targeting the two Life Science clusters. We conclude that both the public authorities of Boston and San Diego regions have been pushing for the life science industry agglomeration from an urban planning perspective, while they have been adopting different approaches in promoting the interface between innovation actors. In Boston, the public authorities actively intervene in fostering collaboration and co-creation between the several life science-related firms, through the Mass Life Science Center. In San Diego, the public authorities allow the life science ecosystem to self-organize, leaving the orchestration role to not-for-profit organizations, such as CONNECT and BIOCOM.
Keywords: Clusters, Innovation Policy, MAPS-LED, Policy Mix, Regional Innovation Ecosystems.
1. INTRODUCTION
There seems to be a wide consensus among the scientific community that knowledge, education, lifelong learning, creativity, and innovation are the key components for the prosperity and global competitiveness of cities and regions. The post-Fordist societies are more and more characterized by knowledge-based economies and, for this reason, innovation ranks on the top of policy agendas within the regional policy-making field (Todtling & Trippl, 2005). As Judy Estrin reminds us, “innovation is not optional” (Estrin, 2009, p. 1).
Since Harvard Business School professor Michael Porter introduced the connection between clusters and innovation to the policy community (1990), almost ten years have passed for the spread of public strategies in supporting regional economic clusters across every U.S. state. Furthermore, it took ten more years until the U.S. Congress adopted the “regional innovation clusters” (RICs) as the framework for structuring the nation’s economic development policies (Muro & Katz, 2010).
Also for the European Union, innovation represents the key element when it comes to formulating guidelines and legislation for regional policies. For the programming period 2014 – 2020, the EU Commission pointed out the Smart Specialisation Strategy (S3) as the regional policy aiming at placing greater emphasis on innovation-driven regional development, based on each EU region’s strengths and competitive advantages (EU Commission, 2011). The development of regional clusters represents an expected - and desirable - stage within the S3 implementation, since it is recognised the crucial role of clusters’ knowledge spillovers in
1005
boosting innovation (Baptista & Swann, 1998). The importance given to innovation and clusters development is demonstrated by two main aspects: 1) the development of the S3 plan (called RIS3 – Research and Innovation Strategies for Smart Specialisation) is the ex-ante conditionality for the EU regions in order to access the European Structural and Investment Funds (ESIF) for regional development; 2) in the RIS3 Guide, EU regions are invited to “[…] develop world class clusters and provide arenas for related variety/cross sector links internally in the region and externally, which drive specialised technological diversification” (Foray, et al., 2012, p. 17).
Besides pushing regional specialisations and agglomerations through the S3, the EU also emphasizes the importance of governance-related aspects in order to promote regional innovation and fully exploit local endowments and competitive advantages. The research carried out by several Scandinavian scholars and the Espoo Innovation Garden project (FI) have been determinant steps in developing an eco-systemic approach to regional innovation and raising the importance of well-functioning collaborative and networking platforms for the production and promotion of innovation for regional prosperity (see Rajahonka, et al., 2015; Lappalainen & Markkula, 2013; Oksanen & Hautamaki, 2014; Markkula, Kune, 2015a-b). In 2016 the EU Committee of Regions (EU CoR) – chaired by Markkula - released a guide encouraging decision-makers to foster collaboration among regional innovation actors: “Europe needs more partnering with collaborative power, creative thinking, eco- systems thinking, synthesis, and a stronger focus on outcomes and impact […] In the face of a fast-changing world, innovation and an experimental mind-set are required more than ever. If Europe is to continue to provide quality of life for our citizens, the capacity to work together and learn from – and with – each other is essential” (EU CoR - Committee of the Regions, 2016, pp. 9, 21).
This paper contributes to the body of knowledge in the policy-making field by showing whether and how the public authorities support the interconnections between innovation players within two world-class U.S. life science clusters, located in the regions of Boston (MA) and San Diego (CA). There are two reasons we focus our study just on one cluster constituting the innovation ecosystem of the two regions: opportunity and feasibility. In terms of opportunity, 1) the economic performance of the life science cluster in both the regions is so high - 1st and 3rd in
the world (JLL, 2015) - that allows to highlight the successful top-down public choices to promote innovation actors’ synergy; 2) it allows to investigate the planning aspects connected to the support of innovation ecosystems. In terms of feasibility, for their very nature - based on geographic concentration, competition, cooperation and interconnection of several actors (Porter, 2000) - clusters can be considered as a proxy of regional innovation ecosystems. Through comparing the aforementioned life science clusters we will answer the following research question: which kind of policies have been set up by the U.S. public authorities in in order to orchestrate the interface between the innovation actors within the life science clusters of Boston and San Diego’ regions?
To answer this question, the paper develops through the following stages: in the section 2, we identify the main characteristics of innovation ecosystems and then connect the concept with the cluster one. Section 3 sets up the methodology and limitations in order to break-down the different public choices made by the public authorities in supporting the innovation ecosystem of the two life science clusters. In particular, we employ a policy monitoring methodology called “social auditing” (see Dunn, 2012). In the section 4, we discuss more in depth the public policy choices to support both the life science ecosystems, highlighting the main outputs of such choices. In the section 5, we conclude that both the public authorities of Boston and San
1006
Diego regions have been pushing for the life science industry agglomeration from an urban planning perspective, while they have been adopting different approaches in promoting the interface between innovation actors. In particular, in Boston, the public authorities actively intervene in boosting collaboration and co-creation between the several life science-related firms, through the Mass Life Science Center. In San Diego, public authorities allow the life science ecosystem to self-organize, leaving the orchestration role to not-for-profit organizations, such as CONNECT and BIOCOM.
2. INNOVATION ECOSYSTEMS IN THE LITERATURE
The concept of innovation ecosystem has increasingly gained a lot of popularity in the academic and policy-making debate. In his Google N-gram chart, Hwang showed the dramatic increase of the use of this phrase from the end of the ‘80s to 2008 within all the vast amount of books that Google has scanned to make them available on its famous search engine (see Hwang, 2014). However, the most recent works of literature review on the concept (see Durst & Poutanen, 2013; Oh et al., 2016) show that there is not a widely recognized definition for this concept, since it can be related to different fields (business, industrial, institutional) and geographical scales (from the business to the national level). According to Durst & Poutanen’s work (2013), the majority of the academic articles focused on innovation ecosystems provides different ideas and interpretations from one another. Oh et al. (2016) argue that within their literature search, first, the concept of “innovation ecosystem” does not distinguish from the “innovation system” one and, second, the eco addition appears mostly in trade publications. The first idea that comes to mind is the analogy with the biological ecosystem. Starting from this analogy and comparing the two types of ecosystems, Jackson (2011) highlights the structural factors constituting them and provides a definition for the innovation one: “[…] the complex relationship that are formed between actors or entities whose functional goal is to enable technology development and innovation” (Jackson, 2011, p. 2). In terms of actors, Jackson refers to material resources (funds, equipment, facilities, etc.) and human capital (students, faculty, staff, industry researchers, industry representatives), while entities are meant to be made up of these actors and they are the institutions participating to the ecosystem (e.g. the universities, colleges of engineering, business schools, business firms, venture capitalists, industry-university research institutes, federal or industrial supported centres of excellence, and state and/or local economic development and business assistance organizations, funding agencies, policy makers, etc.). Similarly, Mercan & Goktas (2011), describe the innovation ecosystem as a complex environment made up by different actors and relations: “innovation ecosystem consists of economic agents and economic relations as well as the non-economic parts such as technology, institutions, sociological interactions and the culture” (Mercan & Goktas, 2011, p. 102). Estrin (2009) also starts from the biological analogy and identifies a hierarchy among the members of the innovation ecosystem. She recognizes in the research, development, and applications communities those with the role of sparking innovation. According to Estrin, the “cross-pollination” of ideas, questions, knowledge and technology between the three communities is similar to the interaction occurring among all the species within a tidal pool, which creates a unique ecosystem. The “nutrients” supporting each of these communities are funding, policy-making, education and culture (Estrin, 2009). The idea of specific communities pursuing innovation – so-called innovation communities – is also put forward by Wang (2009, p.7): “an innovation community is a set of organizations and people with interests in producing and/or using a specific innovation”. The networks among these
1007
communities and their interaction to produce and use innovation represents an innovation ecosystem.
Adner (2006) describes innovation ecosystems mostly as a thriving business environment: “the collaborative arrangements through which firms combine their individual offerings into a coherent, customer-facing solution” (Adner, 2006, p. 2). The benefits for the firms part of the ecosystem are in terms of productivity and value creation, and they are labelled as platform leadership, keystone strategies, open innovation, value networks, and hyperlinked organizations (Adner, 2006). Adner’s idea is similar to the older concept of business ecosystem developed by Moore (1993), who considers the ecosystem composed by individuals and organizations producing value and services for consumers, the latter also part of the ecosystem. In 1999 Moore expanded the concept of business ecosystem including also financing providers, trade associations, standard bodies, labour unions, governmental and quasigovernmental institutions, and other interested parties. The reason is that each one of these actors fills out the need of one another in complementary way (Moore, 1999). Another description, still belonging to the business and management field, is given by Autio & Thomas (2014), who highlight the 1) interconnectedness characterizing the factors and actors constituting the ecosystem and 2) vertical and horizontal relationship between the actors. Based on the study of Adner & Kapoor (2010), Iansiti & Levien (2004) and Teece (2009), Nambisan & Baron (2013) highlight three main factors of innovation ecosystems: interdependencies among the members, shared set of knowledge and skills, and a common set of aims (Nambisan & Baron, 2013).
Moving to the regional policy-making context, the concept of regional innovation ecosystem perfectly reflects - at different scale - the descriptions shown above. Also in this case innovation ecosystems are used to describe all the collaborating actors having different roles and responsibilities in the production and promotion of innovation (Lappalainen & Markkula, 2013). The partners of regional innovation ecosystems are those constituting the so-called Quadruple Helix – universities, business, governments, NGOs and citizens. The Quadruple Helix model is based on the cross-sectorial co-opetition, co-evolution and co-specialisation between all the aforementioned actors within the regional innovation ecosystem (Carayannis & Campbell, 2009). They all experience multiple gains from an open, participative and collaborative innovation process: “[…] business can develop the scalable product and service solutions that users want, the public sector can provide effective and affordable solutions to regional challenges, citizens share ownership of the specific, often highly personalized solutions they need, and universities can actively contribute knowledge and reap new knowledge and insights in return” (Markkula & Kune, 2015a, p. 17).
In conclusion, even agreeing with the argument about the lack of a specific definition and the different fields and geographical scales the concept can applied to, we think that the aforementioned descriptions of innovation ecosystem provide a straightforward idea of the characteristics of such an environment: cross-sectorial, collaborative and – above all - explicitly systemic, the latter also highlighted by Oh et al. (2016). Furthermore, innovation ecosystems distinguish from the Porter’s clusters since the latter is a physical agglomeration with a defined spatial dimension, which can be national and regional. Instead, innovation ecosystems, as collaborative relationships among several actors, may have also a world-wide geographical scale (global innovation ecosystem). However, adding the regional attribute, innovation ecosystems acquire a spatial dimension too, which allows to argue that a cluster - at regional level - may be part of a regional innovation ecosystem, while a single cluster can be considered as specific innovation ecosystem per se. This argument is also supported by the EU
1008
Commission’s idea of cluster: “Clusters are potential elements of a regional innovation eco-system […]” (EU Commission, 2013, p. 16).
Even being collaborative, regional innovation ecosystems needs to be orchestrated in order to contribute the addressing of societal challenges while guaranteeing regional competitiveness. The guide for EU cities and regions released in 2016 by the EU Committee of Regions (EU CoR) highlights the crucial role of public authorities in promoting the interfaces between innovation actors in order to orchestrate regional innovation ecosystems: “[…] innovation ecosystems are self-organising systems but evolve through an interaction between top-down policy choices and bottom-up creative forces […] The role of public policies is to facilitate the ongoing process of the discovery of new opportunities. Be it through the provision of resources, such as education or infrastructures, or through the articulation of demand, such as public procurement. But more strategic: by promoting the interfaces between innovation actors” (EU CoR, 2016, p. 11). In the next section, the paper highlights the top-down policy choices made by the public sector in order to orchestrate the life science sector of the Boston and San Diego regions.
3. CASE STUDY & METHODOLOGY
The two examined regions were selected upon their remarkable performances which allow to the successful top-down public choices to promote innovation actors’ synergy. Furthermore, the two clusters have been considered as a proxy of regional innovation ecosystems for their very nature as explained in the previous section. The two study cases have been analyzed through a clear methodology, suitable to observe the two approaches adopted by public authorities in the Boston and San Diego regions. According to an inductive approach we explore the public choices in compliance with a policy monitoring procedure. To do so, we consider both inputs and processes set by local public authorities in the two study cases in compliance with the “social auditing” methodology (Dunn, 2012) indicated in the framework below (Table 1). The qualitative and quantitative data used within the methodology are secondary.
Table 1: Social auditing methodology (Dunn, 2012)
POLICY ACTIONS POLICY OUTCOMES
POLICY INPUTS POLICY OUTPUTS
Resources used to produce impacts and outputs: time, money, personnel, equipment, supply
Goods, services and resources received by target groups and beneficiaries
POLICY PROCESSES POLICY IMPACTS
Administrative, organizational and political activities and attitudes that shape the transformation of policy inputs into impacts and outputs
Actual changes in behaviour that result from policy outputs
The analysis will be discussed in two following steps: 1) firstly urban planning choices implemented in the two regions will be examined since they were determinant for the physical cluster formation; 2) afterwards, we will shed light on the orchestration of the innovation ecosystem development and the relative choices made by the public sector. The focus of the analysis is confined under two criteria: the spatial boundaries will imply only the geographical areas where the sector employment is highly concentrated whereas the industry sectors investigated are referred to the broad umbrella of “Life Science”. The composition of this
1009
cluster implies several industry sectors (NAICS – North America Industry Classification System) including: Drugs and pharmaceuticals; Medical Devices equipment; Research testing and laboratories; Bioscience-related Distribution. Notwithstanding there are some discrepancies concerning the definitions of the Life Science cluster across the two regions observed. In San Diego, for instance, some NAICS mostly related to “M-Health or Wireless Health” and “Agricultural Feedstock and animals” are included in the cluster composition. Under these premises, we confined the spectrum of policy choices to those directly targeting the “Life Science” cluster. In this respect, any cross-cutting policy effort has been considered a possible confounding variable and accordingly excluded from the present analysis. Moreover, the limited data availability referring to these particular areas forbids us to lead any conclusion concerning the causality between the planning practices and their economic outputs. considering some planning practices (namely Life Science Corridor in Massachusetts and the University City Community plan) entered into force in 2013 and 2015 respectively. We report the main findings of the analysis conducted in Table 2.
Table 2: Social auditing methodology applied to San Diego and Boston regions’ Life Science Clusters (Authors’ elaboration based on Dunn, 2012)
POLICY ACTIONS POLICY OUTCOMES
SAN DIEGO REGION
INPUTS PROCESSES OUTPUTS IMPACTS
Zoning Scientific Research
Zone
8% land use in University City is
zoned to host life science labs.
Employment 64490,00 Emp. Growth rate
-3,10% Establishments growth rate 3,00% % VC to total U.S. 6,88% % NIH to total U.S. 7,35% Infrastructure
provision Guaranteed Water for Industry Program
Uninterruptible supply of water for manufacturing and
R&D firms Public
Transportation Transit Service Metropolitan (MTS) routes that serve the main Life
Science R&D and employment
centres BOSTON
GREATER AREA
Zoning Life Science
Corridor life science firms in Agglomeration of the surrounding of
the mass transit Red Line - over 27.7 million square
feet of Research & Development /Lab (Existing, planned or under construction). Employment 86235,0 Emp. growth rate
1,30% Establishments growth rate 4,30% % VC to total U.S. 38,01% Massachusetts Life Science
1010
Funding &
collaboration Programs Centre Total budget of 1billion $ % NIH to total U.S. 18,72% 4. DISCUSSION
As the Table 1 demonstrates, the two regions we review in this study are the top-ranking in the country for the life science clusters. This paragraph sheds light on the policies set forward by public authorities as well as on the policy processes that involve various stakeholders.
4.1 The case of San Diego
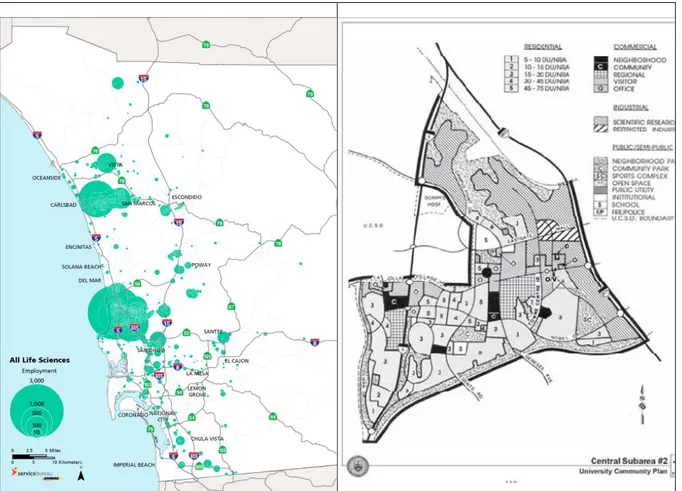
In San Diego, a specific urban policy devoted to spurring research facilities concentration dates back to 1900s when the first research institutions were placed. In 1907 hundreds of public land acres were ceased to build new research facilities in Torrey Pines mesa (San Diego Regional EDC, 2015). Over time, the University of California – San Diego (UCSD) and several other research institutions located in neighbouring areas began a fruitful collaboration with the City of San Diego, which has been leading to the tailored urban planning interventions (see Economic Development strategies 2002, 2008, and 2014 by the City of San Diego) discussed below. In compliance with the methodology adopted, the urban planning tools are considered as policy inputs - which include zoning, infrastructure provision and job training programs. These direct interventions have been coupled with other types of infrastructures which indirectly create competitive advantages for the cluster, such as the port of San Diego and the borders which ensure great communications and important gateways for the whole economic activities in the San Diego area. The aforementioned policy inputs can be considered as a result of a long lasting and complex policy process which involved both public and not public stakeholders. We are primarily concerned with the region around University City and the neighbouring areas, including La Jolla and Torrey Pines Mesa. We focus on this region given its prominence in the sector employment as demonstrated in Figure 1.
1011
Figure 1a: Life Science Employment Map (San Diego Workforce Partnership, 2014); Figure 1b: University City Land Use (The City of San Diego, 2015a)
The University Community Plan was advocated by the UCSD. The City developed it upon the idea - nurtured by the public officials - to create a life science cluster, since they forecasted a strong development in the area (Kim, 2015). Hence, long-lasting ties with research anchor institutions and extensive public outreach have been inherent features of San Diego’s planning process - in compliance with the so called “Community planning” approach. The City rewarded considerable attention to the need of employees as well as companies naming a specific land use, as the Scientific Research which includes: research laboratories, supporting facilities, headquarters or administrative offices and personnel accommodations, and related manufacturing activities (The City of San Diego, 2015b). However, the urban planning processes were not only focused to the provision of specific zoning. At the request of the local biotechnology industry’s representatives (called BIOCOM), the City implemented a tailored program (the “Guaranteed Water for Industry Program”) to offset the drought which represents a serious threat to manufacturing and R&D firms, since they are highly dependent on water for industrial processing and cooling needs. Furthermore, the City of San Diego has been committed in providing a public transportation service to the most significant employment and R&D centres (namely, the areas neighbouring UCSD campus). For transportation planning, the City of San Diego relies on the local Metropolitan Planning Organization (called SANDAG) which is responsible for planning and programming financial resources for a multi-modal transportation system.
In sum, the city of San Diego adopted similar approach as several other cities (e.g. New York City, Novato City and Boston) by right sizing the zoning, streamlining permits, strengthening the infrastructure provision. In this respect, the “Development Intensity” element within the
1012
University City’s Community Plan allows higher density in order to reinforce the existing patterns, accounting a percentage around 8% of land devoted to Life Science/Research. The land devoted to the “SR Zone” accounts for 1,047 gross acres and will allow 14,359,530 s.f. (The City of San Diego, 2015a) of facilities in order to accommodate additional 9,665 jobs, forecasted by 2018 (The City of San Diego, 2014). In respect of public transportation, the City intervened by placing additional 14 Metropolitan Transit Service (MTS) routes in order to serve the University community. Moreover, through SANDAG, the City has planned, funded and started to implement the Mid-Coast trolley project which runs through the University City region. This project will extend the existent LRT (the Blue Line trolley) which will serve the UCSD campus and the surrounding areas. As shown, the City set the ground for the geographical concentration of the life science industry, research organizations and venture capital (Powell et al., 2002, in Majava, Rinkinen, & Harmaakorpi, 2015), which represent the basis for “a robust entrepreneurial activity and the formation of entrepreneurial habitats” (Kim, 2015, p. 3). Along this paragraph, we explore how the public choices supported the innovation ecosystem. Drafting on the relationships nurtured by the City, it is remarkable the role exerted by not-for profit organizations BIOCOM and CONNECT who has been building strong ties with public officials. Their relevance is twofold: on one side, they has been advocating innovation process by lobbing government at all levels and establishing collaborations with SANDAG and San Diego EDC (Walcott, 2002); on the other side, since their foundation, they have been serving as collaboration platform for both entrepreneurs and academics within the life science sector in order to boost entrepreneurship and technology transfer (Kim, 2015). Hence, the case of San Diego witnesses how innovation ecosystem relies on flows of knowledge - as demonstrated by Kim (2015) - which are critical to “power collaboration and co-creation” (Gobble, 2015). At this regard, the talented managers attracted in San Diego were critical to create fruitful human networks which are considered the main reason for the cluster success (Walcott, 2002). Moreover, they developed a wide-spread entrepreneurial culture in the area (Walcott, 2002; Kim, 2015; Casper, 2014) which is crucial to support attempts toward commercializing the research outcomes carried out in the local clinic or R&D facilities. In fact, the UCSD and the outstanding independent research institutions (Scripps Research Institute, Sanford Brunham Prebys and Salk Institute for Biological Studies) have been at the forefront in the research. They are all ranked among the 10 most performing research institutes upon the NIH funding (San Diego Regional EDC, 2015). Additionally, the sum of patents (704 in 2014) resulting from this public funding sources (ib.) witnesses the efficiency of the public expenditures invested in those centers. This first-tier scientific environment is fed by a talented workforce available in the area given the presence of important universities in San Diego (namely UCSD, SDSU, USD). Moreover, job/training programs, (e.g. Life Science Summer Institute) provided by the City of San Diego through the San Diego Workforce Partnership, spread the know-how over next generations of students and teachers who reach San Diego every year from all over the U.S in order to appreciate a real-life work experience in the life science industry (The City of San Diego, 2014). Additionally, several other factors make part of the ecosystem and work significantly to its degree of innovation, including: considerable supply of venture capitalists which afford risk financing, a three-tier real estate market providing space for companies from incubation to start-up and through established market-seasoned success (Walcott, 2002) accelerators, incubators and angel investors by sharing their knowledge support the rise of new economic activities, health providers who partner in clinical trials, further business services leverage their expertise in financial, legal, human resources fields (Majava, et al., 2016).
1013
Notwithstanding, harnessing innovation ecosystem is not limited only to local actors. In fact, even regulatory agencies and municipal or regional governments that create a dynamic, innovation-driven economy can be involved in the orchestration process. In this respect, federal legislation (namely the federal Bayh–Dole Act or Patent and Trademark Law Amendments Act) deeded the property rights for federally-funded technology to not for profit universities (Walcott, 2002). By allowing that, a number of companies settled down close to anchor R&D institutions to turn research outcomes into patents as demonstrated by the data aforementioned. Additionally, actors at state level prompted a crucial contribution to the multi-scalar-featured policy process: 1) the State of California supports the University of California (UCSD) allocates the 20% of resources reported in their annual budget of the UC system; 2) the University of California played a significant role in the 1980s when it laid the basis for a biotech base through university technology transfers in San Diego (Walcott, 2002; Markoff, 1997). Such multi-faceted ecosystem is unique for its government since the leaders of BIOCOM and CONNECT are the ones who play a prominent role in the orchestration of the innovative ecosystem (Majava, et al., 2016). In fact, the City of San Diego forecasted the development of the life science sector and so implemented an urban policy to set the ground for the cluster development earmarking resources (water, zoning, and infrastructure provision) and attention to the cluster needs. As claimed by a public official, the City consciously limited its efforts in providing the aforementioned inputs (Kim, 2015) leaving the orchestration role to private and not-for-profit sector. In fact, “since 1980s when the major actors see a gap in the ecosystem, they tend to fix it without top-down guidance” (Majava, et al., 2016, p. 10).
In conclusion, a multi-scalar featured and complex policy process as a whole achieved to orchestrate a well-performing regional innovation ecosystem. A combination of federal legislation and educational state-funded policies contributed to leverage the human capital toward innovation.
4.2 The case of Boston
The case of Boston, defined as “supercluster”, represents the best performing life science cluster in the world by attracting firms, companies, venture capital and private banks (Business Wire, 2015). By a planning perspective, local authorities have accommodated the life science ecosystem development through specific urban planning tools – such as zoning to increase life science-related spaces, streamlined process to permit buildings and sites for biotech-uses in their municipal plans, life science-related planned area development. At this regard, the MassBio - a not-for-profit organization representing the actors working in the life science field and providing services and support for the ecosystem - has developed an index - called BioReady - considering the zoning practices and the degree of infrastructure provisioned as suitable to host life science companies or facilities (see https://www.massbio.org/why-massachusetts/supercluster/bioready-communities). The results claim that five cities are top-rated and that they are linked by the mass-transit infrastructure - namely the Red-Line opetop-rated by the MBTA. These cities (Somerville, Cambridge, Boston, Quincy, Braintree) joined in 2013 to promote the “Life Science Corridor”. Hence, more companies are attracted by the abundance of R&D facilities (e.g. 27.7 million square feet of Research & Development /Lab) around the Corridor. Moreover, the choice to adopt a Transit Oriented Development scheme (developed around mass transit line) generates stark economic advantages in terms of greater workforce/employers access, lower transportation costs which self-reinforces the business attraction. Such tailored urban planning policy led to a physical agglomeration of life science
1014
sector companies which is forecasted to increase over time given the presence of top-ranked universities in the world (e.g. Harvard, MIT, Tufts, Boston University, etc.).
The Mass Life Science Centre represents not only a massive fiscal stimulus which granted a 1$ billion in aid to boost the Life Science sector in the Boston area (Bluestone & Clayton-Matthews, 2013). Additionally, it depicts the strong ties among the different actors within the regional innovation ecosystem. In fact, the structure itself of the Mass Life Science Centre does include representatives from academia and from private sectors. For instance, its board is composed by government officials, industry CEOs and leaders from academia (ib.). In a certain extent, we can state that the “Triple Helix” takes place in this tailored structured. Additionally, the public funds’ allocation is assessed by a panel which gathers up to 200 specialists including: “academic researchers, industry scientists and private venture capital experts” (ib., p. 6). Their evaluation takes into account the scientific extent and the economic return of investment. Such articulated structure does not affect the time process of public funds’ allocation but it enhances the efficiency of the public expenditure. In fact, the massive state-funded MLSC is proven to be very effective since till 2013 has been reported to generate $ 1,66 gain per each state dollar spent (ib.). The initiative has been in charge of the state of Massachusetts since 2008, lasting for ten years. The Centre works trough implementing seven programs which earmark resources throughout the whole R&D pipeline including: the research institutions, the start-ups, SMEs, bigger companies, business incubators and not-for-profit organizations. The main rationale of the MLSC is centred in supporting small and medium enterprises as well as start-ups. According to Bluestone and Clayton-Matthews (2013), “[…] In the life science and other innovative sectors [...] the large companies that depend on the development of breakthrough innovations and sophisticated medical devices prosper by being near a concentration of small start-firms”(ib., p. 8). The authors explain this defined business location pattern since the large companies can take stock of “the scientific discoveries under way in university research laboratories and in the transnational research carried out by small start-ups” (ib., p. 40) and eventually invest in the most promising outcomes. Such detailed and robust policy process implemented in Boston succeeded to achieve outstanding outputs. In fact, 36250 people are employed in 450 Life Science companies with over 150 million square feet of lab space available considering only the specific region of the Life Science Corridor.
5. CONCLUSIONS
With the shift to a knowledge-based economy, to be innovative and creative is not advice for just young people anymore. Rather, it represents the new policy imperative that cities and regions should follow in order to prosper and be competitive in a globalized world. The nurturing of regional innovation ecosystems is widely claimed to be the most effective way to pursue the production and use of innovation for regions’ growth. As well as in the biological ecosystem all the living species interact with one another and with the environment they live in, as in innovation ecosystems all the actors constituting cities and regions – universities, businesses, public institutions, civic society and NGOs – have to collaborate in order to contribute the ecosystem’s success.
By analysing the role that public authorities perform in supporting two successful U.S. innovation ecosystems- the life science clusters of Boston (MA) and San Diego (CA) regions – this paper contributes the knowledge in the policy-making field by clearly breaking down all the strategies adopted for regions’ prosperity, thus identifying the different approaches in promoting the interfaces between ecosystem’s innovation actors. In particular, two main
1015
findings can be highlighted within this research: first, either in Boston and San Diego regions, public authorities promote the clustering of life-science related actors through specific zoning tools and infrastructures provision. Beside the water supply and the public transportation development, San Diego’s public authorities set up the Community Plan of University City neighbourhood in order to devote the 8% of the land use to host life science-related laboratories (Scientific Research Zone). In the Boston region, local authorities have accommodated the life science ecosystem development through specific urban planning tools – such as zoning to increase life science-related spaces, streamlined process to permit buildings and sites for biotech-uses in their municipal plans, and life science-related planned area development. The increase of life science-related land uses is boosted also by MassBIO’s rating for municipalities, whose aim is to help companies to locate in the best-rated municipalities – based on their zoning rules easing the location of life science-related firms.
The second finding concerns the role of the public authorities in supporting the synergies among the life science-related actors. The public founded Mass Life Science Center works as a platform providing incentives and collaborative programs targeted to the life science ecosystem. It creates new models for collaboration and partnership with both public and private actors from local to the global level, in order to boost its innovation ecosystem. The public leadership in orchestrating the life science innovation ecosystem have been proving societal benefitting, as demonstrated by the public return on the MLSC investments. In the San Diego region, the interfaces between the life science ecosystem’s innovation actors is supported by two main not-for-profit organizations, namely BIOCOM and CONNECT. The latter work as collaborative platform aimed to boost life science-related entrepreneurship and technology transfer. As explained in the previous section, this bottom-up and self-organizing feature of San Diego’s life science ecosystem is probably due to historical reasons characterizing the entrepreneurial environment and the connections universities-firms.
6. ACKNOWLEDGMENTS
The MAPS-LED project has received funding from the European Union’s Horizon 2020 research and innovation programme under the Marie Skłodowska-Curie grant agreement No 645651.
7. REFERENCES
Adner, R. (2006). Match your innovation strategy to your innovation ecosystem. Harvard Business Review , 84. Adner, R., & Kapoor, R. (2009). Value creation in innovation ecosystems: how the structure of technological
interdependence affects firm performance in new technology generations. Strategic Management Journal ,
31, 306-333.
Autio, E., & Thomas, L. D. (2013). Innovation ecosystems: implications for innovation management? In M. Dodgons, D. M. Gann, & N. Phillips (Eds.), The Oxford handbook of innovation management (p. 752). Oxford: Oxford University Press.
Baptista, R., & Swann, P. (1998). Do firms in clusters innovate more? Research Policy , 27, 525-540.
Bluestone, B., & Clayton-Matthews, A. (2013). Life Science Innovation as a catalyst for Economic Development:
the role of Massachusetts Life Center. Boston, MA: Boston Foundation.
Business Wire. (2015). New Wells Fargo Life Sciences Unit in Boston Eyes Supercluster. Retrieved April 2017, from businesswire.com: http://www.businesswire.com/news/home/20150127005281/en/Wells-Fargo-Life-Sciences-Unit-Boston-Eyes
Carayannis, E. G., & Campbell, D. F. (2009). 'Mode 3' and 'Quadruple Helix': Toward a 21st century fractal innovation ecosystem. International Journal of Technology Management , 46 (3/4).
1016
Casper, S. (2014). The University of California and the evolution of the biotechnology industry in San Diego and San Francisco Area. In M. Kenney, & D. Mowery, Public Universities and Regional Growth: Insights from
the University of California (pp. 66-96). Stanford, CA, USA: Stanford University Press.
Dunn, W. N. (2012). Public policy analysis: an introduction (5th edition ed.). New York , NY - USA: Routledge. Durst, S., & Poutanen, P. (2013). Success factors of innovation ecosystems - Initial insights from a literature review. In R. Smeds, & O. Irrmann, Co-create 2013 - The Boundary-Crossing Conference on Co-Design in
Innovation: Conference proceedings (Vol. 15). Helsinki: Aalto University publication series Science and
Technology.
Estrin, J. (2009). Closing the innovation gap: reigniting the spark of creativity in a global economy. New York: McGraw-Hill.
EU Commission. (2011). Regional Policy for Smart Growth in Europe 2020. Brussels: European Commission. EU Commission. (2013). The role of clusters in smart specialisation strategies. DG Research and Innovation.
Brussels: EU Commission.
EU CoR - Committee of the Regions. (2016). Regional Innovation Ecosystems - Learning from the EU's cities
and regions. European Union.
Foray, D., Goddard, J., Goenaga, X. B., Landabaso, M., McCann, P., Morgan, K., et al. (2012). Guide to Research
and Innovation Strategies for Smart Specialisations (RIS3). EU Commission.
Gobble, M. M. (2015). Charting the Innovation Ecosystem. Research Technology Management , 57:4, 55-59. Hwang, V. W. (2014). The Next Big Business Buzzword: Ecosystem? Retrieved April 2017, from forbes.com:
https://www.forbes.com/sites/victorhwang/2014/04/16/the-next-big-business-buzzword-ecosystem/#220316d75456
Iansiti, M., & Levien, R. (2004). The keystone advantage. Boston, MA: HBS Press.
Jackson, B. D. (2011). What is an innovation ecosystem? Arlington, VA: National Science Foundation. JLL. (2015). Life Sciences Outlook. San Diego, CA: JLL.
Kim, S.-T. (2015). Regional Advantage of Cluster Development: A Case Study of the San Diego Biotechnology Cluster. European Planning Studies , 23:2, 238-261.
Lappalainen, P., & Markkula, M. (2013). The Knowledge Triangle - Re-inventing the Future. European Society for Engineering Education SEFI - Aalto University - Universitat Politèc ica de València.
Majava, J., Rinkinen, S., & Harmaakorpi, V. (2016). Development of San Diego Life Sciences Ecosystem. Finnish
policy research seminar: Growth ecosystems as an innovation policy tool. The Ministry of Economic Affairs
and Employment, the Finnish Funding Agency for Innovation TEKES and the Finnish Innovation Fund SITRA.
Makela, J., & Savolainen, O. (2016). Forward. In P. Lappalainen, M. Markkula, & H. Kune (Eds.), Orchestrating
Regional Innovation Ecosystem - Espoo Innovation Garden (p. 10). Helsinki: Aalto University in cooperation
with Laurea University of Applied Sciences and Built Environment Innovations RYM Ltd.
Markkula, M., & Kune, H. (2015a). From Research to Reality. In P. Lappalainen, M. Markkula, & H. Kune (Eds.),
Orchestrating Regional Innovation Ecosystems - Espoo Innovation Garden (p. 17). Helsinki: Aalto
University in cooperation with Laurea University of Applied Sciences and Built Environment Innovations RYM Ltd.
Markkula, M., & Kune, H. (2015b). Making Smart Regions Smarter: Smart Specialization and the Role of Universities in Regional Innovation Ecosystems. Technology Innovation Management Review , 5 (10). Markoff, J. (1997, March 24). San Diego—the wireless valley: An information revolution revives its economy.
New York Times , pp. pp. C1, C6.
MassBio. (n.a.). Bioready Communities. Retrieved April 2017, from MassBio - Massachussets Biotechnology Council: https://www.massbio.org/why-massachusetts/supercluster/bioready-communities
Mercan, B., & Goktas, D. (2011). Components of Innovation Ecosystems: A Cross-Country Study. International
Research Journal of Finance and Economics (76), 102-112.
MLSC. (n.a.). Massachussets Life Science Center Funding Programs. Retrieved April 2017, from Massachussets Life Science Center: http://www.masslifesciences.com/programs/
Moore, J. F. (1993). Predators and prey: a new ecology of competition. Harvard Business Review , 71, 75-86. Moore, J. F. (1999). The rise of new corporate form. The Washington Quarterly , 21 (1), 167-181.
Muro, M., & Katz, B. (2010). The new 'cluster moment': how regional innovation clusters can foster the next
economy. Brookings Institution, Metropolitan Policy Program. Washington DC: Brookings Institution.
Nambisan, S., & Baron, R. A. (2013). Entrepreneurship in innovation ecosystems: entrepreneurs' self-regulatory processes and their implications for new venture success. Entrepreneurship theory and practice , 37 (5), 1071-1097.
Oh, D.-S., Phillips, F., Park, S., & Lee, E. (2016). Innovation ecosystems: a critical examination. Technovation . Oksanen, K., & Hautamaki, A. (2014). Transforming regions into innovation ecosystems: A model for renewing
1017
Porter, M. E. (2000). Location, Competition, and Economic Development: Local Clusters in a Global Economy .
Economic Development Quarterly , 14 (1).
Powell, W. W., Koput, K. W., Bowie, J. I. and Smith-Doerr, L. (2002). The Spatial Clustering of Science and Capital: Accounting for Biotech Firm-Venture Capital Relationships. Regional Studies, 36 (3), 291-305. Rajahonka, M., Pienonen, T., Kuusisto, R., & Handelberg, J. (2015). Orchestrators of Innovation-Driven Regional
Development: Experiences from the INNOFOKUS Project and Change2020 Programme. Technology
Innovation Management Review , 5 (10).
San Diego Regional EDC. (2015). The Economic Impact of San Diego’s Research Institutions Driving San
Diego’s Innovation Economy. San Diego, CA.
San Diego Workforce Partnership. (2014). Life Science labor analisys San Diego county. San Diego, CA. Teece, D. J. (2009). Dynamic capabilities and strategic management. Oxford: Oxford University Press. The City of San Diego. (2014). Economic Development Strategy 2014-2016. San Diego, CA.
The City of San Diego. (2015a). Community Plan University City. San Diego, CA.
The City of San Diego. (2015b). Report to the Planning Commission. San Diego, CA, USA: The City of San Diego.
Todtling, F., & Trippl, M. (2005). One size fits all? Towards a differentiated regional innovation policy approach.
Research Policy , 34, 1203-1219.
Walcott, S. M. (2002). Analyzing an Innovative Environment: San Diego as a Bioscience Beachhead. Economic
Development Quarterly , 99-114.
Wang, P. (2009). An Integrative Framework for Understanding the Innovation Ecosystem. Advancing the Study of Innovation and Globalization in Organizations.