RESEARCH
The impact of the metabolic phenotype
on thyroid function in obesity
Paolo Marzullo
1,4*, Chiara Mele
1,4, Stefania Mai
2, Gabriele Guzzaloni
1, Davide Soranna
3,
Maria Antonella Tagliaferri
1, Maria Elisa Berselli
1, Flavia Prodam
4, Daniela Surico
5, Gianluca Aimaretti
4and Massimo Scacchi
1,6Abstract
Background: Obesity is known to promote mild hyperthyrotropinaemia by unknown metabolic mechanisms. This
investigation aimed to explore the association between thyroid function and metabolic phenotype in euthyroid obese individuals. Retrospective, cross-sectional study. Tertiary care center.
Methods: 952 euthyroid obese individuals referred to our Institution for obesity. Serum levels of TSH, FT4, glucose,
insulin and HbA1c levels, lipid profile, liver function and proinflammatory indices were measured. Resting energy expenditure was assessed by indirect calorimetry and body composition by bioimpedance analysis.
Results: On admission, 306 patients had previously diagnosed diabetes mellitus on treatment with metformin, while
113 patients were diagnosed with incident diabetes mellitus. Serum TSH levels were similar between metformin-treated diabetic subjects and metformin-unmetformin-treated subjects, while FT4 was slightly but significantly higher in the former. Analysis stratified by TSH categories found no effect of metformin-treated diabetes mellitus on TSH levels. Interestingly, obese patients with incident diabetes showed lower TSH levels than normoglycaemic ones. In correla-tion studies on the whole dataset, an associacorrela-tion related TSH to BMI and total cholesterol levels, which was lost upon adjustment for individual confounders. FT4 levels were found to be inversely related to BMI, insulin resistance and triglycerides, while being directly associated with HDL-cholesterol levels. These correlations remained unaltered after controlling for individual confounders. In multivariate linear regression analysis, TSH was associated with FT4, total cholesterol and BMI values. Significant predictors of FT4 were constituted by previously diagnosed diabetes mellitus, BMI, TSH and age.
Conclusions: In euthyroid obese subjects, FT4 seems more closely related than TSH levels to parameters of
cardio-metabolic risk. TSH levels did not differ between metformin-treated and untreated subjects, while they were lower in patients with incident diabetes mellitus compared to normoglycaemic ones.
Keywords: Thyroid, Obesity, Diabetes mellitus, Metformin
© 2016 The Author(s). This article is distributed under the terms of the Creative Commons Attribution 4.0 International License (http://creativecommons.org/licenses/by/4.0/), which permits unrestricted use, distribution, and reproduction in any medium, provided you give appropriate credit to the original author(s) and the source, provide a link to the Creative Commons license, and indicate if changes were made. The Creative Commons Public Domain Dedication waiver (http://creativecommons.org/ publicdomain/zero/1.0/) applies to the data made available in this article, unless otherwise stated.
Background
Thyroid disorders impact body weight in multiple ways, and hypothyroidism is traditionally claimed as a con-tributor of weight accrual via altered metabolic efficiency, water retention, decreased lipolysis [1]. Nonethe-less, case-control studies and epidemiological surveys
revealed that TSH levels tend to follow body weight accrual as well as development of obesity and insulin resistance, independent of hypothyroidism [2–9]. The causal mechanism underlying this link remains uni-dentified, yet a compensatory response operated by the hypotalamo-pituitary unit via leptin and directed to counteract weight accrual, is very likely involved [1, 10].
Obesity, type 2 diabetes mellitus (T2DM) and thyroid diseases are the most frequent endocrine disorders and often coexist in the same individual [11]. Following an original case study [12], cross-sectional and prospective
Open Access
*Correspondence: [email protected]
1 Division of General Medicine, I.R.C.C.S. Istituto Auxologico Italiano,
Ospedale S. Giuseppe, Casella Postale 1, 28921 Verbania, Italy Full list of author information is available at the end of the article
studies have shown that the antidiabetic drug metformin can decrease TSH levels in patients with subclinical and/ or overt hypothyroidism, while other antidiabetic agents do not yield such effect [13–17]. In subsequent studies, it has been clarified that metformin can alter TSH levels also in euthyroid subjects if TSH levels lay in the mid-high normal range (i.e., >2.5–3.0 mIU/L) [18–20].
Considering the metabolic derangement commonly associated with obesity as well as the frequent use of metformin in overweight patients owing to its insulin-sensitizing effect and potential reduction of body weight [21], we aimed at assessing the impact of the metabolic phenotype, metformin-treated diabetes mellitus, and incident diabetes mellitus on thyroid function in euthy-roid obese patients, and thus further investigating the potential thyroidal determinants of cardiometabolic risk in this setting.
Methods
This study enrolled 952 obese patients [M/F = 410/542, median age 58 (IQR 52–66) years, median BMI 45 (IQR 41.4–49.4) kg/m2] referred to our institution for work-up
and rehabilitation of obesity and its comorbidities. Sub-jects included in the current study were participants of the TONDO study (T2DM of new diagnosis in obesity), an ongoing study initiated in 2012 and designed to inves-tigate the relationship between glucose abnormalities and indices of organ damage in subjects with uncomplicated and complicated obesity [22], and were included accord-ing to inclusion criteria and availability of complete thy-roid function assessment. Written consent was obtained from all patient, after full explanation of the purpose and nature of the study. The investigation was approved by the local ethical committee, functioning according to the 3rd edition of the Guidelines on the Practice of Ethi-cal Committees in MediEthi-cal Research. The current cohort included: (1) 646 euthyroid obese subjects [group OB-Eu; males/females = 283/363, median age 55 (IQR 48–65) years, BMI 43.7 (IQR 40–48.9) kg/m2], 113 of whom were
diagnosed on admission with T2DM based on fasting glycaemia and/or HbA1c levels; (2) 306 euthyroid obese subjects with T2DM on treatment with metformin for at least 6 months [group OB-EuM; males/females, 127/179; median age 58 (IQR 50–65) years; BMI 45.6 (IQR 41.4– 49.6) kg/m2; median diabetes duration 8.1 years (IQR
6.9–9.4)]. Exclusion criteria were age below 18 or above 90 years; previous or current use of medications poten-tially interfering with thyroid function (such as amiodar-one, steroids or lithium carbonate therapy); previous or current treatment with levo-thyroxine; known autoim-mune diseases (including thyroid) and/or hypothyroid-ism; type 1 diabetes mellitus; pregnancy; liver or kidney disease. In case of TSH value >4.5 mIU/L, a condition
not mandatorily indicative of thyroid dysfunction in obe-sity, patients underwent a preliminary thyroid screening inclusive of re-analysis of TSH and measurement of fT3, fT4 and anti-thyroid antibody titer, to exclude true thy-roid hypofunction. Screening test included glucose and insulin levels, lipid profile, indices of liver function and proinflammatory state, in fasting conditions. Patients were not prescribed diet therapy, dietary supplements, or antiobesity compounds for at least 3 months prior to entering the study.
Body measurements
All subjects underwent body measurements wearing light underwear, in fasting conditions after voiding. Weight and height were measured to the nearest 0.1 kg and 0.1 cm, respectively. BMI was expressed as body mass (kg)/height (m)2. Obesity was defined for any BMI over
30 kg/m2 [23]. Waist circumference was measured
mid-way between the lowest rib and the top of the iliac crest after gentle expiration; hip was measured as the greatest circumference around the nates. Anthropometric data were expressed as the mean of two measurements.
Fat mass and free fat mass, expressed as percentage of total body mass, were assessed by bio-impedance analy-sis (BIA, 101/S Akern; Florence, Italy) the morning after overnight fasting and after voiding. The two vector com-ponents of impedance (i.e. resistance and reactance) were obtained by single measurements; before each test-ing session, the external calibration of the instrument was checked with a calibration circuit of known imped-ance value. The mean coefficient of variation was 1 % for within-day and 3 % for weekly intraindividual measure-ments in the steady-state condition in either site and 2 % for interoperator variability.
Resting energy expenditure (REE) was expressed in kilocalories per 24 h and determined in a thermoregu-lated room (22–24 °C) by computed open-circuit indirect calorimetry, measuring resting oxygen uptake and resting carbon dioxide production by a ventilated canopy (Sen-sormedics, Milan, Italy) at 1-min intervals for 30 min and expressed as 24 h value. Predicted REE was calculated by the Harris–Benedict formula and allowed to test for met-abolic efficiency.
Laboratory tests
Insulin resistance was calculated by the homeostatic model of insulin resistance (HOMA-IR) index: insulin (mIU/L) × [glucose (mmol/L)/22.5]. A HOMA-IR value greater than 2.0 was considered indicative of insulin resistance, as obtained in a sample of the Italian popu-lation [24]. The homeostatic model of β cell function (HOMA-B) was used to describe the functionality of pancreatic beta cells and calculated using the following
formula: 20 [insulin (mIU/L)/glucose (mmol/L) − 3.5]. HbA1c levels were determined in 290 patients of the metformin-untreated group and all metformin-treated patients. ADA recommendations for 2012 [25] were used for the definition of glucose metabolism and T2DM based on fasting plasma glucose (FPG) and glycated hemo-globin (HbA1c), as follows: normal FPG if <5.6 mmol/L; impaired FPG (IFG) if FPG was 5.5–6.9 mmol/L; T2DM if FPG was ≥7.0 mmol/L on 2 days apart. HbA1c val-ues of 5.7 and 6.5 % were considered as the threshold of normal glucose metabolism and T2DM, respectively. Undiluted serum samples were assayed for fT4 and TSH using an automated chemiluminescence assay system (Immulite 2000; DPC, Los Angeles, CA). The principle of the method is a two-site, solid-phase chemiluminescent immunometric assay or competitive immunoassay. Nor-mal values for TSH are 0.4–4.5 mIU/L, and for fT4 102.9-244.5 nmol/L. Insulin levels were measured by immulite. Glucose, total cholesterol, high-density (HDL) and low-density lipoprotein (LDL) cholesterol, and triglycerides were measured by enzymatic methods (Roche Diagnos-tics, Mannheim, Germany). Fibrinogen levels were deter-mined with the Clauss methodology by Hemosil assay (IL Coagulation System, Instrumentation Laboratory, Bedford, MA). Ultrasensitive C-reactive protein (CRP) was measured by CRP (latex) HS Roche kit, having sen-sitivity of 0.03 nmol/L, intraassay and interassay CVs of 2.51–5.35 and 4.25–5.79 %, respectively, as reported by the manufacturer. Alkaline phosphatase, aspartate ami-notransferase (AST) and alanine amiami-notransferase (ALT) were assayed according to the International Federation of Clinical Chemistry (IFCC), without pyridoxal-5′-phosphate, using the Cobas Integra 800 (Roche Diag-nostics). Gamma-glutamyltranspeptidase (GGT) was measured by enzymatic colorimetric test using Roche/ Hitachi 904/911/912/917/modular (Roche Diagnostics). Statistics
Statistical analysis was performed using SPSS version 18 (Somers, NY, USA) on log transformed data to correct for the non-Gaussian distribution obtained by the Shapiro– Wilk test. Values are expressed as medians and interquar-tile ranges. Mann–Whitney test was used for comparison between subgroups. Spearman’s correlation analysis and the Chi square were used to identify significant asso-ciations between variables of interest. The role of non-collinear variables on TSH and fT4 levels was tested by stepwise multiple regression analysis using as independ-ent variables age, gender, BMI, use of metformin, total cholesterol and fT4 or TSH, depending on whether TSH or fT4 levels were analyzed, respectively. HOMA-IR and waist circumference were employed as additional covari-ates in this model after exclusion of potential collinear
variables. Logistic regression analysis to test the effect of metformin-treated diabetes mellitus and other variables of interest on the levels of thyroid parameters. Statistical significance was set at 5 %.
Results
A summary of anthropometric and biochemical data are reported in Table 1. BMI values were comprised between 30–73.6 kg/m2, and were >40 kg/m2in 78.8 %
(750 patients), >35–39.9 kg/m2 in 17.8 % (172 patients),
and >30–34.9 kg/m2 in 3.1 % of cases (30 patients). The
metformin-treated diabetic subgroup exhibited greater BMI, waist circumference and fat mass than their coun-terpart. Both subpopulations were, however, severely insulin resistant and HOMA-IR exceed the normal threshold of 2 [23] in 81.6 % of metformin-untreated and 87 % of metformin-treated diabetic patients. Ninety-four metformin-treated diabetic subjects were on statins at the time of the study, which likely explained the dif-ferences in total and LDL-cholesterol noted between groups.
Analysis of thyroid function showed a mild increase in TSH levels in a subset of 30 patients (5.6 %). None of these harbored any increase in anti-thyroid antibody titer or abnormal free thyroid hormone levels. Table 1 illus-trates similar TSH levels between metformin-treated dia-betic patients and metformin-untreated subjects. Based on the TSH reducing effects previously found to be elic-ited by metformin, our attention was mainly focused on TSH values in metformin users and non-users, yet data dichotomization by median TSH levels o 1.72 mIU/L showed a comparable distribution of metformin users between top and bottom TSH bearers (24.3 and 23.2 %, respectively), with results being equivalent if TSH was stratified by quartiles (Fig. 1) or logistic regression anal-ysis (Table 2). Oppositely, analysis of fT4 levels showed significantly higher fT4 levels in metformin-treated dia-betic subjects compared to metformin-untreated ones. Interestingly, when a subset of 113 metformin-untreated obese patients with incident diabetes mellitus was con-sidered separately, these patients exhibited lower TSH [1.50 (IQR 1.12–2.01) vs. 1.80 (IQR 1.24–2.51) mIU/L; p = 0.02] and greater abdominal obesity [waist, 132 (IQR 121–141) vs. 114.7 (IQR 100.4–132.5) cm; p < 0.001] than the normoglycaemic counterpart, devoid of differ-ences in fT4 levels [11.1 (IQR 10.2–12.4) vs. 11.3 (IQR 10.2–12.6) pg/mL] or BMI values [44.5 (IQR 40.3–49.3) vs. 43.5 (IQR 39.5–48.2) kg/m2]. Gender stratification
showed no differences in TSH and fT4 levels (data not shown).
Bivariate regression analyses on the whole dataset depicted a significant negative correlation between TSH and fT4 levels (rho = −0.091, p = 0.005), with each being
weakly correlated in opposite direction with BMI (TSH: rho = 0.078, p = 0.02; fT4: rho = −0.074, p = 0.02) and waist circumference (TSH: rho = 0.063, p = 0.06; fT4: rho = −0.066, p = 0.04). The relationship between TSH and fT4 persisted after controlling for age, BMI, gen-der, HOMA-IR and the use of metformin (r = 0.088, p = 0.008). No correlation was observed between TSH and age. In sub-group analysis, patients aged >70 year (103 cases, 10.8 %) showed comparable TSH levels with the remainders (1.68 mUI/L [IQR 1.25–2.46] vs 1.72 mUI/mL, [IQR 1.21–2.47]); the possibility that this represented a ‘survivor’ sample of patients was hinted by the finding of a slightly healthier metabolic profile when compared to the younger counterpart, i.e. lower levels of
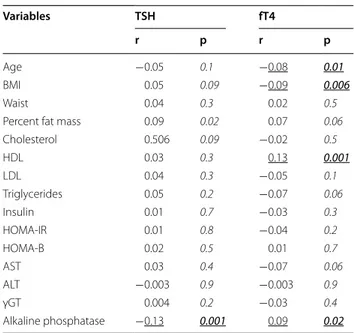
total and LDL cholesterol, triglycerides, and HbA1c (data not shown). When thyroid function was plotted against serum parameters of cardiovascular risk in the popu-lation as a whole, TSH was only associated with total cholesterol (rho = 0.080, p = 0.01). Of note, fT4 levels were inversely related to triglycerides (rho = −0.091, p = 0.005), insulin (rho = −0.079, p = 0.02) and HOMA-IR (rho = −0.083, p = 0.01), and directly to HDL-choles-terol (rho = 0.106, p = 0.001). In testing the relationship between thyroid function and cardio-metabolic vari-ables after controlling for potential confounders (i.e. age, gender, BMI, incident diabetes mellitus, use of met-formin, use of statins, smoking), only fT4 remained cor-related with age, BMI and HDL-cholesterol, while the Table 1 Summary of anthropometric and biochemical data obtained in the whole study population, in the euthyroid metformin-treated obese diabetic subpopulation (OB-EuM) and the euthyroid obese metformin-untreated subpopula-tion (Ob-Eu)
HbA1c levels in Ob-Eu refer to measurement in a subgroup of 290 patients. Data are expressed as medians (with interquartile range in parentheses). Comparison between populations was performed by Mann–Whitney test on log-transformed data and χ2 test
BMI body mass index; REE resting energy expenditure; HOMA-IR homeostatic model of insulin resistance; HOMA-B homeostatic model of β cell function; LDL low
density lipoprotein; HDL high density lipoprotein; AST aspartate aminotransferase; ALT alanine aminotransferase; γGT gamma glutamiltransferase; ALP alkaline phosphatase; CRP C-reactive protein
Variables Whole population (n = 952) OB-EuM (n = 306) Ob-Eu (n = 646) p
Males/females 410/542 127/179 283/363 0.5 Age (years) 56 (49–65) 58 (50–65) 55 (48–65) 0.07 BMI (kg/m2) 44.4 (40.5–48.9) 45.6 (41.4–49.6) 43.7 (40.0–48.7) 0.003 Weight (kg) 117.8 (102.8–133.5) 118.3 (106.0–134.0) 117.3 (101.6–133.1) 0.09 Height (cm) 161.8 (155–171) 161 (155–170) 162 (155–171) 0.3 Waist (cm) 129 (119–138) 131 (122–140) 127 (116–137) <0.001 Waist-to-hip ratio 0.96 (0.89–1.92) 0.97 (0.91–1.04) 0.94 (0.88–1.02) <0.001 REE (kcal/day) 1909 (1651–2247) 1963 (1740–2280) 1884 (1598–2233) 0.003 Fat mass (%) 46.3 (41.0–51.8) 47.3 (41.9–52.6) 45.7 (40.4–51.3) 0.009 Body water (%) 39.7 (36.2–44.2) 39.5 (36.3–43.9) 39.8 (36.2–44.4) 0.7 TSH (mIU/L) 1.72 (1.21–2.47) 1.72 (1.19–2.45) 1.72 (1.22–2.47) 0.7 fT4 (nmol/L) 146.3 (132.5–162.1) 151.9 (135.1–163.5) 145.4 (131.3–162.2) <0.001 Insulin (pmol/L) 100.7 (65.9–145.8) 98.6 (62.5–150.0) 102.1 (68.1–143.1) 0.5 Glucose (mmol/L) 5.77 (5.05–7.21) 7.38 (6.05–8.99) 5.38 (5.38–6.22) <0.001 HbA1c (%) 6.6 (6.0–7.9) 7.5 (6.5–8.7) 6.1 (5.7–6.7) <0.001 HOMA-IR 4.0 (2.5–6.1) 4.7 (2.9–7.2) 3.7 (2.3–5.6) <0.001 HOMA-B 125.2 (72.1–214.1) 76.3 (42.6–133.1) 152.0 (97.1–248.3) <0.001 Cholesterol (mmol/L) 5.10 (4.38–5.80) 4.79 (4.01–5.44) 5.26 (4.66–5.98) <0.001 LDL (mmol/L) 3.12 (2.49–3.76) 2.75 (2.16–3.39) 3.30 (2.70–3.93) <0.001 HDL (mmol/L) 1.09 (0.91–1.35) 1.04 (0.85–1.27) 1.11 (0.93–1.37) <0.001 Triglycerides (mmol/L) 1.59 (1.23–2.18) 1.73 (1.31–2.37) 1.55 (1.20–2.09) <0.001 AST (μkat/L) 0.35 (0.28–0.48) 0.35 (0.28–0.50) 0.35 (0.30–0.48) 0.8 ALT (μkat/L) 0.45 (0.32–0.70) 0.43 (0.32–0.70) 0.45 (0.32–0.70) 0.8 γGT (μkat/L) 0.48 (0.32–0.75) 0.50 (0.33–0.87) 0.47 (0.30–0.72) 0.07 ALP (μkat/L) 1.64 (1.14–3.02) 1.25 (1.04–1.65) 2.27 (1.25–3.35) <0.001 CRP (nmol/L) 5.71 (2.86–10.48) 5.71 (2.86–11.43) 5.71 (3.81–10.48) 0.5 Fibrinogen (μmol/L) 11.64 (10.17–13.38) 11.44 (9.91–13.17) 11.76 (10.29–13.52) 0.04
correlation with triglycerides approached statistical sig-nificance (Table 3). No relationship was seen between thyroid function and C-reactive protein, fibrinogen and liver function tests, but with alkaline phosphatase (TSH: rho = −0.098, p = 0.002; fT4: rho = 0.070, p = 0.03). Likewise, no association related thyroid function to REE and metabolic efficiency, as well as BIA-derived param-eters of body composition (data not shown).
In multivariate linear regression analysis, TSH was best predicted by fT4 (standardized β = −0.079, p = 0.015), total cholesterol (standardized β = 0.074, p = 0.02) and BMI (standardized β = 0.065, p = 0.04). Replacement of BMI with waist circumference did not reach statisti-cal significance. When FT4 levels were tested as the dependent variable, they were predicted by TSH (stand-ardized β = −0.84, p = 0.01), metformin-treated diabe-tes mellitus (standardized β = 0.087, p = 0.008), BMI
(standardized β = −0.83, p = 0.012) and age (standard-ized β = −0.80, p = 0.015). When waist circumference replaced BMI, it also entered the regression equation (standardized β = −0.077, p = 0.021). HOMA-IR did not enter the regression equation both when TSH and fT4 levels were tested.
Discussion
Obesity is conventionally regarded as the result of unbal-anced calorie intake and impaired energy expenditure acting on a predisposed genetic setting. A common explanatory model encompasses the lipostatic regulation system, in which energy stores generate signals that are compared with targets encoded in the brain, and differ-ences between these drive our food intake levels, activ-ity patterns, and resting and active metabolisms [26]. Although obesity predisposes to hyperthyrotropinaemia and reductions in fT4 levels [1, 2], TSH levels can still provide a peripheral index of thyroid activity also in the obese state [27]. So far, analyses on the metabolic cor-relates of thyroid function in obesity have provided lit-tle evidence, or were conducted in small cohorts so as to draw definitive conclusions [1, 2]. In this regard, a potential confounder is constituted by the antidiabetic
Fig. 1 Comparison of TSH quartiles between obese euthyroid obese
patients with diabetes and treated with metformin (Met) and those without diabetes and not treated with metformin (No Met). Medians (diamonds) and interquartile ranges (lines) are displayed
Table 2 Logistic regression analysis on values of TSH and BMI dichotomized by median values (0 = bottom val-ues; 1 = top values) in the population as a whole
Odds ratio and 95 % confidence intervals are displayed. BMI body mass index;
REE resting energy expenditure; HOMA-IR homeostatic model of insulin
resistance. Use of metformin was categorized as 0 = no use of metformin, 1 = use of metformin. Significant values are in italics
Variables TSH BMI Age 0.98 (0.96–0.99) 0.99 (0.98–1.01) Female gender 1.08 (0.59–1.73) 5.67 (3.61–8.90) TSH – 1.05 (0.89–1.24) BMI 0.97 (0.94–1.01) – REE 1.00 (0.99–1.00) 1.003 (1.002–1.003) HOMA-IR 1.01 (0.99–1.02) 0.99 (0.98–1.01) Use of metformin 1.09 (0.78–1.52) 1.29 (0.90–1.85)
Table 3 Correlation analysis between thyroid function and phenotypic variables of interest in the obese group as a whole, after controlling for age, gender, BMI and use of metformin
Italic values indicate p-values Underlined values indicate significance
Italic underlined values indicate statistically significant p-values Age and BMI were omitted as covariates when measured as independent variables Variables TSH fT4 r p r p Age −0.05 0.1 −0.08 0.01 BMI 0.05 0.09 −0.09 0.006 Waist 0.04 0.3 0.02 0.5
Percent fat mass 0.09 0.02 0.07 0.06
Cholesterol 0.506 0.09 −0.02 0.5 HDL 0.03 0.3 0.13 0.001 LDL 0.04 0.3 −0.05 0.1 Triglycerides 0.05 0.2 −0.07 0.06 Insulin 0.01 0.7 −0.03 0.3 HOMA-IR 0.01 0.8 −0.04 0.2 HOMA-B 0.02 0.5 0.01 0.7 AST 0.03 0.4 −0.07 0.06 ALT −0.003 0.9 −0.003 0.9 γGT 0.004 0.2 −0.03 0.4 Alkaline phosphatase −0.13 0.001 0.09 0.02
agent metformin, based on its ability to reduce TSH lev-els in subjects with hypothyroidism and in those with euthyroidism harboring normal-high TSH levels [11–15, 18–20]. Metformin acts as insulin-sensitizer in multiple ways, such as by decreasing hepatic glucose production through inhibition of the mitochondrial respiratory-chain complex 1, by activating the cellular metabolic sensor AMPK, by increasing glucagon-like peptide 1 (GLP-1) levels, as well as by inducing islet incretin recep-tor gene expression [28–31]. The exact mechanisms linking metformin effects to variations in pituitary TSH secretion are currently unknown, but possibly involve inhibition of hypothalamic AMPK, counteraction of cen-tral T3 effects, dopaminergic effects and/or inhibition of pituitary TSH secretion [11, 32, 33]. In the current study, first of all we documented comparable TSH levels between obese patients treated and not treated with met-formin. This result was confirmed by multiple statistical approaches. Oppositely, a slight yet significant increase in fT4 levels was seen in metformin-treated subjects com-pared with their untreated counterpart. This latter find-ing contrasts with the observation that metformin leaves unaltered free thyroid hormone levels [34], and possibly reflects an effect played by obesity on thyroid hormone metabolism either mediated by type 2 deiodinase activ-ity, TH binding to TBG, or thyroxine degradation. How-ever, we do not exclude that such finding simply results from metabolic differences existing between subgroups, since metformin-treated subjects were slightly older and mildly more insulin resistant, showed a more cen-tral distribution of body fat and higher BMI compared to the metformin-untreated counterpart. Along this line of reasoning, the positive correlation between fat mass and fT4 found by others [35] supports the hypothesis that abdominal adiposity may increase free thyroid hor-mone. In addition, diabetes mellitus can increase per se fT3 inactivation to rT3 and decrease T4 conversion to T3 due to lower type 2 deiodinase activity [36], while meta-bolic syndrome can lead to higher fT4 levels in obese subjects [37]. Our obese patients with incident diabetes mellitus were found to harbor lower TSH compared with their metformin-untreated counterpart. In this subgroup, individual analysis found no potential case of subclini-cal dysfunction and no significant metabolic impact was documented in correlation analyses likely due to the sam-ple dimension and the overall high rate of severe obesity in our study (nearly 80 %). Further investigations in larger datasets are warranted to verify the clinical significance of this observation.
Together, our results pinpoint potentially different metabolic roles for TSH and fT4 in the obese setting. In general, TSH was associated with increasing BMI and total but not HDL cholesterol levels. These associations
disappeared after controlling for individuals’ confound-ers. Oppositely, fT4 levels showed an inverse relation with BMI, insulin, HOMA-IR, triglycerides, in conjunc-tion with a direct associaconjunc-tion with HDL-cholesterol. fT4 associations with the metabolic phenotype remained sig-nificant after adjustment for potential confounders. This leads us to speculate that fT4 reflects better than TSH the cardiometabolic risk of obesity: according to this view, TSH levels mirror the obese phenotype, while fT4 levels act as a proxy of the metabolic status related to the obese phenotype. Previous studies in morbidly obese patients found an association of increasing TSH, and less signifi-cantly decreasing FT4, with insulin and insulin resistance [3, 38, 39], yet none was controlled for individual con-founders. On the other hand, population studies related low fT4 more tightly to cardiometabolic indices (BMI, insulin resistance, lipid profile and intima media thick-ness) than high TSH levels [40–43]. In a Korean study on 6241 non diabetic euthyroid subjects, those with the low-est fT4 quartile had twice the risk for insulin resistance as compared to those in the highest quartile after adjust-ment for age, sex, metabolic, and life style factors [44]. Nevertheless, the NHANES 2007–2008 analysis on 3114 euthyroid healthy men and women found that only TSH levels, and to a lesser degree fT3, were correlated with BMI and waist circumference, while fT4 levels were not [8]. Likewise, the Asklepios Study on 2315 healthy euthy-roid middle-aged men and women found that a higher fT3–fT4 ratio (index of conversion from fT4 to fT3) was predictive of an unfavorable metabolic profile [45]. Dif-ferences in prevalence and degree of obesity, fat partition, genetic background, and insulin sensitivity may contrib-ute to explain the observed discrepancies.
In conclusion, fT4 levels appeared to be related to the overall metabolic phenotype of obese patients, while the metabolic impact of TSH was less prominent. Incident diabetes seems associated with a reduction in TSH results, yet further studies in larger samples of euthyroid obese patients are needed to detail the individual clustering of TSH and fT4 levels with metabolic features in this setting.
Abbreviations
ALP: alkaline phosphatase; ALT: alanine aminotransferase; AST: aspartate aminotransferase; BIA: bio-impedance analysis; BMI: body mass index; CRP: ultrasensitive C-reactive protein; FPG: fasting plasma glucose; fT3: free trii-odothyronine; fT4: free thyroxin; GGT: gamma-glutamyltranspeptidase; HbA1c: glycated hemoglobin; HDL: high-density lipoprotein; HOMA-B: homeostatic model of β cell function; HOMA-IR: homeostatic model of insulin resistance; IFCC: International Federation of Clinical Chemistry; IFG: impaired fasting plasma glucose; LADA: latent autoimmune diabetes of the adult; LDL: low-density lipoprotein; REE: resting energy expenditure; T2DM: type 2 diabetes mellitus; TSH: thyroid-stimulating hormone.
Authors’ contributions
PM design of the study, data analysis, writing of the manuscript. CM patient recruitment, dataset management. SM dataset management, biochemi-cal analyses. GG patients recruitment. DS statistibiochemi-cal analysis. MAT patients
recruitment. MEB patients recruitment. FP critical overview. DS data analysis, critical overview. GA critical overview. MS data analysis, critical overview. All authors read and approved the final manuscript.
Author details
1 Division of General Medicine, I.R.C.C.S. Istituto Auxologico Italiano, Ospedale
S. Giuseppe, Casella Postale 1, 28921 Verbania, Italy. 2 Laboratory of
Meta-bolic Research, I.R.C.C.S. Istituto Auxologico Italiano, Ospedale S. Giuseppe, 28921 Verbania, Italy. 3 Division of Biostatistics, Epidemiology and Public
Health, Department of Statistics and Quantitative Methods, University of Milano-Bicocca, 20126 Milan, Italy. 4 Endocrinology, Università del Piemonte
Orientale, 28100 Novara, Italy. 5 Division of Obstetrics and Gynaecology,
Department of Translational Medicine, Università del Piemonte Orientale, 28100 Novara, Italy. 6 Department of Clinical Sciences and Community Health,
University of Milan, 20122 Milan, Italy.
Acknowledgements
Not applicable.
Competing interests
The authors declare that they have no competing interests.
Ethics approval and consent to participate
Written consent was obtained from all patient, after full explanation of the purpose and nature of the study. The investigation was approved by the local ethical committee, functioning according to the 3rd edition of the Guidelines on the Practice of Ethical Committees in Medical Research.
Funding
This research did not receive any specific grant from any funding agency in the public, commercial or not-for-profit sector.
Received: 10 May 2016 Accepted: 9 August 2016
References
1. Santini F, Marzullo P, Rotondi M, Ceccarini G, Pagano L, Ippolito S, et al. Mechanisms in endocrinology: the crosstalk between thyroid gland and adipose tissue: signal integration in health and disease. Eur J Endocrinol. 2014;171:R137–52.
2. Knudsen N, Laurberg P, Rasmussen LB, Bulow I, Perrild H, Ovesen L, et al. Small differences in thyroid function may be important for body mass index and the occurrence of obesity in the population. J Clin Endocrinol Metab. 2005;90:4019–24.
3. Michalaki MA, Vagenakis AG, Leonardou AS, Argentou MN, Habeos IG, Makri MG, et al. Thyroid function in humans with morbid obesity. Thyroid. 2006;16:73–8.
4. De Pergola G, Ciampolillo A, Paolotti S, Trerotoli P, Giorgino R. Free trii-odothyronine and thyroid stimulating hormone are directly associated with waist circumference, independently of insulin resistance, metabolic parameters and blood pressure in overweight and obese women. Clin Endocrinol (Oxf ). 2007;67:265–9.
5. Rotondi M, Leporati P, La Manna A, Pirali B, Mondello T, Fonte R, et al. Raised serum TSH levels in patients with morbid obesity: is it enough to diagnose subclinical hypothyroidism? Eur J Endocrinol. 2009;160:403–8. 6. Marzullo P, Minocci A, Tagliaferri MA, Guzzaloni G, Di Blasio A, De Medici C, et al. Investigations of thyroid hormones and antibodies in obesity: leptin levels are associated with thyroid autoimmunity independent of bioanthropometric, hormonal, and weight-related determinants. J Clin Endocrinol Metab. 2010;95:3965–72.
7. Souza De Moura. A, Sichieri R. Association between serum TSH con-centration within the normal range and adiposity. Eur J Endocrinol. 2011;165:11–5.
8. Kitahara CM, Platz EA, Ladenson PW, Mondul AM, Menke A, Berrington de González A. Body fatness and markers of thyroid function among U.S. men and women. PLoS ONE. 2012;7:e34979.
9. Taylor PN, Razvi S, Pearce SH, Dayan C. A review of the clinical conse-quences of variation in thyroid function within the reference range. J Clin Endocrinol Metab. 2013;98:3562–71.
10. Reinehr T. Obesity and thyroid function. Mol Cell Endocrinol. 2010;316:165–71.
11. Duntas LH, Orgiazzi J, Brabant G. The interface between thyroid and diabetes mellitus. Clin Endocrinol (Oxf ). 2011;75:1–9.
12. Vigersky RA, Filmore-Nassar A, Glass AR. Thyrotropin suppression by metformin. J Clin Endocrinol Metab. 2006;91:225–7.
13. Isidro ML, Penín MA, Nemiña R, Cordido F. Metformin reduces thyrotropin levels in obese, diabetic women with primary hypothyroidism on thyrox-ine replacement therapy. Endocrthyrox-ine. 2007;32:79–82.
14. Cappelli C, Rotondi M, Pirola I, Agosti B, Gandossi E, Valentini U, et al. TSH-lowering effect of metformin in type 2 diabetic patients: differ-ences between euthyroid, untreated hypothyroid, and euthyroid on L-T4 therapy patients. Diabetes Care. 2009;32:1589–90.
15. Rotondi M, Cappelli C, Magri F, Botta R, Dionisio R, Iacobello C, et al. Thyroidal effect of metformin treatment in patients with polycystic ovary syndrome. Clin Endocrinol (Oxf ). 2011;75:378–81.
16. Fournier JP, Yin H, Yu OH, Azoulay L. Metformin and low levels of thyroid-stimulating hormone in patients with type 2diabetes mellitus. CMAJ. 2014;186:1138–45.
17. Díez JJ, Iglesias P. Relationship between serum thyrotropin concentra-tions and metformin therapy in euthyroid patients with type 2 diabetes. Clin Endocrinol (Oxf ). 2013;78:505–11.
18. Cappelli C, Rotondi M, Pirola I, Agosti B, Formenti A, Zarra E, et al. Thyreotropin levels in diabetic patients on metformin treatment. Eur J Endocrinol. 2012;167:261–5.
19. Karimifar M, Aminorroaya A, Amini M, Mirfendereski T, Iraj B, Feizi A, et al. Effect of metformin on thyroid stimulating hormone and thyroid volume in patients with prediabetes: a randomized placebo-controlled clinical trial. J Res Med Sci. 2014;19:1019–26.
20. Santos-Palacios S, Brugos-Larumbe A, Guillén-Grima F, Galofré JC. A cross-sectional study of the association between circulating TSH level and lipid profile in a large Spanish population. ClinEndocrinol (Oxf ). 2013;79:874–81.
21. Levri KM, Slaymaker E, Last A, Yeh J, Ference J, D’Amico F, et al. Metformin as treatment for overweight and obese adults: asystematic review. Ann Fam Med. 2005;3:457–61.
22. Bellan M, Guzzaloni G, Rinaldi M, Merlotti E, Ferrari C, Tagliaferri A, et al. Altered glucose metabolism rather than naive type 2 diabetes mellitus (T2DM) is related to vitamin D status in severe obesity. Cardiovasc Diabe-tol. 2014;13:57.
23. WHO. Obesity: preventing and managing the global epidemic. Report of a WHO consultation. WHO technical report series 894. Geneva: World Health Organization; 2000.
24. Bonora E, Targher G, Alberiche M, Bonadonna RC, Saggiani F, Zenere MB, et al. Homeostasis model assessment closely mirrors the glucose clamp technique in the assessment of insulin sensitivity: studies in subjects with various degrees of glucose tolerance and insulin sensitivity. Diabetes Care. 2000;23:57–63.
25. American Diabetes Association. Standards of medical care in diabetes - 2012. Diabetes Care. 2012;35:S11–63.
26. Speakman JR. Obesity: the integrated roles of environment and genetics. J Nutr. 2004;134:2090S–105S.
27. Tagliaferri M, Berselli ME, Calò G, Minocci A, Savia G, Petroni ML, et al. Subclinical hypothyroidism in obese patients: relation to resting energy expenditure, serum leptin, body composition, and lipid profile. Obes Res. 2001;9:196–201.
28. Zhou G, Myers R, Li Y, Chen Y, Shen X, Fenyk-Melody J, et al. Role of AMP-activated protein kinase in mechanism of metformin action. J Clin Invest. 2001;108:1167–74.
29. Gunton JE, Delhanty PJ, Takahashi S, Baxter RC. Metformin rapidly increases insulin receptor activation in human liver and signals prefer-entially through insulin-receptor substrate-2. J Clin Endocrinol Metab. 2003;88:1323–32.
30. Maida A, Lamont BJ, Cao X, Drucker DJ. Metformin regulates the incretin receptor axis via a pathway dependent on peroxisome proliferator-activated receptor-alpha in mice. Diabetologia. 2011;54:339–49. 31. Lim CT, Kola B, Korbonits M. AMPK as a mediator of hormonal signalling. J
MolEndocrinol. 2010;44:87–97.
32. López M, Varela L, Vázquez MJ, Rodríguez-Cuenca S, González CR, Vela-gapudi VR, et al. Hypothalamic AMPK and fatty acid metabolism mediate thyroid regulation of energy balance. Nature Med. 2010;16:1001–8.
• We accept pre-submission inquiries
• Our selector tool helps you to find the most relevant journal • We provide round the clock customer support
• Convenient online submission • Thorough peer review
• Inclusion in PubMed and all major indexing services • Maximum visibility for your research
Submit your manuscript at www.biomedcentral.com/submit
Submit your next manuscript to BioMed Central
and we will help you at every step:
33. Łabuzek K, Suchy D, Gabryel B, Bielecka A, Liber S, Okopień B. Quantifica-tion of metformin by the HPLC method in brain regions, cerebrospinal fluid and plasma of rats treated with lipopolysaccharide. Pharmacol Rep. 2010;62:956–65.
34. Lupoli R, Di Minno A, Tortora A, Ambrosino P, Lupoli GA, Di Minno MN. Effects of treatment with metformin on TSH levels: a meta-analysis of literature studies. J Clin Endocrinol Metab. 2014;99:E143–8. 35. Roef G, Lapauw B, Goemaere S, Zmierczak HG, Toye K, Kaufman JM,
et al. Body composition and metabolic parameters are associated with variation in thyroid hormone levels among euthyroid young men. Eur J Endocrinol. 2012;167:719–26.
36. Moura Neto A, Parisi MC, Tambascia MA, Alegre SM, Pavin EJ, Zantut-Wittmann DE. The influence of body mass index and low-grade systemic inflammation on thyroid hormone abnormalities in patients with type 2 diabetes. Endocr J. 2013;60:877–84.
37. Tarcin O, Abanonu GB, Yazici D, Tarcin O. Association of metabolic syn-drome parameters with TT3 and FT3/FT4 ratio in obese Turkish popula-tion. Metab Syndr Relat Disord. 2012;10:137–42.
38. Iacobellis G, Ribaudo MC, Zappaterreno A, Iannucci CV, Leonetti F. Relationship of thyroid function with body mass index, leptin, insulin sensitivity and adiponectin in euthyroid obese women. Clin Endocrinol (Oxf ). 2005;62:487–91.
39. Ambrosi B, Masserini B, Iorio L, Delnevo A, Malavazos AE, Morricone L, et al. Relationship of thyroid function with body mass index and insulin-resistance in euthyroid obese subjects. J Endocrinol Invest. 2010;33:640–3.
40. Roos A, Bakker SJ, Links TP, Gans RO, Wolffenbuttel BH. Thyroid function is associated with components of the metabolic syndrome in euthyroid subjects. J Clin Endocrinol Metab. 2007;92:491–6.
41. Dullaart RP, de Vries R, Roozendaal C, Kobold AC, Sluiter WJ. Carotid artery intima media thickness is inversely related to serum free thyroxine in euthyroid subjects. Clin Endocrinol (Oxf ). 2007;67:668–73. 42. Kim BJ, Kim TY, Koh JM, Kim HK, Park JY, Lee KU, et al. Relationship
between serum free T4 (FT4) levels and metabolic syndrome (MS) and its components in healthy euthyroid subjects. Clin Endocrinol (Oxf ). 2009;70:152–60.
43. Mehran L, Amouzegar A, Tohidi M, Moayedi M, Azizi F. Serum free thyrox-ine concentration is associated with metabolic syndrome in euthyroid subjects. Thyroid. 2014;24:1566–74.
44. Shin JA, Mo EY, Kim ES, Moon SD, Han JH. Association between lower normal free thyroxine concentrations and obesity phenotype in healthy euthyroid subjects. Int J Endocrinol. 2014;2014:104318.
45. Roef GL, Rietzschel ER, Van Daele CM, Taes YE, De Buyzere ML, Gillebert TC, et al. Triiodothyronine and free thyroxine levels are differentially associated with metabolic profile and adiposity-related cardiovascular risk markers in euthyroid middle-aged subjects. Thyroid. 2014;24:223–31.