UNIVERSITÀ DEGLI STUDI DEL MOLISE
FACOLTÀ DI SCIENZE MM.FF.NN.(ISERNIA)
DOTTORATO DI RICERCA IN AMBIENTE E TERRITORIO
XXV CICLO
TITOLO
Modelling the cumulative impact of wind farms on bats on a regional scale
DOCENTE GUIDA: DOTTORANDO:
Prof. Anna Loy Dott.ssa Federica Roscioni
COORDINATORE DOTTORATO: Prof. Claudio Caprari
CONTENTS
1
Introduction
51.1 Wind farms and wildlife 5
1.2 Impact regulatory framework 6
1.2.1 European legal frameworks 6
1.2.2 The Italian legal framework 9
1.3 Monitoring wind farms impact in Italy 10
1.4 Cumulative impact 11
1.5 Project framework 11
Objectives 13
2
Methods
142.1 Study area 14
2.2 Species distribution models 15
2.2.1 Presence data 15
2.2.2 Environmental variables 16
2.2.3 Wind farm location map 20
2.2.4 Species distribution models procedures 20
2.2.5 Landscape Pattern Analyses 22
2.2.6 Connectivity analyses 23
3
Results
263.1 Impact assessment at landscape scale 33
3.1.1 Species distribution models 33
3.1.2 Landscape pattern analyses 36
3.2 Hot spots, connectivity and barrier effect 38
3.2.2 Connectivity analyses 43
3.3 Wind farms and related impacts 45
4
Discussion
484.1 Impact assessment at landscape scale 49
4.2 Hot spots, connectivity and barrier effect 50
4.3 Implication for conservation 53
Acknowledgements 55
1
Introduction
Europe is faced with the need to tackle climate change and environmental pollution, and to find sustainable methods to meet demands for generating power. This is set out in Directive 2001/77/EC of the European Parliament and of the Council of 27 September 2001 on the promotion of electricity produced from renewable energy sources in the internal electricity market. European countries’ governments are also mindful of the need to reduce climate change for the long-term survival of migratory species. Some governments have made commitments to source power from renewable resources, e.g. the UK is committed to ensure that 10% of the country’s electricity should be generated from renewable sources by 2010/11 with an aspiration to double this by 2020.
The commitment to low-emission energy generation leads to an increased promotion of alternative methods for the production of energy, e.g. using wind power.
1.1 Wind farm and wildlife
At present wind farm industry is the most relevant form of renewable energy in Europe (Harbusch & Bach 2005). Although it represents a valuable action to mitigate the detrimental effects of carbon emission-related global warming on wildlife (Arnett et al. 2005) it has been found to affect wildlife, particularly flying vertebrates, indirectly by habitat loss and directly by increasing their mortality rate due to direct collisions with the turbines (Johnson et al. 2003; Telleria 2009).
Evaluating the magnitude of risk before wind farms construction appears the most promising strategy to locate wind turbines where their potential impact on wildlife is reduced (Larsen & Madsen 2000).
For several years, impact evaluation on wildlife mostly targeted birds (Rodrigues et al. 2008). Wind turbines have been described as a problem for birds for many years and discussion has been mainly about their negative effect through bird-strike (Winkelman 1989; Phillips 1994; Reichenbach 2002), but also about the disruption caused by wind farms to some bird species during breeding and migration (Reichenbach 2002). Since the 1990s, parallel to the discussions and findings about birds, it has been assumed that bat species foraging in the open air could be similarly affected. However, consideration for bat species increased after the publication of two papers by Rahmel et al. (1999) and Bach et al. (1999), and many local studies highlighting the occurrence of collision impacts on these mammals (Johnson et al. 2000; Johnson & Erickson 2003; Hötker et al. 2006; Long et al. 2009; Telleria 2009). Turbines can have many impacts on bat population in relation to their siting, to the season and to the species present in the area such as collision with rotary blades, disturbance or severance of migration routes, disturbance or severance of local commuting routes, disturbance or loss of foraging habitat, disturbance or loss of roosts (more likely
to occur where turbines are located in woodland habitats or close to buildings) (Arnett et al. 2005; Harbusch & Bach, 2005; Rodrigues et al, 2008).
In Europe, the Agreement on the Conservation of Populations of European Bats (EUROBATS) has issued specific guidelines (Rodrigues et al. 2008) setting the standards for appropriate consideration of bats in wind farm planning, as well as describing the methods to carry out bat surveys before construction and monitoring once wind turbines are operating. At present bats are well known to be sensitive to wind farms (Jaberg & Guisang 2001; Arnett et al. 2005; Rodrigues et al. 2008; Telleria 2009; Kunz et al. 2007b), but there is little knowledge of the relative weights of different types of impacts, i.e. collision risk, habitat loss, habitat fragmentation, etc. especially on a large geographical scale. In fact in all such studies the objective was to focus on specific sites and to provide survey – based assessments.
1.2 Impact regulatory frameworks 1.2.1 European legal frameworks
The EU Law combines several types of legal sources. Basically, there is a distinction between the EU Treaties (often called primary sources), and the regulations, directives, decisions etc. (often called the secondary sources). The regulations have a direct effect on the national legislation and apply fully in the Member States. This means that they do not need to be transposed into national legislation but confer rights and duties on the EU citizens directly similar to the national legislation. Besides Regulations the Directives is an important instrument in the EU legislation. The aim of the Directives is to harmonise the national legislation in the Member States. A Directive is binding for the Member States regarding achievement of the objectives defined in the Directive, but the Member States has to decide on how to implement the Directive in their national legal systems. However, the Court of Justice has defined the practice that each individual in the EU can rely on the contents of the Directives, and the Member States can be liable for damages for not implementing a Directive (Anker at al., 2008). Especially the Directives have major impact for the development of wind energy.
Environmental assessment is a procedure that ensures that the environmental implications of decisions are taken into account before the decisions are made. Environmental assessment can be undertaken for individual projects, such as a dam, motorway, airport or factory, on the basis of Directive 85/337/EEC – the EIA Directive (Environmental Impact Assessment), or for public plans or programmes on the basis of Directive 2001/42/EC – the SEA Directive (Strategic Environmental Assessment). The overall aim of both Directives is to ensure that plans, programmes and projects likely to have significant effects on the environment are considered for environmental assessment,
prior to their approval and implementation. According to the Arhus Convention public consultation is a key feature of both directives (UNECE, 1998).
The Directive on the Environmental Impact Assessment (the EIA Directive) has been in force since 1985 and is one of the main legal instruments for protecting nature and environment. The EIA Directive has been amended in 1997, 2003 and 2009. Particularly the amendments from 2003 are important for wind energy projects, because these amendments brought the EIA Directive in accordance with the UNECE Aarhus Convention (UNECE, 1998) regarding public participation and access to information on environmental matters.
The aim of the Directive is to define the legal framework for the assessment of the environmental effects of public and private projects, which seems to be likely to have significant effects on the environment. The Directive distinguishes between projects, where an Environmental Impacts Assessment is mandatory, and projects where the national authorities decide on the need for an EIA after a screening procedure. Annex 1 of the EIA Directive lists all projects where an EIA procedure is mandatory. This list includes big industrial plants (e.g. oil refineries), chemical installations, railways, motorways, waste disposal installations, huge farms, pipelines, and opencast mining. Annex two mentions many projects similar to the Annex-1 projects but typically at a smaller scale. Annex 1 also mentions ‘Installations for harnessing of wind power for energy production (wind farms)’.
Thus the need of environmental impact assessment has to be decided by the national authorities. Environmental Impacts Assessment (EIA) is a systematic process to identify, predict and evaluate the environmental effects of proposed actions and projects. The first step relates to the proposed project design: A description of the project, a general description of the fixed physical characteristics, operational characteristics and all kind of emissions. The second step is related to the possible alternatives regarding location, product design, project design and operational characteristics. The third step deals with a description of the baseline environmental criteria encompassing, present land-use, population density and structure, the flora and fauna, the surface and ground water quality, soil quality, landscape, air quality and climate, the built environment, and other relevant features.
Many Member States have implemented the Directive in the wind energy sector by defining rules for the need of an environmental impact assessment, and guidelines for carrying out the EIA – if needed.
The Strategic Environmental Assessment (SEA) refers to the environmental assessment of policies, plans and programmes, and the concept has developed from the practise of environmental impact assessment. The aim of strategic environmental assessment is to provide decision makers and stakeholders with timely an relevant information on the potential environmental impacts of
policies, plans and programmes in order to make necessary changes to make them environmentally more sound.
The EIA and SEA are rather similar in many respects, but there are some differences. The SEA process focuses purely on the assessment of plans or programmes, where as the EIA process focuses on individual development projects. SEA is area wide (e.g. covers geographical areas like regions, whereas EIA is generally site specific (e.g. applies to sites of a specific development project and their neighbourhoods. Strategic environmental assessments are desk based assessment based on existing available information, whereas environmental impact assessments involve a range of assessment methods including site visits, monitoring and modelling.
The Directive on Strategic Environmental Assessment (the SEA Directive) has been in force since 2001, and should have been transposed into EU and national legislation since July 2004 (European Commission, 2001). A strategic environmental assessment is mandatory for policies, plans, and programmes regarding agriculture, fishery, forestry, energy, industry, transport, waste and water management, telecommunications, regional and urban planning, and landuse.
Besides, a strategic environmental assessment is mandatory if it is requires according to the habitat directive (European Commission, 1992). For plans and programmes not mentioned above, the Member States must carry out a screening procedure to determine whether the plans and programmes are likely to have significant effect on the environment. If there are significant effects, a SEA is needed. The screening procedure is based on criteria set out in Annex II of the SEA Directive.
Rights to be informed about new developments, which may affect the citizens or the environment, and rights to be involved in the decision-making process set limitations for the public authorities to act with public participation. Public participation on environmental planning issues has its roots back in the late 1960s and early 1970s, where the authorities produced brochures and posters and arranged meetings to really involve the citizens. Until the 1990s public participation continued in the same manner. The United Nations Conference on Environment and Development (Earth Summit) in Rio de Janeiro in 1992, Principle 10 (United Nations, 1992a) and Agenda 21 (United Nations, 1992b) both called for increased public participation in environmental decision-making and led to the adoption in Europe of the Aarhus Convention (UN ECE, 1998). This development is further facilitated by the appearance of “symbolic politics” and growing popularity and acceptance of non-governmental organisations like Greenpeace and World Wildlife Fund.
The Aarhus Convention extends several EU Directives – particularly the Directive 2003/4/EC on access to environmental information. The Environmental Impact Assessment Directive, and Strategic Environmental Assessment Directive (Anker et al., 2008). Following the Aarhus Convention Article 2, the public in general must have access to environmental information, whereas
the directly affected public must be allowed to participate in the decision process. Also NGO’s promoting environmental protection should be included in this group.
Regarding public participation, the Arhus Convention distinguishes between: a) participation related to specific plans - Article 6; b) participation related to plans, programmes and policies – Article 7.
Access to justice concerns the right of citizens or NGO’s to require a legal review of a public decision by an independent court. The Aarhus Convention Article 9 obliges authorities to ensure that private persons and public authorities having access to administrative or judicial procedures to challenge acts, which are in conflict with laws relation to the environment.
The 2011/02/UE Directive on EIA was published on 28 February 2012. The objective was to unify all the modification of the Directive 85/337/EEC: 97/11/CE, 2003/35/CE e 2009/31/CE. There is no deadline for the adoption for the Member States because this new Directive sobstitutes the old one. According to the Aarhus Convention this Directive in the article 6 gives importance to the public participation on decision processes.
Besides the general legal European framework, because of the evidences of the impacts on wildlife specific guidelines for considering birds and bats in wind farm development have been implemented in the last ten years.
Birds are protected under the Directive 79/409/EEC, the Bern Convention and the Bonn Convention. In 2003 BirdLife International developed the guidelines for environmental assessment criteria and site selection issues for birds (Langston & Pullman, 2003).
Bats are protected under the Directive 92/43/EEC, the Bern Convention and the Bonn Convention. In Europe, the Agreement on the Conservation of Populations of European Bats (EUROBATS) has issued specific guidelines (Rodrigues et al. 2008) setting the standards for appropriate consideration of bats in wind farm planning. In 2009 also the Bat Conservation Trust implemented a report for Britain (Jones et al. 2009). Both documents rely on proper monitoring programmes for a “sustainable” development of wind farm industry in relation to bat populations. They also give indication on research priorities such as the need of evaluating the impacts on a large scale besides the local one.
1.2.2 The Italian legal framework
The first official document facing the need of renewable energy and wind farms is the National Energetic Plan (PEN) in force since 1988.
In Italy the EIA Directive (85/337/EEC) was adopted with L. 349 8 july 1988. The SEA Directive (2001/42/EC) was adopted in 2006 with the DLgs 152, 2 aprile 2006.
In 2010 were developed the national guidelines for the renewable energy. They release on a unique authorization to ensure a proper development of the energetic infrastructure on the national territory. This national guidelines had been predisposed by the Ministry of the Environment, the Ministry of Economic Development and the Ministry of Cultural Heritage and Environmental Conservation.
The objective is to define measures and unique criteria to ensure an orderly development of the energetic infrastructures.
With these guidelines certain rules are provided and they allow to promote investments combining development and environmental and landscape respect.
The guidelines have been approved with DM 10 september 2010 and published in the GU the 18 septembre 2010 (GU n. 219/2010 - DM 10 settembre 2010, Ministry of Economic Development , national guidelines for the authorization of renwable energy plants). It is important to remark that since the publication the guidelines have prevalence on the analogous regional disposition.
The Region and the local authorities had to adopt the guidelines 90 days after the publication. The most important contents are:
- Rules for transparency in administrative processes of the authorization phase. - Monitoring programmes and information to citizens.
- Rules for the authorization of connected infrastuctures, in particular the electricity grids. - The motions, the start and the implementation of the unique procedure of authorization are
identified.
- The criteria and the process of integration of wind farms in the landscape are defined (Annex IV).
1.3 Monitoring wind farms impact in Italy
In Italy the wind farm industry started in the second half of he ‘90s (Arsuffi & Arena, 2011). Italy has to ensure that 17% of the country’s electricity should be generated from renewable sources by 2020. In 2011 Italy was placed at the 7th place in the world with 6,936 MW in 807 wind farms installed in all the territory covering the 3% of total electricity production (Arsuffi & Arena, 2011). Because of its orography wind farms are mostly concentrated in the central-south regions of the Country.
Only in recent years have bats been considered in wind farm development projects and consequently in Evaluation Impact Assessment procedures in Italy, because as in the rest of Europe at the beginning the attention was concentrated mostly on birds. Unfortunately in our Country there are not scientific studies conducted even on birds and all data available are from reports and documents of environmental impact assessment based on studies conducted in USA, Canada and
Europe (i.e. Winkelman 1989; Phillips 1994; Band et al. 2005, 2007; Barrios and Rodrigues 2007). As consequence there are few information of the real impacts both on birds and bats.
Mortality data at existing wind farms are practically non-existent (Ferri et al. 2011) since monitoring of such sites is not obligatory. Only in recent years are starting the first monitoring programmes with many difficulties due to the complexity of the system and the related economic interests.
1.4 Cumulative impact
Because of the massive expansion of wind farm industry over much of Europe, impact assessment should also carefully look at cumulative regional impacts of wind farms on sensitive wildlife (Jaberg & Guisang 2001; Rodrigues et al. 2008; Jones et al. 2009).
Through cumulative impact it is possible to investigate impacts that are not detectable at local scale such as barrier effect or habitat loss. As research priority Rodrigues et al. (2008) and Jones et al. (2009) focus their attention on the fact that studies at local scale need to be put in a more general context able to investigate how a new planned facility could affect the area in relation to the other facilities present in the territory.
One of the expected products of large-scale impact assessments would also be the production of maps of high-risk areas which represent crucial tools to locate sites where wind farms cannot be planned or those where more survey efforts are needed to assess the actual impact likelihood (e.g. Cathrine & Spray 2009).
1.5 Project framework
Despite its importance, the assessment of cumulative impacts has so far been neglected. Although modelling represents a potentially powerful approach to achieve this goal, it has been mostly applied to address other conservation issues (Ficetola et al. 2007; Elith et al. 2006; Heikkinen et al. 2007; Rebelo et al. 2009; Zimmermann et al. 2010; Rebelo & Jones 2010; Bosso et al. in press). To date, it has been applied to predict mortality risks for bats only in one case-study, covering the whole Portugal (Santos et al. 2013). However, that model relies on the precise knowledge of bat mortality based on previous fatality reports. Monitoring programs for bat fatalities at wind farms have not been implemented in all European countries and can differ in the methods used for fatality surveys and in sampling effort across sites. Nevertheless, there are records of bat fatalities in more than 13 European countries, mainly in Germany, Spain, France and Portugal (EUROBATS, 2011). Most casualties in Europe involve tree and crevice roosting bats (Jones et al., 2009; Rydell et al., 2010; EUROBATS, 2011), yet little is known about the population sizes and
dynamics of these species. Nevertheless, the potential impacts of wind farms on some species such as N. leisleri may have population-level consequences (Jones et al., 2009).
In many countries such as Italy, data on bat mortality at existing wind farms are practically non-existent (Ferri et al. 2011) since monitoring of such sites is not obligatory, so producing risk maps using a mortality approach is unfeasible. In such cases, a pragmatic approach to assess the cumulative impact of regional wind farm planning and locate critical areas even in the absence of mortality data is crucial. Moreover, an alternative approach to mortality-based model may be given by assessing to which extent existing or new turbines are comprised within areas of high habitat suitability for bats, such as important foraging habitat, and evaluating the consequences at multiple spatial scales (habitat loss or alteration, changes in landscape connectivity, edge effect increase, etc.).
To address this issue we developed a regional scale analysis based on Species Distribution Models (SDM) built on presence data in an area in central Italy that is currently undergoing a large-scale development of wind farms.
We deliberately selected a regional rather than a national scale, since this is the geographical (and administrative) dimension at which wind farms development is planned and mitigation or compensation actions are done.
Because all bat species occurring in Italy are included in Annex IV of Habitat Directive 92/43/EEC and 13 of them feature in Annex II, the evaluation of cumulative impact also represents a tool to pursue the objectives set by the Natura 2000 program in Europe.
Wind farms impacts were evaluated in terms of habitat alteration and barrier effect. In the first phase of the project we decided to test the functionality of our idea developing SDMs for two species particularly affected by wind turbines impact N. leisleri and P. pipistrellus (Rodrigues et al. 2008; Telleria 2009) and to investigate the landscape pattern alteration produced by wind farms.
In a second phase encouraged by the results obtained for the two species we decided to investigate all the bat species present in the region particularly affected by wind turbines and to refine the SDMs considering environmental variables proxies for wind exposure and commuting ad migration routes. We refined also the modelling procedures using the last implementations on this aspect of research. We were interested in highlighting the best areas for all the species potentially highly impacted by wind farms and to develop a species richness map useful to point out the hot spot of bat species in the region to identify the most risky area. With the SDMs developed in this second phase we also developed the first attempt to study the barrier effect through connectivity procedures.
The rationale behind our analysis is that the presence of wind turbines will introduce potential alterations to foraging sites, commuting and migratory routes and landscape fragmentation. When
land use is profoundly changed by the presence of wind turbines, e.g. when the latter has required a forest patch to be cleared (in countries where this is allowed), the bat species associated with the disappeared habitat type will be directly affected by its loss. However, habitat alteration may still take place when apparently less dramatic changes occur. Even if prey availability remains unchanged we assume that the presence of wind turbines in a foraging site could alter its quality to a varying extent by altering the site’s spatial structure and by forcing – or according to some studies even attracting – bats to forage near wind turbines, increasing mortality risk and turning the site into an ecological trap (Battin 2004; Rodrigues et al. 2008; Weller & Baldwin 2011; Rydell et al. 2012).
Objectives
The specific objectives of our analysis were:
a) to produce risk maps by overlaying the foraging habitat maps with existing and planned wind farms locations;
b) to assess changes in the spatial pattern of foraging habitat determined by existing and planned wind turbines;
c) to combine SDMs to identify highly vulnerable areas where wind farm construction would be especially harmful to bats and should be avoided.
d) to investigate species specific connectivity and hot spot of migration routes e) to overlap corridors routes and wind farms
2
Methods
2.1 Study areaThe analyses were set in the Molise region (central Italy), an area of 443,758 ha, selected as a model because it is one of the Italian areas undergoing a massive increase in wind turbine numbers. Overall, 256 wind turbines are already operating in 28 wind farms, and 287 turbines are planned in the next future in 11 wind farms, giving a grand total of 39 wind farms and 543 turbines (Fig. 1).
Figure 1. Location of existing or planned wind farms in the Molise Region (central Italy) used for modelling the impact
2.2 Species distribution models
Models were developed using the maximum entropy algorithm Maxent 3.3.3k, a machine learning method that estimates the distribution of a species using presence data only (Phillips et al. 2004, 2006). This algorithm generally performs better than other similar techniques in predicting species distributions (Elith et al. 2006; Heikkinen et al. 2007), and it also works with small datasets (Phillips and Dudík 2008). It applies the maximum entropy principle to an ecological context (Jaynes 1957). This technique estimates the distribution probability in such a way as to satisfy a set of constraints derived from environmental conditions at species’ presence sites. These constraints impose that the expected value of each environmental predictor falls as close as possible to the empirical mean of that predictor measured over the presence records (Phillips et al. 2004, 2006; Elith et al. 2006). Between all the possible distributions that satisfy constraints, the algorithm chooses the closest to the uniform, maximizing the entropy (Phillips et al. 2004, 2006, Elith et al. 2006).
2.2.1. Presence data
Data were opportunistically gathered in 2010 and 2011 in the whole region at wind farms areas, at control areas as well as in the 2000 network site object of a study on management plans.
Data at wind farms and control areas locations were collected by Federica Roscioni using a bat detector in the time expansion mode (D240X bat detector - Pettersson Elektronic AB, Uppsala, Sweden). Data in 2000 network sites were collected by Danilo Russo and Luca Cistrone by direct ultrasound sampling (D1000X Pettersson bat detector – Pettersson Elektronik AB, Uppsala, Sweden).
Data were obtained by recording echolocation and social calls, and the occurrence of feeding buzzes was regarded as an evidence of bat foraging.
For species recognition we used the program BatSound 4.1. (Pettersson Elektronik AB, Uppsala, Sweden) to generate oscillograms, spectrograms and power spectra, selecting one to three echolocation calls per sequence. When social calls were present, they were used for identification too (Russo & Jones 2000; Russo et al. 2009). For time-expanded recordings we used a sampling frequency of 44.1 kHz, with 16 bits/ sample, and a 512 pt. FFT with a Hamming window for analysis. D1000X recordings were wave files generated with a sampling frequency of 384 kHz. Echolocation calls were identified by applying the classification functions described by Russo & Jones (2002). Further details about function performance and call measurements are given therein. Social calls were identified according to Russo & Jones (2000) and Russ (1999).
2.2.2 Environmental variables
We considered three map layers as proxies of environmental variables assumed to represent relevant ecological requirements of the foraging habitat of the two species (Russo & Jones 2003; Rodrigues et al. 2008), i.e. the Digital Terrain Model at 30m grid resolution (proxy for altitudinal range), the Corine Land Cover map (hereafter abbreviated as CLC) at IV and V levels of detail and 1:100,000 scale (proxy for vegetation types), hydrographic map 30m grid resolution (proxy for freshwater bodies).
In the first phase of the project to allow a good performance of the maximum entropy algorithm we converted the categorical layers CLC and hydrography in two continuous layers. Following Ficetola (2010) the categorical CLC map was converted through a focal statistics (Phillips 2006; Elith et al. 2006). Because computational load was too high for the whole CLC map only the suitable CLC categories were selected as input data for the focal statistics i.e., pastures (2.3.1), complex cultivation patterns (2.4.2), broad-leaved forests (3.1.1.), and inland water (5.1.1) (Fig. 2).
In the second phase we refined analyses.
From the Digital Terrain Model 30m resolution we first derived two layers proxies for the migratory (commuting and long migration) routes and for the wind: “slope” and “aspect” respectively.
We then selected the proper slope to be entered in the model first reclassifying it in different slope degrees from low to higher slope: slope 10; slope 20; slope 30; slope 40. Then the Euclidean distance from each slope was computed obtaining the following variables: euslope10, euslope20, euslope30 and euslope40. We then ran Maxent for each “euslope” variable and selected the slope that obtained the higher gain value in Maxent outputs. This information is a reliable measure of the most informative behavior of the variable. Euslope40 (distance from the maximum slope) obtained the higher gain and so resulted the variable to be used in the further implementation.
From “aspect” we computed the aspect north-south and the aspect east-west. These two variables gave information on the orientation of the mountains in relation to the wind. Also in this case we selected the most informative for our goals running Maxent and we obtained that aspect north-south gave more reliable information having the highest value of the gain in the simulation procedure.
CLC was used as a categorical layer because meanwhile the efficiency of Maxent software was improved even for categorical variables (Elith et al. 2011; Santos et al. 2013).
We decided to reclassify the CLC in order to have a non-redundant layer proxy for the most important categories for bats. We considered as a unique class the similar categories (Tab. 1, Fig. 3).
Table 1 Reclassification of CLC to obtain a categorical CLC with informative but not redundant categories for bats. X= variables selected for Euclidean distance function.
CLC categories Description New CLC categories Description Euclidean Distance
111 Continous urban fabric 1 Urban
112 Discontinous urban fabric 1 Urban
121 Industrial or commercial unit 1 Urban
122 Road and rail network and associated land 2 Infrastructure
123 Port areas 2 Infrastructure
131 Mineral extraction sites 2 Infrastructure
133 Costruction sites 2 Infrastructure
141 Green urban areas 1 Urban
142 Sport and leisure facilities 1 Urban
211 Non-irrigated arable land 3 Cultivation
221 Vineyards 4 Orchard
222 Fruit trees and berry plantations 4 Orchard
224 Other permanent culture 3 Cultivation
231 Pastures 6 Pastures
241 Annual crops with permanent crops 3 Cultivation
242 Complex cultivation patterns 7 Complex cultivation patterns X
243 Land principally occupied by agriculture, with significant areas of natural vegetation 8
Cultivation and natural
vegetation X
244 Agro-forestry areas 4 Orchard
311 Broad-leaved forests 9 Forests X
3116 Forest with prevalence of hygrophile species 10 Riparian forests X
312 Coniferous forests 11 Coniferous
313 Mixed forests 9 Forests
321 Natural grassland 12 Steppes
322 Moors and heathland 13 Scrubs
323 Sclerophyllous vegetation 13 Scrubs
324 Transitional woodland-scrub 13 Scrubs
325 Bushy woodland 13 Scrubs
332 Bare rocks 14 Bare ground
333 Sparsely vegetated areas 14 Bare ground
411 Inland marshes 15 Water X
421 Salt marshes 16 Salt
422 Salines 16 Salt
423 Interdital flats 16 Salt
511 Water courses 15 Water
512 Water bodies 15 Water
521 Coastal lagoon 15 Water
522 Esturaries 16 Salt
Figure 3 Reclassified Corine Land Cover used to develop the Maxent models for six species in the Molise region
(central Italy)
We maintained separated the riparian forests from the “new” category “forests” because of their high importance as proxies for commuting and migration routes (Waters et al. 1999; Russo & Jones, 2003).
We then computed the Euclidean distance from all those categories most important for foraging and migratory behavior i.e. olive groves (2.2.3; 5), complex cultivation pattern (2.4.2; 7), cultivation and natural vegetation (2.4.3.; 8), forest (3.1.1.; 9), riparian forest (3.1.1.6; 10), and water bodies (5.1.2.; 15) (Table 1).
In both phases the hydrographic map was transformed in a continuous layer by replacing the Euclidean distances of each pixel from any water course.
2.2.3. Wind farm location map
Wind farm locations of existing and planned turbines were supplied by the Environmental Department of the Molise Region. To evaluate the impacts caused by wind farms, we created a map containing the location of existing and planned turbines, each buffered at 150 m. Buffer size was defined considering the area of risk of collision and habitat loss around each turbine (Arnett et al. 2005; Rodrigues et al. 2008).
2.2.4 Species distribution models procedures
In the first phase of the project to develop the first attempt to investigate the cumulative impact through SDMs we selected two bat species already known by literature to be highly sensitive to wind farms, Leisler’s bat Nyctalus leisleri and common pipistrelle Pipistrellus pipistrellus (Jaberg & Guisang 2001; Arnett et al. 2005; Rodrigues et al. 2008). N. leisleri is a migrant species which usually flies at high altitudes (Waters et al. 1999); it is regarded as one of the most important bat species to be investigated in areas particularly affected by wind farms construction (Rodrigues et al. 2008). P. pipistrellus is known to be highly vulnerable to wind farms, especially in the southern part of Europe, particularly when foraging in areas where wind farms occur (Rodrigues et al. 2008; Telleria 2009). Such species are also good models since they are representative of different guilds, i.e. open space (N. leisleri) and edge (P. pipistrellus) foragers (Dietz et al. 2007).
To implement the Species Distribution Models we used 36 and 58 presence records collected in 2010 for foraging N. leisleri and P. pipistrellus respectively.
As environmental variables we entered in the Maxent algorithm the CLC categories obtained after the Focal Statistic procedure, the Euclidean distance from hydrography and the Digital Terrain Model (details in the previous paragraph)
We kept the default Maxent settings with the exception of “number of replicates” and “default prevalence”. We set the software to split randomly the occurrence data into two subsets with 70% of records used to train the model and remaining 30% used to evaluate its predictive power. This step was replicated 100 times, each time randomly selecting different 70% - 30% portions of occurrence data. The predictive power of the models was evaluated by calculating the area under the receiver operating characteristic curve (AUC) (Swets 1988), representing a measure of the capability of the model to discriminate between presence and background data (Phillips 2006). The value of “default prevalence” was set to 0.6 instead of 0.5 (default option), because the species are quite easy to detect in typical presence sites (Elith et al. 2011).
To assess the overall impact of wind farms on the two bat species, Maxent outputs were converted into binary maps (1 = suitable and 0 = non suitable), choosing as threshold the 10th percentile of the distribution of probability of occurrences (Phillips and Dudík 2008; Ficetola et al.
2007; Ficetola et al. 2009; Bosso et al. in press). The choice of a suitability threshold may have a great effect on the resulting probability map, and there is still no consensus on the ‘‘best’’ threshold to use (Liu et al. 2005; Jimenez & Lobo 2007). However, the 10th percentile threshold is commonly used because it is considered to offer a highly conservative estimate of a species’ tolerance to each predictor, considering the environmental complexity of the study area. This threshold may therefore provide a more ecologically significant result (Svenning et al. 2008; Jarnevich & Reynolds 2011).
The binary maps were then combined in order to identify foraging areas suitable for both species. To evaluate the foraging habitat alteration caused by wind farms, the resulting map was overlaid with that containing the location of existing and planned turbines, each buffered at 150 m.
In the second phase of the project we refined the SDMs considering new variables and a more complete dataset. We investigated all the species present in the region potentially impacted by wind farms development (Rodrigues et al. 2008, Telleria, 2009, Santos et al. 2013): Leisler’s bat (Nyctalus leisleri), common pipistrelle (Pipistrellus pipistrellus), Kuhl’s pipistrelle (Pipistrellus kuhlii), common serotine (Eptesicus serotinus), Savi’s pipistrelle (Hypsugo savii) and European free tailed bat (Tadarida teniotis).
As point locations we used all the data gathered in the region in 2010 and 2011: 160 locations for P. kuhlii, 121 for P. pipistrellus and H. savii, 96 for Eptesicus serotinus, 66 for T. teniotis and 56 for N. leisleri.
To have independence of the data to avoid the over-fitting of the models due to the spatial autocorrelation (Rangel et al. 2010; Merckx et al. 2011; Santos et al. 2013) we corrected the presence data using the “autocorrelation procedure” applying the “Average Nearest Neighborhood” function of ArcGis10. After this procedure we obtained 16 location points for N. leisleri and T. teniotis, 29 for P.kuhlii, P. pipistrellus and H. savii, and 21 locations for E. serotinus.
As environmental variables in addition to the Digital Terrain Model and the Euclidean distance from hydrography we entered the variables that took into account also proxies for wind exposure and migration routes: “euslope40” and aspect_north-south. For land cover we entered the reclassified CLC categorical map, the Euclidean distance form olive groves (2.2.3; 5), complex cultivation pattern (2.4.2; 7), cultivation and natural vegetation (2.4.3.; 8), forest (3.1.1.; 9), riparian forest (3.1.1.6; 10), and water bodies (5.1.2.; 15).
Also the modeling procedure was refined in accordance with the development on this field of research. We kept the default Maxent settings with the exception of “β regularization multiplier”, “number of replicates”, “default prevalence” and “maximum iterations”.
For the regularization parameter, only recently was created a procedure to select it objectively (Warren and Seifert 2011). We tested the values 0.5, 1.0, 1.5, 2.0, 2.5 using the model selection
function of the software ENMTOOLS (Warren et al. 2010 ). The best models, chosen using the corrected Akaike Information Criterion (AICc), were the ones for which β = 2.0.
We then set the software to split randomly the occurrence data into two subsets with 70% of records used to train the model and remaining 30% used to evaluate its predictive power. This step was replicated 50 times, each time randomly selecting different 70% -30% portions of occurrence data. The predictive power of the models was still evaluated by calculating the area under the receiver operating characteristic curve (AUC) (Swets, 1988; Phillips, 2006). The value of default prevalence was set to 0.6 instead of 0.5 (default option), because all the six species are quite easy to detect in typical presence sites (Elith et al., 2011). We used 1000 maximum iteration because at this number the models reached the more predictive power (Phillips et al. 2006), we obtained this information running the models at different maximum iterations settings.
To identify the “hot spot” for the presence of the species in Molise region and to prepare the layers for the connectivity analyses even in this second phase Maxent outputs were converted into binary maps (1 = suitable and 0 = non suitable), choosing as threshold the 10th percentile of the distribution of probability of occurrences (Phillips & Dudík 2008; Ficetola et al. 2007; Ficetola et al. 2009; Bosso et al. in press).
2.2.5 Landscape Pattern Analyses
Changes in landscape patterns following the overlay between SDMs and wind farms locations were explored with FRAGSTAT 3.3 Version (McGarigal & Marks 1995) considering three classes of suitable feeding areas: suitable for P. pipistrellus, suitable for N. leisleri, and suitable for both species.
After recording the extension of each class in hectares (CA), and the total number of patches (NP), we focused on four class metrics reported as ecologically meaningful (Riitters et al. 1995) and useful to describe habitat spatial pattern: Largest Patch Index (LPI), Mean Patch Size (AREA MN), Area Weighted Mean Shape Index (SHAPE AMN) and Aggregation Index (AI). NP, AREA MN and LPI metrics were selected because they are strongly related with habitat fragmentation (Forman 1995; Batistella et al. 2003) that is, the breaking up of one large area into many smaller patches (Forman and Godron 1986; Shafer 1990; Fahrig 2003). The largest patch index (LPI) quantifies the percentage of total landscape area comprised by the largest patch of the specific class and it decreases in fragmented landscapes (Batistella et al. 2003). The AREA MN is the average of the size in ha of all patches within each class, corresponding to the ratio between the total extension covered by each category and the number of patches in that suitability class; it decreases with landscape fragmentation. The SHAPE AMN measures the complexity of patch shape compared to a standard shape that in raster format attains its minimum value (SHAPE AMN=1) for squares and
increases for irregular and elongated shapes. We chose SHAPE AMN because of its ability to distinguish between big round shaped patches, characteristic of well-preserved habitats, and small irregular patches, which often dominate in disturbed landscapes (for a review see Haines-Young and Chopping 1996). AI describes the adjacencies of habitat “cells” (He et al. 2000) and ranges between 0, when habitat distribution is maximally disaggregated (no adjacencies between cells of the same class) to 1, when the landscape is totally covered by bat’s foraging habitat. AI may be used to describe habitat connectivity (Rutledge 2003).
Finally, considering the important role of forests as roosting and foraging habitat for bats (Grindal & Brigham 1999; Waters et al. 1999; Morris et al. 2010; Russo et al. 2010) we overlaid the map of forests (extracted from the CLC map) with the binary suitability combined map and computed the number of wind turbines comprised within a 150m range of influence using the buffer distance function of ArcGis 10. Rodrigues et al. (2008) regarded a minimum distance of 200 m of wind turbines from forest edges as safe for bats, so any forest edge laying within 150 m of a wind turbine as a case of significant interference.
2.2.6 Connectivity analyses
To provide information on barrier effect provoked by wind farms we developed a connectivity map for N. leisleri using the software UNICOR (Landguth et al. 2012).
We selected N. lesleri because of its migrant behavior and because it is one of the most impacted bat species by wind farm development (Rodrigues et al.2008, Jonest et al. 2009) and it is object of particular conservation programs in EUROBATS protocols (Rodrigues et al. 2008, Battersby, 2010), the international bat agreement for the conservation of bats in Europe.
UNICOR uses a resistant kernel approach for predicting habitat connectivity and corridor paths for the given resistance surface as conducted by Compton et al. (2007). Resistant kernel connectivity modeling has a number of advantages as a robust approach to assessing population connectivity for multiple wildlife species. Unlike most corridor prediction efforts, it is spatially synoptic and provides prediction and mapping of expected movement rates for every pixel in the study area extent, rather than only for a few selected “linkage zones” (Compton et al. 2007). It is computationally efficient, enabling simulation and mapping across vast geographical extents for a large combination of species (e.g., Cushman et al. 2010b). The resistant kernel approach to connectivity modeling uses the framework of the modified Dijkstra’s algorithm. Instead of calculating one shortest path derived from source-to-source nodes, the resistant kernel approach builds a least-cost dispersal around each source cell. Each source cost map is then inverted and scaled with a given transformation function, such that the maximum value for each individual kernel is one. Once the expected density around each source location is calculated, the kernel maps
surrounding all sources are summed to give the total expected density at each location on the landscape. The results of the resistant kernel approach are surfaces of expected density of dispersing individuals at any location in the landscape.
UNICOR requires two input files as the first step: 1) a landscape resistance surface and 2) point locations for each population or individual’s location.
In the resistance surface each cell value (pixel) represents the unit cost of crossing each location. Pixels are given weights or ‘ resistance values ’ reflecting the presumed influence of each variable to movement or connectivity of the species in question (Dunning et al. 1992, Cushman et al. 2006, Spear et al . 2010). Resistance surfaces can be parameterized to reflect different costs to movement associated with vegetation types, elevation, slope, or other landscape features.
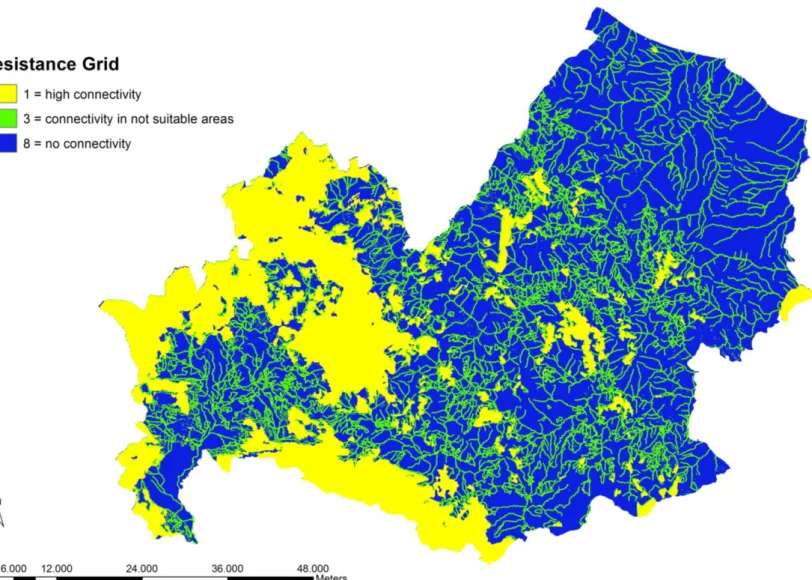
We created a resistance surface (Fig. 4) considering five variables: two obtained by the modeling procedure (Maxent algorithm), the suitable areas with low resistance value and the not suitable areas with high resistance value; and three important variable for bat movement such as slope, forest edges and hydrography all proxies of linear features important for commuting and migration routes (Waters et al. 1999; Russo et al, 2003; Morris et al. 2010). At these variables we gave value 1 (low resistance) when present in the suitable areas for the species and value=3 (medium resistance) when present in not suitable area for the species.
Figure 4. Resistance surface. 1= high connectivity, suitable areas of the model and slope, forest edges, hydrography in
suitable areas; 3 = connectivity in not suitable areas, slope, forest edges and hydrography; 8 = no connectivity, not suitable areas.
The point locations were extracted by the suitable areas of the binary model obtained by the second phase modeling implementation. We extracted randomly 50 points and we repeated the extraction for 10 times in order to obtain 10 random dataset of point locations. We run UNICOR with each data set (10 UNICOR run). We then summed the UNICOR output obtaining a connectivity map that was reliable of the randomization procedure.
To evaluate the potential barrier effect we then overlaid the wind turbines locations buffered 150m to the connectivity map to point out if they encountered the potential migratory routes. For each wind farm that fell in the migratory routes we estimated the number of connectivity path encountered and the associated risk.
3 Results
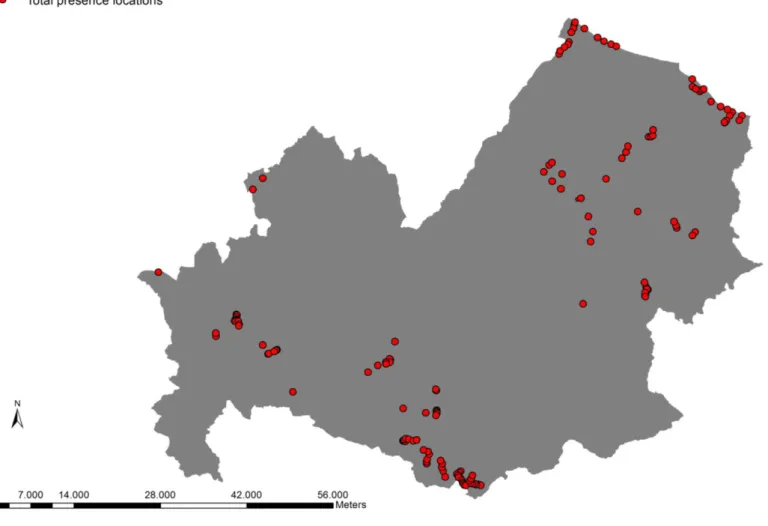
Fig. 5 shows the total presence locations of the bat species gathered in wind farm areas, control areas and in 2000 network sites in the Molise region during 2010 and 2012.
From Fig 6 to Fig. 11 are presented the species specific presence locations.
a)
b)
Figure 6. Species specific presence location in Molise region (Central Italy) for a N. leisleri: a) total presence locations
a)
b)
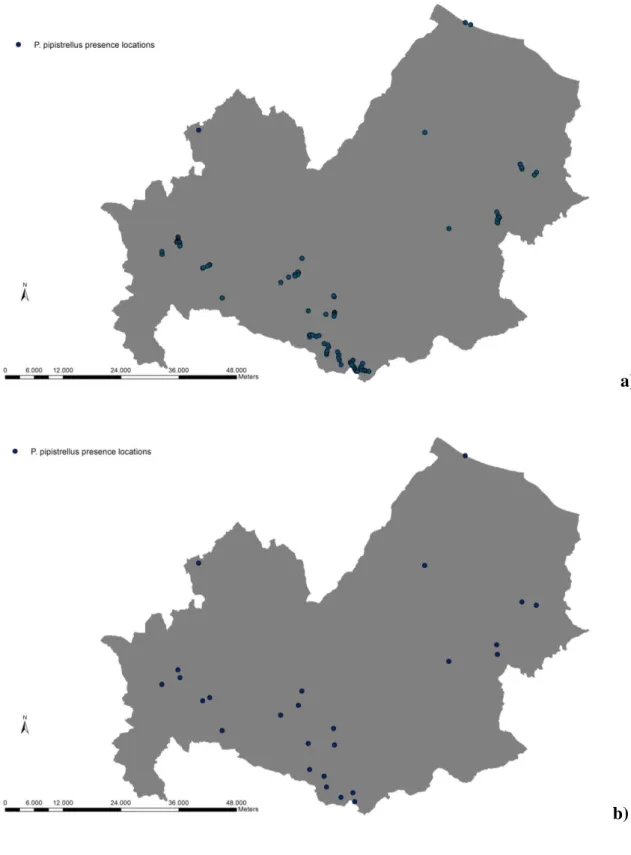
Figure 7. Species specific presence location in Molise region (Central Italy) for a P. pipistrellus: a) total presence
a)
b)
Figure 8. Species specific presence location in Molise region (Central Italy) for a P. kuhlii: a) total presence locations
a)
b)
Figure 9. Species specific presence location in Molise region (Central Italy) for a H. savii: a) total presence locations
a)
b)
Figure 10. Species specific presence location in Molise region (Central Italy) for a E. serotinus: a) total presence
a)
b)
Figure 11. Species specific presence location in Molise region (Central Italy) for a T. teniotis: a) total presence
N. leisleri was less abundant and its presence was concentrated only in certain areas of the acoustic stations (Fig 6a).
P. pipistrellus, P. kuhlii, H. savii and E. serotinus were recorded at the majority of the acoustic stations (Fig. 7a, Fig. 8a, Fig. 9a, Fig. 10 a).
T. teniotis was observed with a discontinuous pattern in the acoustic stations (Fig. 11a).
Fig 6b, 7b, 8b, 9b, 10b and 11b showthe results of the autocorrelation analyses used to avoid the overfitting in the model procedures.
3.1 Impact assessment at landscape scale. 3.1.1. Species distribution models
The Species Distribution Model for Nyctalus leisleri was supported by a 0.83 AUC value; the species’ probability of presence in the whole region ranged from 0 to 0.86. The SDM showed that 42% of the regional territory is suitable for N. leisleri, and that suitable areas are concentrated in the western part of the region (Fig.12).
For P. pipistrellus we obtained a 0.80 AUC and a probability of presence of 0-0.86. P. pipistrellus foraging habitat covers 50.1% of the regional territory and as for N. leisleri it is concentrated in the western area (Fig.13).
Figure 13. Foraging habitat distribution model for P. pipistrellus in the Molise Region as identified by a MaxEnt
analysis
Figure 14 shows the maps derived from the conversion of the Maxent outputs into binary maps using as threshold the 10th percentile of the distribution of probability of occurrence: 0.26 for P. pipistrellus (Fig. 14a) and 0.19 for N. leisleri (Fig. 14b). The foraging areas suitable for both species represent 41.1% of the regional territory (Fig. 14c), while only 0.5% was suitable only for N. leisleri and 18.2% for P. pipistrellus (maps not shown).
Figure 14. Suitable foraging habitat for P. pipistrellus (a), N.leisleri (b), and both species together (c) in the Molise
region obtained by converting into binary map the Maxent outputs using the 10th percentile threshold
The 150m-radius circular buffer around each turbine overlaid to the combined SDM (Fig. 15) revealed that 66.7% of existing turbines and 51.5% of planned turbines were comprised within suitable feeding areas for both species, causing the alteration of 699ha and 1,092ha of foraging areas respectively.
Figure 15. Risk map for N.leisleri and P. pipistrellus developed for the Molise Region. 150m-radius buffers were
traced around turbine sites and overlaid to the combined foraging habitat maps fot the two species. Such maps were produced by merging the binary maps obtained by the reclassification of Maxent output considering the 10th percentile threshold.
3.1.2 Landscape pattern analyses
Landscape pattern analyses carried out on the three binary maps showed a change of all indices when wind turbines were added (Table 2).
The number of patches (NP) and Shape AMN indices showed that wind farms produced an increase in the number of habitat patches and in the complexity of patch shape (Table 2). Although mean patch size decreased as a consequence of both existing and planned wind farms, LPI index highlighted that the largest patches continued to represent the main component of the overall foraging area (Table 2).
Table 2. Modelled variation of landscape indices on a regional scale determined for the Molise region (central Italy) for
two target bat species, Pipistrellus pipistrellus and Nyctalus leisleri. Variations were calculated separately for existing wind farms as well as for both existing and planned ones. CA= Class Area, NP = number of patches, LPI = Largest Patch Index, Area MN = mean patch size, SHAPE AMN = area weighted mean shape index, AI = Aggregation index. See text for definitions.
Index Species no wind farms
% variation existing wind farm
% variation existing +
planned wind farms
CA (ha) P. pipistrellus 22,8007.04 -0.70 -1.00
CA (ha) N. leisleri 18,8803.84 -0.65 -1.00
CA (ha) Both species 17,6754.40 -0.69 -1.06
NP P. pipistrellus 103 +7.76 +12.62
NP N. leisleri 174 +4.02 +7.47
NP Both 169 +4.14 +7.69
LPI (%) P. pipistrellus 44.85 -0.67 -1.00
LPI (%) N. leisleri 34.69 -0.55 -0.94
LPI (%) Both species 32.17 -0.59 -1.02
Area MN (ha) P. pipistrellus 2,213.6 -7.86 -12.09
Area MN (ha) N. leisleri 1,085.0 -4.49 -7.88
Area MN (ha) Both species 1,045.88 -4.49 -8.12
Shape AMN P. pipistrellus 8.75 +8.50 +12.11
Shape AMN N. leisleri 6.41 +7.29 +11.89
Shape AMN Both species 7.30 +6.59 +10.73
AI (%) P. pipistrellus 99.11 -0.08 -0.12
AI (%) N. leisleri 99.11 -0.07 -0.11
AI (%) Both species 98.91 -0.08 -0.12
The 150-m radius considered around all turbines to assess the degree of interference with forest edges showed that for 13% of existing turbines and 21% of the total (planned + existing) turbines such buffers overlap with forest edges, respectively affecting 2660,67ha and 3141,68ha of forest.
3.2. Hot spots, connectivity and barrier effect 3.2.1. Species distribution models
The Species Distribution Model developed for Nyctalus leisleri, Pipistrellus pipistrellus, Pipistrellus kuhlii, Eptesicus serotinus, Hypsugo savii and Tadarida teniotis obtained AUC values > 0.80. The models for Nyctalus leisleri, Pipistrellus pipistrellus, Hypsugo savii and Eptesicus serotinus were supported by a 0.87 AUC value. The model for Pipistrellus kuhlii was supported by a 0.82 AUC value. The model for Tadarida teniotis was supported by a 0.80 AUC value.
Although the Tadarida teniotis model was significant it did not predict the foraging and migratory behavior of the species and consequently it was not used in the further analyses.
For the other species we obtained reliable results showed in Fig. 16.
Figure 16. Foraging habitat,model for a) N.leisleri; b) P. pipistrellus; c) P.kuhlii; d) H.savii; e) E. serotinus as identified
Fig. 17 shows the binary maps used to determine the species richness of species in the region and to implement connectivity analyses for N. leisleri, obtained by the reclassification of the Maxent outputs considering as threshold the 10th percentile of the distribution of probability of occurrence.
Figure 17. Suitable foraging habitat for a) N.leisleri; b) P. pipistrellus; c) P. kuhlii; d) H. savii; e) E. serotinus in the
Molise region obtained by converting into binary map the Maxent outputs using the 10th percentile threshold
P. kuhlii is the species that present the highest suitability in the region with 49,91% of the territory suitable for foraging and migrating. The presence of the species is uniformly distributed (Fig. 17c). We obtained similar results for E.serotinus in fact also in this case we have a homogeneous presence of the species in the territory with 49,33% of suitable foraging and migrating habitat (Fig.17e).
For P. pipistrellus we obtained that 39,45% of the region is suitable for foraging and migrating but in this case the suitability is mostly concentrated in the western part of the region (Fig.17b) even if its presence is predicted also in the “basso Molise”.
For H. savii the suitable habitat cover the 32,53% of the regional territory and its presence is uniformly distributed (Fig.17d).
For Nyctalus leisleri the suitable areas are less abundant (25,59%) and mostly concentrated in the western part of the region (Fig.17a).
In Fig. 18, Fig. 19 and Table 3 are presented the results of the combined model for all the species obtained merging together the binary maps in order to point out the “best areas” of species richness in the Molise region.
Figure 18. Species richness map: combined model for the five species Nyctalus leisleri, Pipistrellus pipistrellus,
Pipistrellus kuhlii, Hypsugo savii, Eptesicus serotinus, developed merging the five maps obtained by converting into binary map the Maxent outputs using the 10th percentile threshold
Figure 19. Species association map descriptive of the different association of bat species in the Molise region (central
Italy) developed merging the five maps obtained by converting into binary map the Maxent outputs using the 10th percentile threshold and evidencing the different association patterns of the species in the region.
Table 3. Percent habitat suitability modelled for the five target species Nyctalus leisleri, Pipistrellus pipistrellus,
Pipistrellus kuhlii, Hypsugo savii, Eptesicus serotinus, in the combined model obtained by the merge of the binary species specific maps.
Species % suitability Number of species No species 19.18 0 N.leisleri 10.97 1 P. pipistrellus 2.30 1 N.leisleri+P. pipistrellus 4.27 2 P.kuhlii 5.13 1 N.leisleri+P.kuhlii 0.07 2 P.pipistrellus+P.kuhlii 2.03 2 N.leisleri+P.pipistrellus+P.kuhlii 0.17 3 H.savii 0.70 1 N.leisleri+H.savii 0.06 2 P.pipistrellus+H.savii 0.71 2 N.leisleri+P.pipistrellus+H.savii 0.33 3 P.kuhlii+H.savii 2.61 2 N.leisleri+P.kuhlii+H.savii 0.02 3 P.pipistrellus+P.kuhlii+H.savii 2.31 3 N.leisleri+P.pipistrellus+P.kuhlii+H.savii 0.05 4 E.serotinus 5.46 1 N.leisleri+E.serotinus 1.48 2 P.pipistrellus+E.serotinus 0.61 2 N.leisleri+P.pipistrellus+E.serotinus 2.84 3 P.kuhlii+E.serotinus 7.31 2 P.kuhlii+P.pipistrellus+E.serotinus 3.65 3 N.leisleri+P.kuhlii+E.serotinus 0.15 3 N.leilseri+P.pipistrellus+P.kuhlii+E.serotinus 1.86 4 H.savii+E.serotinus 0.23 2 N.leisleri+H.savii+E.serotinus 0.02 3 P.pipistrellus+H.savii+E.serotinus 0.48 3 N.leisleri+P.pipistrellus+H.savii+E.serotinus 0.68 4 P.kuhlii+H.savii+E.serotinus 7.00 3 N.leisleri+P.kuhlii+H.savii+E.serotinus 0.12 4 P.pipistrellus+P.kuhlii+H.savii+E.serotinus 14.70 4 N.leisleri+P.pipistrellus+P.kuhlii+H.savii+E.serotinus 2.50 5
Only a small percentage of the regional territory is not suitable for the presence of the bat species considered (Tab. 3, Fig. 18, Fig. 19). The 24.56 % of the region is occupied by single species (Tab.3, Fig.18) mostly concentrated in the western part of the region. The 19.38% of the territory is occupied by two species homogenously distributed (Tab.3, Fig. 18). The 16.97% of the region is occupied by three species homogenously distributed (Tab. 3, Fig. 18). The 17.41% of the region is occupied by four species (Tab. 3) and it is principally localized in the western part of the region even if it extends also in the Biferno valley (Fig. 18, Fig. 19). The area occupied by the five species together is not very high (Tab.3) and it is mostly concentrated in the western part of the region (Fig.18, Fig. 19).
3.2.2 Connectivity analyses
Fig. 20 shows the connectivity for N. leisleri. Many migratory routes are concentrated in the western part of the Molise region in accordance with its presence in the territory. We evidenced four likely “corridors”: the blue lines that connect the western part of the region with the south-eastern area (Fig. 20). Our analysis was conducted at high resolution: 40m.
Figure 20. Connectivity map for N.leisleri as identified by UNICOR analyses. Blue lines point out the most important
corridors.
Many wind farms have a high barrier effect impact. In Fig.21 we show one of the most impacting existing wind farms (Ripabottoni, Edison S.p.A.) with near a planned one (Morrone del Sannio, Energie s.r.l.) which construction has to be avoided.
Figure 21. Example of most impacting wind farms: the existing “Ripabottoni” Edison S.p.A. and the planned “Morrone
del Sannio” Energie s.r.l., as identified by the overlay of the 150m buffered wind farms with the potential migratory routes of N. leisleri in the Molise region.
Morrone del Sannio wind farm is a planned facility of 7 turbines. 647 m of high connectivity routes encounter 4 wind turbines. 2 wind turbines are placed in 196 m of medium connectivity and 2 wind turbines encounter 230m of low connectivity routes.
Ripabottoni wind farm is an existing wind facility of 26 turbines. 743m of high connectivity routes encounter 6 turbines and 575 m of low connectivity routes encounter 5 turbines.
3.3 Wind farms and related impacts
Table 4 shows the relative impact of each wind farm in relation to landscape pattern and connectivity analyses.
Table 4. Detailed impacts per wind facility in terms of Landscape Pattern alteration and Barrier effect
Wind Farm Company Existing Planned N wind turbines Impact on Landscape Pattern Alteration Barrier effect
Capracotta Longano eolica s.r.l. x 16 x x
Vastogirardi Erga gruppo Enel x 18 x x
San Pietro Avellana
Enel-Cesi
x 12 x x
Pietrabbondante Laut engineering s.r.l. x 13 x x
Carpinone Solcesi s.r.l. x 11 x x
Frosolone Erga gruppo Enel x 19 x x
Frosolone Enel x 8 x x
Macchiagodena Erga gruppo Enel x 19 x x
Montaquila Laut engineering s.r.l. x 16 x x
Monteroduni Tisol s.r.l. x 20 x x
Monteroduni-S. Agapito
Tisol s.r.l.
x 22 x
Castelpizzuto Edison energie x 21 x x
Roccamandolfi De.Di s.r.l. x 20 x
Longano Longano eolica s.r.l. x 18 x x
Roccamandolfi Erga gruppo Enel x 12 x x
Cantalupo del Sannio De.Di s.r.l. x 11 x Cerce picolla- S.Giuliano-Vinchiaturo SBS Power s.r.l. x 16 x x San Giovanni in Galdo Icq x 18 x Campolieto Erga x 7 x
Lucito Edison energie x 17 x x
Monterosso Enel divisione GEM x 5 x x
Acquaviva-Collecroce Triolo 1 x 11 Morrone del Sannio Anemon x 7 x x
Ripabottoni Edison energie x 30 x x
Castellino Comune di Castellino x 1
Monacilioni IVPC6 s.r.l. x 16 x x Monacilioni IVPC6 s.r.l. x 4 x Pietracatella IVPC6 s.r.l. x 18 x Macchia Val Fortore IVPC6 s.r.l. x 12 x S. Elia a Pianisi “Colle delle Brecce” Inergia S.p.A. x 7 x x Bonefro Sorgenia x 4 x S. giuliano di Puglia Inergia S.p.A. x 16 x x S. Croce di Magliano API x 11 Montelongo-Montorio dei Frentani Rotello Power Calabria x 21 x
Rotello Loritello wind s.r.l. x 15
Ururi New energy group x 13
San Benedetto Sorgenia S.p.A. x 6
San Martino in Pensilis
New Green Energy
In relation to landscape pattern alteration we evidenced all the wind farms that fell in suitable foraging habitat for the species. In relation to connectivity we evidenced the wind farms that encountered high connectivity routes (blue lines in Fig. 15), we did not consider medium and low connectivity.
14 existing and 6 planned wind farms impact both in term of landscape pattern alteration and barrier effect (Tab.4).