AUTHOR
PROOF
COPY
Not f
or
publica
tion
O r i g i N a l r e s e a r c hopen access to scientific and medical research Open access Full Text article
Building a new rasch-based self-report
inventory of depression
Michela Balsamo1 giuseppe giampaglia2 aristide saggino1
1DisPUTer, Department of
Psychological sciences, humanities and Territory, “g d’annunzio” University, chieti-Pescara, italy;
2Department of economics and
statistics, “Federico-ii” University, Naples, italy
correspondence: Michela Balsamo Dipartimento di scienze Psicologiche, Umanistiche e del Territorio, Università “g d’annunzio”, chieti-Pescara, via dei Vestini 30, 66100, chieti, italy Tel/Fax +39 0871 355 5309 email [email protected]
Abstract: This paper illustrates a sequential item development process to create a new self-report
instrument of depression refined with Rasch analysis from a larger pool of potential diagnostic items elicited through a consensus approach by clinical experts according to the latest edition of the Diagnostic and Statistical Manual of Mental Disorders criteria for major depression. A 51-item pool was administered to a sample of 529 subjects (300 healthy community-dwelling adults and 229 psychiatric outpatients). Item selection resulted in a 21-item set, named the Teate Depression Inventory, with an excellent Person Separation Index and no evidence of bias due to an item–trait interaction (χ2=147.71; df =168; P=0.48). Additional support for the
unidi-mensionality, local independence, appropriateness of the response format, and discrimination ability between clinical and nonclinical subjects was provided. No substantial differential item functioning by sex was observed. The Teate Depression Inventory shows considerable promise as a unidimensional tool for the screening of depression. Finally, advantages and disadvantages of this methodology will be discussed in terms of subsequent possible mathematical analyses, statistical tests, and implications for clinical investigations.
Keywords: depression, scale development, self-report scales, Rasch analysis
Introduction
Depression is one of the most clinically relevant psychiatric disorders, and many assessment instruments have been developed to measure it. If left unrecognized and untreated, depressive disorders may result in the onset of physical, cognitive, and social impairment,1–4 as well as increased health care utilization and elevated societal
costs.5,6 Thus, assessing the severity of depression is an important challenge that both
clinicians and health assessment researchers face.7 Self-report measures may provide
time-saving tools to screen for the presence of, and discrimination between, different levels of depression.8 According to Nezu’s9 rating, the self-rating scales of depression
with both high clinical and research utility are the Self-Rating Depression Scale of Zung, the Center for Epidemiological Studies Depression Scale (CES-D), and the Beck Depression Inventory-II (BDI-II).10–13 These established measures, developed
according to classical test theory (CTT), have shown some psychometric limitations, mainly inherent in the theory assumptions.14–20 First, their traditional method of
scoring (ie, to compute a raw total score by summing responses to individual items), by weighing each item equally, assumes that each item or symptom on the scale represents a comparable level of psychiatric severity, so that a score of 4 (always) could be obtained for endorsement of “suicidal thoughts” but also for endorsement of “feeling blue,” although feeling blue should be considered a “less severe” item on
Number of times this article has been viewed
This article was published in the following Dove Press journal: Neuropsychiatric Disease and Treatment
the spectrum, whereas suicidal thoughts is clearly a “more severe” symptom.21–25
Second, the comparison of total scores between different populations assumes that each item has identical properties across samples. Whether items are equally effective across different samples is debatable. Items that reliably discriminate between high and low levels of depression in psychiatrically ill patients may not be equally effective in assessing severity of depression in medically ill patients. The sample-dependent psychometric characteristics of these depression instruments might aggravate the comparison of results across different samples or studies.23
Third, the total score method assumes that each symptom on the scale is equally related to the construct of interest. The violation of this assumption is also easy, as the use of factor analytic methods to determine latent structure in psy-chopathology research may mask the presence of a general, second-order, psychological distress factor.26,27
In the aforementioned depression instruments, the uni-dimensionality has been found lacking because some items related to a different latent trait, such as physical illness, were included.12,18,19,28–31 Thus, the use of a single summed
score might obscure the distinct dimensions encased within it and result in its unclear interpretation. Accordingly, two individuals with the same total score might differ in terms of the relative severity and frequency of different components of depressive symptomatology. Under these conditions, any effects of an intervention targeting only one of these aspects would be harder to detect.
Fourth, the scoring method of the aforementioned CTT-based depression measures assumes that the distance that separates each pair of adjacent categories of the underlying construct is equal in each item and the response scale for each item (eg, five-point Likert scale) functions as intended, although no techniques for evaluating this assumption is provided. Violation of this assumption could lead to mis-inference of the findings deriving from these instruments. Considering a five-level rating scale: never, almost never, often, sometimes, and always (scored 0, 1, 2, 3, and 4, respec-tively), a reduction from category 2 to category 0 represents a greater relief than a change from category 2 to category 1, but not necessarily twice as much. These numbers indicate only an ordering relationship and cannot be considered as measures.32–35 Often, however, sophisticated parametric
analyses, such as change scores, or parametric effect sizes, are performed on scores obtained on these ordinal scales.32–34
In addition, several authors have criticized some of the depression measures for being lengthy, laborious, and
exhausting for patients, especially when applied repeatedly in order to track changes.36–39 For example, the BDI-II includes
21 depressive symptoms, each of which is represented by four items with increasing severity. Thus, a total of more than 80 statements have to be processed. This can pose an excessive demand for severely depressed patients and result in reduced clinical efficiency. Further problems may arise on content grounds. For example, the CES-D and the BDI-II contain items tapping various types of anxiety. The inclusion of the nondepression-related content might contribute to the discriminant validity problems, unnecessarily enlarge test burden, and reduce their specificity for clinical depression substantially.17,20,40
Alternative psychometric models, such as the Rasch measurement model,41 have been found to offer a useful
approach to addressing some drawbacks of the CTT-based instruments and to develop new assessment measures to use in psychiatric settings.19,23,42–46 The Rasch model allows the
assessment of the performance of each individual item rather than the total score, as in CTT, on the basis of the assump-tion that the probability of endorsing any response category to an item is given by a logistic function of the difference between a person’s ability (in this case, a patient’s depression level) and item difficulty (in this case, the level of depres-sion expressed by the item).41 From the observed answering
patterns, the parameters of items and patients are calculated separately to produce estimates that are sample and item independent. In other words, item parameters are assumed to be independent of the respective sample: ie, the difficulty of items must not be influenced by subgroups like sex or age.47,48
Rasch analysis proposes an ideal underlying dimension based on mathematical and theoretical reasoning about the construct that is being measured and then assesses the extent to which actual data correspond to this ideal by a series of fit statistics. These statistics examine the comparison between the theoretical item performance (ie, individuals who are more severely depressed should endorse a high category of an item, or items that imply a higher level of depression should be mostly chosen by those who have more severe levels of depression) and the observed data.49 If the data fit
the model, then the sum score can be taken as a reasonable estimator of a person’s trait of depression. Thus, the main strength of the Rasch model over the CTT is to determine whether the data are consistent with the axioms of conjoint measurement, so providing a transformation of the raw ordi-nal score into true interval scaled data (using the log-odds unit, or logit) and opening up valid parametric approaches given appropriate distributions.27,46,50–58 In addition, by using
the Rasch model it is possible to identify a core set of items with proven psychometric qualities, along with making rating scheme changes that would allow consistent assessment of the severity of depression, which provides a foundation for a brief and reliable scale.18,23,59–62 Furthermore, other issues,
such as category ordering (whether the categories of an item work as expected) and item bias, or differential item function-ing (DIF), may also be addressed.63
In sum, the properties of the Rasch model (ie, unidimen-sionality, local independence, invariance) provide benefits resulting in an instrument that improves measurement pre-cision and performs in a stable manner across settings and populations compared with CTT-based measures. Indeed, what we lack in the assessment of depression is an objec-tive measure of the uniqueness of a particular individual’s depression, so that individuals with the same total score will exhibit the same depressive symptom profiles. Some Rasch-based measures of depressed mood are already in existence,64–66 and computer adaptive tests have been utilized
as well.67–70 However, to our knowledge, there have been no
attempts at selecting items for developing a completely new depression mood measure on the basis of the principles of the Rasch model.
Purpose of the study
The present study aimed at applying Rasch analysis to the item selection for a new self-report instrument of depression from a larger pool of potential diagnostic items elicited through a consensus approach by clinical experts according to the Diagnostic and Statistical Manual of
Mental Disorders, Fourth Edition, Text Revision
(DSM-IV-TR) criteria for a major depressive episode (MDE).71
Psychometric properties of a newly created measure were analyzed within the framework of the Rasch measurement model.
A core set of items with proven psychometric qualities for assessing depression severity along a single dimension was expected to emerge by administering a larger pool of items to clinical and nonclinical samples. Items reflecting commonly occurring and less severe levels of depression were expected to yield the highest level of endorsement by the nonclinical sample. Less frequently endorsed, interme-diate levels of depression mood were expected to appear toward the middle of the logit scale, and the least commonly occurring, most severe forms of depressive symptoms were expected to appear at the high end of the logit scale, to the extent that they yielded the highest level of endorsement by the psychiatric patients.
Finally, advantages and disadvantages as compared with the use of ordinal scores will be discussed in terms of sub-sequent possible mathematical analyses, statistical tests, and implications for clinical investigations.
Method
Measures
Teate Depression item Pool
The Teate Depression Item Pool, which constitutes the start-ing pool of items to be subjected to the Rasch analysis, was created in a four-step process:
1. Generation of the preliminary item list. The DSM-IV-TR MDE was chosen as prototypical for representing a clinically significant depressive syndrome, and its nine diagnostic criteria served as “generating criteria” for eliciting items.71–73 It should be noted that in the new
version of the DSM (DSM-V), the MDE criteria have remained totally unchanged.74 Five experts (psychiatrists
and psychotherapists; mean clinical experience 26.02±7.4 years) were asked to formulate simple and direct state-ments, similar to the typical verbal descriptions of their depressed patients, and both negatively (ie, representing the presence of depression) and positively (ie, in the opposite direction, representing its absence) worded. A total of 152 items were generated.
2. Rating of the initial item pool. Five independent clini-cians (psychiatrists and psychotherapists; mean clinical experience 21.57±4.8 years) were provided with a list of 152 items generated in the first step, and were asked to evaluate the correspondence between each item and the DSM-IV-TR diagnostic criterion from which it was elic-ited by using a five-point Likert scale ranging from 0 “not at all corresponding” to 4 “extremely corresponding.” Only the items with the mean score closer or higher to the midpoint of the range (ie, 2.5) were retained. On the basis of these judgments, 41 items were deleted. We added the instructions and the response format. Respondents were required to rate each item on a five-point Likert scale from 0 “always” to 4 “never.” The individual items measure how much of the time the symptoms have been present over the last 14 days, in order to be consistent with the DSM-IV-TR criteria for MDE.
3. Refinement of the initial item pool. Five psychometrists (mean experience 16.02±5.6 years in the field of clini-cal assessment) rated independently the 111 items that survived the previous step in terms of the degree to which they clearly and unambiguously represented any depressive symptom and adhered to the proposed
response format.75 Each item was retained only if it
reached at least 2.5 as an average score on a five-point Likert scale ranging from 0 “not at all adequate” to 4 “extremely adequate.” Fifty-seven items were dropped. Finally, the order of 54 items was randomized.
4. Item comprehensibility examination. Twenty nonclinical subjects (50% females; mean age 33.14±10.58 years) and 20 outpatients (50% females; mean age 34.35±5.25 years) with various psychiatric diagnoses were asked to read each item and evaluate its comprehensibility. Following their suggestions, three items were removed and four reformulated. The final item pool consisted of 51 statements, 36 negatively and 15 positively worded, with at least five items assessing each DSM-IV-TR diag-nostic criterion for the MDE.
general neuropsychiatric interview
The assessment was made by a general semistructured interview assessing for Axis I isorders outlined by the DSM-IV-TR. In the clinical sample, such diagnoses were confirmed by clinical DSM-IV-TR diagnoses assigned by a staff psychiatrist.
Participants
A total of 529 subjects participated in the study. All partici-pants were recruited between January 2005 and November 2006. They participated on a voluntary and anonymous basis, received no honorarium for completing the assessment, and provided written informed consent. The study design was approved by the local Institutional Review Board. The ana-lyzed overall sample was divided into clinical and nonclinical subsamples to allow for evaluation of the performance of the items across different samples.
clinical sample
The clinical sample was composed of 229 (females =147, 64.2%; males =82, 35.8%) psychiatric outpatients. Their average age was 33.95 years (standard deviation [SD] =10.33; range: 18–66 years), and their average education was 12.43 years (SD =3.35; range: 1–24 years). Inclusion criteria for the clinical sample were: 1) a current diagnosis according to the DSM-IV-TR criteria;71 2) possible presence of treatment with antidepressant
drugs and/or psychotherapy for not more than 2 months; and 3) age 17 years or older. Exclusion criteria included the presence of any condition affecting the ability to take the assessment, such as: 1) severe medical diagnoses, 2) any major disorder of the central nervous system, 3) current florid psychotic symptom, and 4) refusal of informed consent.
The patients included in this sample were diagnosed as follows: 46.3% (N=106) had a mood disorder, 32.3% (N=74) had an anxiety disorder, 9.6% (N=22) had an eating disorder, 2.2% (N=5) had an adjustment disorder, and 9.6% (N=22) had another specified diagnosis (eg, sexual, sleep, or dis-sociative disorders). In this sample, nondepressed patients and depressed patients were included because we aimed to evaluate the performance of the items along the whole depressive spectrum. Of the 229 outpatients, 41.5% (N=95) were free from pharmacological and/or psychotherapeutic treatment, whereas 58.5% (N=134) received pharmacological and/or psychotherapeutic treatment in the initial phase (first 2 months). Patients in treatment for more than 2 months were not considered, in order to avoid the effects of the therapeutic intervention on the pathology and its measurement.76 Patients
were recruited through private psychotherapeutic practices (N=105; 45.9%) and psychiatric departments (N=117; 51.1%). They completed the Teate Depression Item Pool questionnaire and the diagnostic semistructured interview as part of the standard intake assessment. Accredited mental health providers conducted the diagnostic interviews.
Nonclinical sample
The nonclinical sample was composed of 300 participants (females N=207, 69%; males N=93, 31%) without mental illness. Their average age was 27.35 years (SD =10.55; range: 18–63 years), and their average education was 13.54 years (SD =2.18; range: 1–27 years).
The nonclinical sample was recruited through attendants of adult education classes and an advertisement posted for established community groups. The participants were mostly Italian undergraduate students enrolled in a psychology course at the University in Chieti, Italy (N=217, 72.3%). All participants were preliminarily screened for psychiatric illness with a short interview. Only those individuals evidenc-ing no current psychopathology and no history of psychiatric hospitalization were included.
analysis
In order to select items from the Teate Depression Item Pool with best measurement properties for composing a brief, homogeneous, and unidimensional scale of depression, we used the extended logistic model, an extension of the Rasch one-parameter model for polythomous items: ie, with more than two ordered response categories.47,49 As a method of
parameter estimation, we applied the joint maximum likeli-hood estimation procedure, the most popular method in the usual many-item cases.49 Its purpose is to verify goodness
of fit of the model to empirical data by application of a maximum likelihood function. The maximum likelihood is obtained using an iterative process through fitting algorithms (specially, Newton-Raphson’s algorithm).
Rasch analysis was conducted using a Rasch Unidimensional Measurement Model (RUMM2020TM) software package
(RUMM Laboratory Pty Ltd, Perth, Australia).77
Procedure
item selection
In order to construct a Rasch-based scale, items from the 51-item pool were assessed by applying the following selec-tion criteria: 1) overall model fit, 2) individual item fit, and 3) item fit residual.45,78
The RUMM item trait test of fit (using the χ² statistic)
examines the collective agreement for all item values across subjects. In other words, it tests the extent to which the set of items conforms to a single trait in that population of subjects. As an indication of good fit, the χ² probability value of the
overall model would be nonsignificant (using Bonferroni α value adjusted to the number of items). When an item fits the Rasch model, the χ² probability should exceed 0.05, and a
fit residual should be within a specified range (eg, ±2.5).45,78
Given the sensitivity of the χ² statistics to large sample sizes,
the residual statistics were used primarily to guide decision making concerning fit.
item pool evaluation
Analyses used to assess whether the selected items con-formed to Rasch model expectations are briefly explained as follows.
evaluation of separation and reliability
The Person Separation Index (PSI) is the proportion of observed variance that is considered true, and it is consis-tent with Cronbach’s α.79 In the present context, it provides
an indication of the power of the measure to discriminate among respondents with different degrees of depression. A coefficient of 0.85 was considered good for individual or clinical use.80 Because high coefficients might indicate
that items measured only a limited structure of the scale (redundancy), it is often recommended to report the mean interitem correlation.45,81
appropriateness of the response format
Rasch analysis provides category threshold parameter values. The threshold (tik) refers to the point between adjacent response categories where either response is equally probable,
so each item has many thresholds, as response categories are −1. The category threshold parameter values should be ordered along their respective answer categories (eg, ti1 ,
ti2 , ti3 , ti4). If it happens, then across the whole range of the underlying trait being measured, each response option would systematically take turns showing the highest prob-ability of endorsement. If disordered thresholds are detected, then item rescoring is considered. Disordered thresholds may arise because of ambiguity in response option wording, or by respondents having difficulty consistently discriminating between options (eg, the category semantics are too close to one another with the use of terms such as “sometimes,” “often,” and “frequently”).
Test of local independence and unidimensionality assumptions
Assumptions of local independence and unidimensionality were further assessed.45 Local independence means that the
response to any item is unrelated to any other item when the level of the construct is controlled for. To identify it, the residual correlation matrix was examined, and pairs of items with correlations exceeding 0.3 were taken to indicate dependency.80 Unidimensionality implies that only one
construct is measured by the items. One of the methods to check for it is to undertake a principal components analysis of the standardized residuals. To detect this, we compared the person estimates (the logit of person severity of depres-sion) derived from two subsets of items that loaded (posi-tively and nega(posi-tively) on the additional component using a series of t-tests. If more than 5% of the t-tests are significant (or the lower bound of the binomial confidence interval is above 5%), the scale is multidimensional.80,82–84
item bias (DiF)
DIF is a form of item bias that occurs when groups with different sample characteristics (eg, sex, age, instruction) respond in a different way to a certain item, despite equal levels of depression. Many studies have shown that preva-lence of depression depends on sex.85–87 Thus, DIF due to
this variable might be suspected. No differences in item functioning would ensure that the item set can be validly used in both sexes. Two types of DIF may be identified.77
Uniform DIF would occur, for example, when males respond consistently higher than females on an item, given the same level of depression. Nonuniform DIF would occur if females selected a higher response option to an item at lower levels of depression compared with males, but a lower option at higher levels of depression. When an item was found to
exhibit uniform DIF, the problem can be remedied by split-ting the file by group and separately calibrasplit-ting the item for each group. In the case of the nonuniform DIF, item deletion was considered, particularly if removal improved overall model fit.45
To detect DIF, an analysis of variance (Bonferroni adjusted α level) of the standardized response residuals was conducted for each item, comparing scores across each level of the person factor (sex) and across different levels of depression, referred to as class intervals. The presence of uniform DIF is identified by a significant main effect for the sex factor, whereas the nonuniform DIF is detected by a significant interaction effect (sex X class interval) in analysis of variance of residuals.
Person location distribution
Within the Rasch model framework, person location distri-bution can be used as a strategy for examining differences across all levels of severity depression within a particular person factor (eg, diagnostic group). The logit distribution of all persons grouped in several class intervals and divided according to the “diagnostic group” (clinical versus nonclini-cal subjects) factor across all levels of depression was evalu-ated, and analysis of variance of the person location means associated with this person-related factor was reported. In this case, the probability of a subject endorsing an item (or response category) should differ according to this group membership.
Results
item selection
The Rasch model was elaborated by a values matrix pro-duced by 529 subjects (either clinical or nonclinical subjects) and 51 items. The 51-item pool showed poor fit to model expectations. As seen in Table 1, item–trait interaction χ²
probability value of the overall model with a Bonferroni correction did not exceed 0.05/51. PSI results were high (Table 1). Item fit residuals (df =514.65) ranged between +6.61
and −3.99. Eighteen items displayed residuals outside the acceptable range (±2.5), potentially contributing to misfit. Item χ² probability values (df =8) ranged between 0.000 and
0.936. With a Bonferroni correction to the χ² item
probabil-ity, approximately half of the items did not fit the model. In respect of difficulty, item locations were distributed along an interval from +0.81 to −0.91 logits, which allows for discriminating sufficiently individual locations of 43.6% of the respondents. The Rasch model uses the original response data for estimating probabilities of responses. These prob-abilities are expressed on a log-odd scale, and the units are called logits. The logit is the logarithm of the odd: ie, the ratio between the probability of the correct answer, P(X=1), and the probability of the wrong answer, P(X=0).35,57
In order to form a best fit for the Rasch model and in order to compose a short and suitable scale for the clinical routine, items were selected by applying the three aforementioned selection criteria. After removing item by item all misfitting items, excellent model fit (with Bonferroni adjustment) was achieved by a final 21-item set, named the Teate Depression Inventory (TDI) (Table 1). The name of the test is derived from the Latin name of the city of the authors’ university.
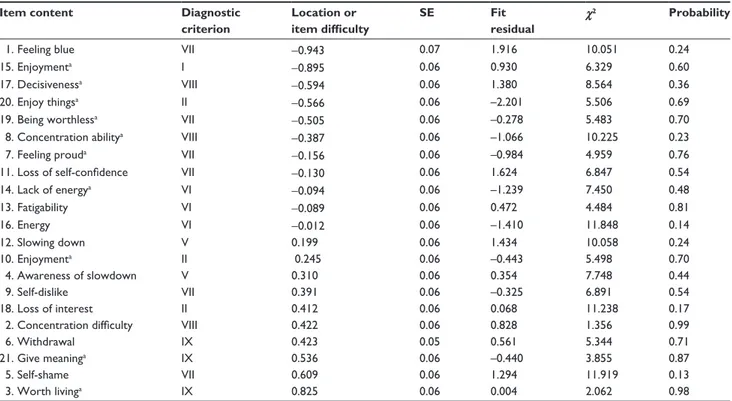
Table 2 lists the estimate parameters and fit statistics of the selected 21 items, ordered by item difficulty, or, in our case, the severity of depression associated with each item.
Item χ² probability values (df =8), ranging from 0.13 to
0.99, exceeded the Bonferroni adjusted α value of 0.001, indicating no significant deviation from the model. All items showed fit residuals values (df =498.90) within the accept-able bounds, ranging from +1.92 to −2.20. Thus, each item of this model showed satisfactory parameters that exceeded all critical values. The new range of item location (+0.82 to −0.94 logits) was sufficiently large. Thus, no relevant loss of information occurred (about 4%) in the 21-item model, against the appreciable improvement of fit.
In respect of item difficulty, appraisals of having suicidal thoughts (item 3) and feelings of self-shame (item 5) resulted in being the items that were hardest to endorse, marking the highest measures of depression, whereas self-ratings of feelings of sadness (items 1 and 15) would be affirmed by persons with a very low level of depression. In Table 2 note also the diagnostic criteria to which each item belongs. All criteria were represented, except for the III (appetite distur-bance) and IV (sleep disturdistur-bance) criteria, both concerning physiological distress. Thirteen somatic-related items showed suboptimal fitting to the Rasch analysis, probably because of their lack of unidimensionality, and thus were removed from the 51-item pool.
Table 1 Summary of measures of Rasch model fit for 51-item
pool and 21-item pool (N=529)
Measures of fit 51-item model 21-item model summary item mean (sD) 0.000 (0.417) 0.000 (0.502) summary person mean (sD) −0.589 (1.222) −0.606 (1.552)
Total item χ2 868.21 147.71
χ2 P 0.000 0.486
Degree of freedom 408 168
Psi 0.977 0.959
In respect of the scaling direction, ten out of 21 items were positively worded, so that the measure would better meet the standards of optimal test construction and minimize response bias (acquiescence).75,88,89
item pool evaluation
evaluation of separation and reliability
PSI (equal to 0.96) showed that the TDI could discriminate between patients with distinct levels of depression severity (Table 1).90 Interitem correlations ranged between 0.27 and
0.63, and the average interitem coefficient index was 0.46. No indication of possible redundant content was found.
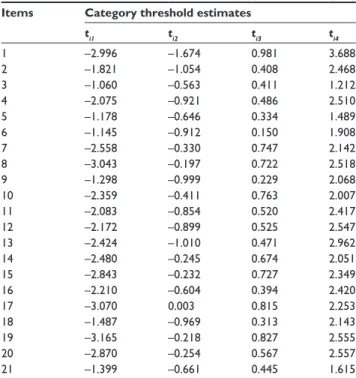
appropriateness of the response format
The suitability of the TDI response format (five response categories; category 0 labeled as “never” and category 4 labeled as “always”) was assessed by inspecting the param-eter values of the four category thresholds for each item (ti1, ti2, ti3, ti4) (Table 3). As seen, the stipulated order of the thresholds along their respective response categories was empirically confirmed. Each response category (0, 1, 2, 3, 4) systematically had a point along the depression continuum where it was the most likely response. This indicated that the response format of the TDI worked out well and that all
respondents were using the response categories in a manner that was consistent with the level of the trait of depression. This was probably due to our elaborate initial item selection, which allowed elimination of any ambiguity in response option wording.
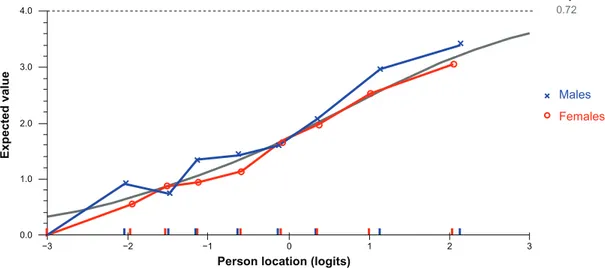
item bias (DiF)
Testing sex for DIF with a Bonferroni-adjusted P-value of 0.002 (0.05/21), we found that no items showed probability values exceeding the adjusted α value, except for item 10, which exhibited some degree of uniform DIF (Table 4).
Inspection of the graph in Figure 1 suggests that at equal levels of the overall trait of depression, females are slightly less likely than males to endorse this item tapping loss of enjoyment. This difference is noted only for the five categories, with no sex differences noted to this item in respondents in the categories around the zero level (rep-resenting average levels of depression). If the difference had been more pronounced (and statistically significant), this item would have been calibrated separately for males and females, treating it as two separate scale items for the purposes of providing an unbiased linear estimate of a person’s level of depression.
Table 2 Rasch item analysis, item parameter estimates, and fit statistics of the 21 selected items with correspondent Diagnostic and
Statistical Manual of Mental Disorders, Fourth Edition, Text Revision diagnostic criterion (N=529)
Item content Diagnostic
criterion Location or item difficulty SE Fit residual χ2 Probability
1. Feeling blue Vii −0.943 0.07 1.916 10.051 0.24
15. enjoymenta i −0.895 0.06 0.930 6.329 0.60
17. Decisivenessa Viii −0.594 0.06 1.380 8.564 0.36
20. enjoy thingsa ii −0.566 0.06 –2.201 5.506 0.69
19. Being worthlessa Vii −0.505 0.06 –0.278 5.483 0.70
8. concentration abilitya Viii −0.387 0.06 –1.066 10.225 0.23
7. Feeling prouda Vii −0.156 0.06 –0.984 4.959 0.76
11. Loss of self-confidence Vii −0.130 0.06 1.624 6.847 0.54
14. lack of energya Vi −0.094 0.06 –1.239 7.450 0.48 13. Fatigability Vi −0.089 0.06 0.472 4.484 0.81 16. energy Vi −0.012 0.06 –1.410 11.848 0.14 12. slowing down V 0.199 0.06 1.434 10.058 0.24 10. enjoymenta ii 0.245 0.06 –0.443 5.498 0.70 4. awareness of slowdown V 0.310 0.06 0.354 7.748 0.44 9. self-dislike Vii 0.391 0.06 –0.325 6.891 0.54 18. loss of interest ii 0.412 0.06 0.068 11.238 0.17
2. Concentration difficulty Viii 0.422 0.06 0.828 1.356 0.99
6. Withdrawal iX 0.423 0.05 0.561 5.344 0.71
21. give meaninga iX 0.536 0.06 –0.440 3.855 0.87
5. self-shame Vii 0.609 0.06 1.294 11.919 0.13
3. Worth livinga iX 0.825 0.06 0.004 2.062 0.98
Notes: aReverse scored items. Items organized by decreasing difficulty parameter or location.
Test of local independence and unidimensionality assumptions
The residual correlation matrix holds no additional substan-tial dimensions because intercorrelations of items ranged from 0.002 to 0.280 and no pairs of items showed correlations exceeding 0.3. Thus, no local dependency was detected.
Analysis of the pattern of residuals showed that the residuals loaded in opposite directions on the original scale. These two subsets of items (defined by positive and negative loadings on the first residual component) were then separately fitted to the Rasch model and the person estimates obtained. A series of independent t-tests performed on the person esti-mates from two subsets of items, identified from principal components analysis of the residuals, revealed that only 2.46% of cases had statistically significant t-values. There was no evidence of multidimensionality.
Person location distribution
Significant differences of the mean person location were found between the nonclinical (M=–1.44, DS =1.22) and clinical sample (M=0.49, DS =1.24) (F[1, 528]=320.13,
P,0.0001).
Figure 2 displays the distribution of the group diag-nostic (healthy subjects versus psychiatric patients) person factor across all levels of depression severity continuum (in logits).
As expected, “less severe” (or easier to endorse) items (ie, with negative values of logit, at the left of the scale metric) had a higher probability of endorsement by subjects whether slightly or mildly depressed (nonclinical sample), whereas “more severe” (or hardest to endorse) items (ie, with positive values of logit, located further on the right) on the spectrum had a high probability of endorsement only by severely depressed patients (clinical sample). Thus, as the item severity increased (ie, it moved to the right along the scale), only more severely depressed patients endorsed the harder items. Rasch respondent depression estimates for those who endorsed a given response category were examined to assess the degree to which higher category utilization was associated with increasing respondent depression.
The average mean person location value of 0.49 in the clinical sample suggests that on the whole the scale was rea-sonably well targeted for use with this group, with patients, on average, at a slightly higher level of depression than the average of the scale items (which would be zero logits).
Discussion
The aim of the present study was to present an extension of the Rasch model, the extended logistic model, to select depression mood items and to apply it for developing a new self-report measure of depression.
Initially, a larger pool of 152 items elicited by clinical experts underwent several steps of a qualitative item selec-tion, resulting in the retention of 51 items. An elaborate selection procedure was used to guarantee content validity,
Table 3 estimates of category thresholds of 21 Teate Depression
inventory items (N=529)
Items Category threshold estimates
ti1 ti2 ti3 ti4 1 –2.996 –1.674 0.981 3.688 2 –1.821 –1.054 0.408 2.468 3 –1.060 –0.563 0.411 1.212 4 –2.075 –0.921 0.486 2.510 5 –1.178 –0.646 0.334 1.489 6 –1.145 –0.912 0.150 1.908 7 –2.558 –0.330 0.747 2.142 8 –3.043 –0.197 0.722 2.518 9 –1.298 –0.999 0.229 2.068 10 –2.359 –0.411 0.763 2.007 11 –2.083 –0.854 0.520 2.417 12 –2.172 –0.899 0.525 2.547 13 –2.424 –1.010 0.471 2.962 14 –2.480 –0.245 0.674 2.051 15 –2.843 –0.232 0.727 2.349 16 –2.210 –0.604 0.394 2.420 17 –3.070 0.003 0.815 2.253 18 –1.487 –0.969 0.313 2.143 19 –3.165 –0.218 0.827 2.555 20 –2.870 –0.254 0.567 2.557 21 –1.399 –0.661 0.445 1.615
Table 4 Uniform and nonuniform differential item functioning
(DiF) statistics for all Teate Depression inventory items (N=529)
Item Uniform DIF Nonuniform DIF
Sex Sex X class interval
MS F df P MS F df P 1 5.47 5.166 1 0.023451 1.23 1.163 8 0.319557 2 1.47 1.434 1 0.231645 0.54 0.523 8 0.839351 3 0.04 0.043 1 0.835947 0.59 0.615 8 0.765688 4 0.24 0.244 1 0.621738 0.98 1.013 8 0.425339 5 0.50 0.470 1 0.493101 1.11 1.046 8 0.400433 6 0.08 0.082 1 0.775212 1.04 1.039 8 0.405080 7 0.03 0.029 1 0.865615 0.57 0.634 8 0.749296 8 0.04 0.046 1 0.829384 0.68 0.770 8 0.629441 9 0.36 0.388 1 0.533492 0.77 0.829 8 0.576830 10 10.31 11.397 1 0.000801 0.87 0.967 8 0.461311 11 0.08 0.073 1 0.787262 1.71 1.636 8 0.111815 12 2.93 2.826 1 0.093355 0.98 0.942 8 0.480909 13 0.24 0.247 1 0.619269 1.50 1.537 8 0.141724 14 0.36 0.049 1 0.522685 0.53 0.598 8 0.779465 15 0.61 0.609 1 0.435590 1.28 1.272 8 0.255466 16 1.93 2.305 1 0.129548 1.87 2.233 8 0.023920 17 0.57 0.543 1 0.461709 0.40 0.378 8 0.932538 18 0.05 0.054 1 0.815841 1.94 2.087 8 0.035466 19 0.05 0.049 1 0.825584 0.60 0.637 8 0.747019 20 0.03 0.040 1 0.842438 1.27 1.551 8 0.136952 21 5.26 5.820 1 0.016188 1.27 1.403 8 0.192296
an important and often lacking feature in self-report depres-sion instruments.15 In order to put together a pool of items
with the expectation that they measure the target construct of depression, a set of psychometric requirements associated with the Rasch model must be satisfied. Thus, the 51-item pool underwent further quantitative selection and evaluation by using criteria of the Rasch analysis. A resulting 21-item scale, named TDI, fitted the Rasch model and measured depression unidimensionally and precisely across a wide range of severities. As such, by assessing these requirements, it is assured that the TDI measures exclusively a single construct (unidimensionality) and that the value attributed to each item of the scale can be adequately added to the value of the other (additivity). It is also assured that each item is measuring a relevant aspect and, given the level of
depression of the person, does not depend on another item to have this information (local independence). Even if this item is administered to a respondent belonging to a different sex, it will continue measuring the same ability or, in this case, severity of depression (invariance). In respect of the latter property, all items showed no differences due to sex, except for item 10. This item was still retained in the scale, because we could further solve by sex-dependent TDI norms. In any case, the fact that the performance of the TDI was sufficiently insensitive for sex biases could represent an advantage over the extant depression questionnaires such as the BDI-II that included several items showing DIF dependent of the respondent’s sex. Indeed, these items might substantially interfere with the valid interpretation of instrument’s sum score.43,61,64 5 4 3 2 1 0 −1 Location (logits) Frequenc y −2 −3 −4 −5 −6 −7 40 30 Nonclinical sample Clinical sample 300 N 229 −1.438 Mean 0.485 1.22 Standard deviation
Person frequency distribution
(grouping set to interval length of 0.20 making 60 groups)
1.24
20
10
0
Figure 2 The distribution of the group diagnostic person factor across all levels of depression severity.
3 2
1 0
−1
Person location (logits)
Slope 0.72 Expected value −2 −3 4.0 3.0 2.0 1.0 0.0 Males Females
In the context of assessment of depression, some meth-odological advances we have been advocating in this article could be gained by applying the Rasch model to the develop-ment of a new depression instrudevelop-ment.
Using the Rasch-based measure, it is possible to generate a total summed score as an actual index of a person’s sever-ity of depression whose meaning is unidimensional, clear, and easily interpreted by experts and lay judges.42,91 Another
advantage is the ability of the Rasch model to evaluate the rating scale performance to ensure that the response options function as intended. Rating scales are intended to function such that each point on the response continuum is meaningful and distinct from the other options. Although test developers endeavor to achieve this aim, the resulting scales often do not function as intended.32 As an illustration, respondents
might struggle to discriminate between item options such as “almost never” and “sometimes,” underutilizing a given option or using the options in an inconsistent manner. Rating scales also might function differently from item to item on the same questionnaire. Such discrepancies can be identified and accurately adjusted with the Rasch model, producing true interval scaled data. This feature is particularly impor-tant when the clinical scale is used for monitoring change as well as in attempting to detect and quantify the impact of therapeutic interventions. Interval scales, being linear and quantitative, allow all elementary mathematical operations and consequently the calculation of statistical indicators, which leads to significant quantitative comparisons within and between subjects. A Rasch-based instrument allows comparing quantitatively either two subjects (or two groups of subjects) or the same subjects at two different moments. A difference of 1 logit unit between two subjects indicates that the subject with the higher depression severity has a probability of responding in a given category (eg, often) rather than in the category below (eg, never). For instance, if we had to test an antidepressant drug, this method could have revealed the presence or absence of a treatment effect and, most importantly, quantified it on a linear scale. On the contrary, quantitative comparisons using an ordinal scale in repeated assessments could lead to erroneous conclusions.
Besides ensuring that the best quality standards for measurement are attained for the scale, there are theoretical advantages when applying the Rasch model to the construc-tion of a new depression measure. Indeed, insights from Rasch analysis could add a layer of diagnostic information that might have clinical relevance. Analysis of the content of the TDI items selected by using the Rasch model could allow for adding to the knowledge of the true variability of
depression, as opposed to the potentially spurious variability derived from different scale ascertainment. For example, the TDI item assessing suicidal ideation was given the highest weight (raw score) as those that tap sadness. In accordance with clinical research, a depressive syndrome with suicidal ideation is more serious, and this item alone indicates higher intensity of depression.21,22,24,25 Also, items tapping self-shame
had higher weight, in accordance with the growing body of literature that has attached great importance to the emotion of self-shame in generating depressive symptoms.92–101 It is
expected that a more depressed subject will endorse an item regarding self-shame more frequently than a nondepressed subject. Although this particular item does not directly mea-sure depression, it helps in the construction of the depression score, together with other related items that are designed to measure the latent variable. Items referring to somatic symptoms (sleep and appetite disturbances) did not fit the Rasch model, as they provided no additional information to estimate the person’s level of depression, and also, in Rasch analysis terms, did not share a probabilistic structure with the other items in the scale. The debate about the relevance of these items for depression is ongoing.102,103 Our results
seem to be according to previous studies that cast doubts on their nature, also by using different approach, such as fac-tor analysis.12 The removal of these items is consistent with
the confounding of comorbidity that may be expected when applied to other diagnostic groups and can result in false positives.43,104,105 Depression is an important predictor for
morbidity and mortality in many somatic ailments, such as cardiologic diseases.106–108 Sum scores of existing depression
scales containing somatic items could be biased if those were completed by persons suffering from a somatic illness. The TDI as a unidimensional screening tool for depression, without items concerning somatic complaints, could be more useful for assessing depression in somatically ill patients. It would be beneficial in settings in which time to focus on mental health diagnostics is strongly limited but prevalence of depression is presumably high (eg, cardiology).108
Accordingly, additional studies are needed to examine how TDI items perform in different patient populations (eg, neurologic, cardiac, cancer). However, it could be argued that by deleting somatic items from the final item pool, the assessment of depressive severity provided by the question-naire is no longer concurrent with the DSM-IV-TR and DSM-V criteria for MDE. It should be noted that the TDI was developed as an indicator of the presence and the sever-ity of depression mood, not as an instrument for specifying a clinical diagnosis. Furthermore, deleting these items can
enhance the unidimensionality of the core symptoms in a manner that allows uniform assessment of change. Although identifying a core set of symptoms with proven psychometric qualities is limited, in that it does not permit capture of the full depressive syndrome, the objective comparisons between subjects (and within subjects in repeated sessions) could be allowed.13,43–47 Thus, effects of a therapeutic intervention
would be easily detected.
Recently, in two studies the TDI was administered to large clinical and nonclinical samples.31,109 In the first study,
inter-nal consistency was found to be high (Cronbach’s α=0.92) in a sample of 857 young adults. In addition, significant cor-relations with the subfactor of high standards/self-criticism (r=0.26, P,0.01) of the Attitudes Toward Self Revised Scale,110 and with the BDI-II (r=0.65, P,0.01) were found.
Moderate association between TDI and BDI-II may be due to the lack of unidimensionality for the BDI-II.23,29,43,111–113 In
the second study, Cronbach’s α was 0.94 and 0.92 (P,0.01), respectively, for the clinical (1,124 psychiatric outpatients) and nonclinical samples (877 healthy subjects).109 Correlation
with the BDI-II was 0.73 (P,0.01) in both the clinical and nonclinical samples. Correlation with the Beck Anxiety Inventory114 was 0.46 (P,0.01) in a clinical subsample of
102 outpatients and 0.54 (P,0.01) in a nonclinical subsample composed of 151 subjects.
Summing up, the TDI shows considerable promise as a unidimensional depression mood scale. Contrary to ordinal scores, Rasch-based measures can validly be treated with parametrical statistical procedures with all subsequent advantages in terms of power.
Other potential advantages could be gained. The Rasch methodology could: 1) help adjust for cross-cultural differ-ences where data are pooled, eg, in international clinical trials;115,116 2) be used to investigate whether the format
demands adaptations for certain cultural contexts;43,115–117 and
3) contribute to eliminating the difference existing between clinical variables such as depression mood and physical or biological variables in terms of measurement.
Future research could potentially address whether the TDI can also be clinician rated, and, if so, what the correlation is between self-rated TDI and clinician-rated TD: ie, whether administration via both approaches would be complementary or redundant.
limitations
This study has several limitations on both the developed instrument and the used method. With regard to TDI, its development is still incomplete. For clinical applications,
cut scores should be given so that the providers can quickly identify patients with a high likelihood of a DSM condi-tion depression. Although these scores were derived using traditional scoring methods and appeared to be not always optimal, it would be difficult to convince end users to switch to an instrument that does not appear to be as clinically infor-mative, like the BDI-II. Additionally, it would be useful to identify cutoff scores for response and remission following treatment to determine what the usual time frame between assessments should be for repeated assessments (eg, in a clinical trial). Again, invariance of the measurement instru-ment should also be verified to other moderator variables, such as age, instruction, race, and comorbid psychiatric illness. It would be important to determine whether the TDI is appropriate for use in pediatric/adolescent subjects, as well as the elderly, and whether comorbid psychiatric illness (eg, severe anxiety) influences the scoring (ie, discriminant validity). Finally, some evidence of incremental validity in the crowded market of depression measures should be provided to convince end users to use a new instrument.
Limitations of the Rasch analysis must also be taken into account. The major drawback concerns the intellectual investment in order to fully understand the model as well as to handle the analysis software. Indeed, the analysis of ratings with the Rasch model requires more effort than the traditional handling of ordinal scores.
Disclosure
The authors report no conflicts of interest in this work.
References
1. Gaynes BN, Burns BJ, Tweed DL, Erickson P. Depression and health-related quality of life. J Nerv Ment Dis. 2002;190(12):799–806. 2. Lett HS, Blumenthal JA, Babyak MA, et al. Dimensions of social
support and depression in patients at increased psychosocial risk recovering from myocardial infarction. Int J Behav Med. 2009;16(3): 248–258.
3. Nichols G, Moler E. Cardiovascular disease, heart failure, chronic kid-ney disease and depression independently increase the risk of incident diabetes. Diabetologia. 2011;54(3):523–526.
4. Patten SB, Williams JV, Lavorato DH, Campbell NR, Eliasziw M, Campbell TS. Major depression as a risk factor for high blood pressure: epidemiologic evidence from a national longitudinal study. Psychosom
Med. 2009;71(3):273–279.
5. Sobocki P, Jönsson B, Angst J, Rehnberg C. Cost of depression in Europe.
J Ment Health Policy Econ. 2006;9(2):87–98.
6. World Health Organization. The World Health Report 2001 – Mental
Health: New Understanding, New Hope. Geneva, Switzerland: World
Health Organization; 2001.
7. van Marwijk H, Gercama A, Adèr H, de Haan M. Mean clinical challenge rate and level of recognition of depression remain unchanged after two years of vocational training. Fam Pract. 2001;18(6):590–591. 8. Joiner Jr TE, Walker RL, Pettit JW, Perez M, Cukrowicz KC.
Evidence-based assessment of depression in adults. Psychol Assess. 2005;17(3):267.
9. Nezu AM. Practitioner’s Guide to Empirically Based Measures of
Depression. New York: Springer; 2000.
10. Zung K. Self rating anxiety and depression scale. Arch Gen Psychiatry. 1965;12:63–70.
11. Radloff LS. The CES-D scale a self-report depression scale for research in the general population. Appl Psychol Meas. 1977;1(3):385–401. 12. Dozois D, Dobson K. Depression. In: Antony M, Barlow D, editors.
Handbook of Assessment and Treatment Planning for Psychological Disorders. New York: Guilford Press; 2002:259–299.
13. Beck A, Steer R, Brown G. Beck Depression Inventory – II, Manual. San Antonio,TX: The Psychological Corporation; 1996.
14. Nunnally JC, Bernstein IH. Psychometric Theory. New York: McGraw-Hill; 1994.
15. Balsamo M, Saggino A. Test per l’assessment della depressione nel contesto italiano: un’analisi critica [Tests for depression assess-ment in Italian context: a critical review]. Psicoterapia Cognitiva e
Comportamentale. 2007;13(2):167–199. Italian.
16. Alexopoulos GS, Borson S, Cuthbert BN, et al. Assessment of late life depression. Biol Psychiatry. 2002;52(3):164–174.
17. Bouman TK, Kok A. Homogeneity of Beck’s Depression Inven-tory (BDI): applying Rasch analysis in conceptual exploration. Acta
Psychiatr Scand. 1987;76(5):568–573.
18. De Bonis M, Lebeaux M, De Boeck P, Simon M, Pichot P. Measuring the severity of depression through a self-report inventory: a comparison of logistic, factorial and implicit models. J Affect Disord. 1991;22(1): 55–64.
19. Licht RW, Qvitzau S, Allerup P, Bech P. Validation of the Bech– Rafaelsen Melancholia Scale and the Hamilton Depression Scale in patients with major depression; is the total score a valid measure of illness severity? Acta Psychiatr Scand. 2005;111(2):144–149. 20. Rosenberg R. Outcome measures of antidepressive therapy. Acta
Psychiatr Scand. 2000;101(s402):41–44.
21. Alexandrino-Silva C, Pereira MLG, Bustamante C, et al. Suicidal ideation among students enrolled in healthcare training programs: a cross-sectional study. Rev Bras Psiquiatr. 2009;31(4):338–344. 22. Clark D, vonAmmon Cavanaugh S, Gibbons R. The core symptoms
of depression in medical and psychiatric patients. J Nerv Ment Dis. 1983;171(12):705–713.
23. Gibbons RD, Clark DC, VonAmmon Cavanaugh S, Davis JM. Application of modern psychometric theory in psychiatric research.
J Psychiatr Res. 1985;19(1):43–55.
24. Selvi Y, Aydin A, Boysan M, Atli A, Agargun MY, Besiroglu L. Associations between chronotype, sleep quality, suicidality, and depressive symptoms in patients with major depression and healthy controls. Chronobiol Int. 2010;27(9–10):1813–1828.
25. Gastel AV, Schotte C, Maes M. The prediction of suicidal intent in depressed patients. Acta Psychiatr Scand. 1997;96(4):254–259. 26. Tanaka JS, Huba GJ. Confirmatory hierarchical factor analyses of
psy-chological distress measures. J Pers Soc Psychol. 1984;46(3):621. 27. Svensson E. Guidelines to statistical evaluation of data from rating
scales and questionnaires. J Rehabil Med. 2001;33(1):47–48. 28. Storch EA, Roberti JW, Roth DA. Factor structure, concurrent validity,
and internal consistency of the Beck Depression Inventory – second edition in a sample of college students. Depress Anxiety. 2004;19(3): 187–189.
29. Osman A, Kopper BA, Barrios F, Gutierrez PM, Bagge CL. Reliability and validity of the Beck depression inventory–II with adolescent psy-chiatric inpatients. Psychol Assess. 2004;16(2):120.
30. Crockett LJ, Randall BA, Shen Y-L, Russell ST, Driscoll AK. Measurement equivalence of the Center for Epidemiological Studies Depression Scale for Latino and Anglo adolescents: a national study.
J Consult Clin Psychol. 2005;73(1):47–58.
31. Balsamo M, Imperatori C, Sergi MR, et al. Cognitive vulnerabilities and depression in young adults: an ROC curves analysis. Depress Res
Treat. 2013;2013:8.
32. Lopez W. Communication validity and rating scales. Rasch
Measure-ment Transactions. 1996;10(1):482–483.
33. Merbitz C, Morris J, Grip J. Ordinal scales and foundations of misinference. Arch Phys Med Rehabil. 1989;70(4):308.
34. Smith E Jr. Evidence for the reliability of measures and validity of measure interpretation: a Rasch measurement perspective. J Appl Meas. 2001;2(3):281–311.
35. Wright BD, Linacre J. Observations are always ordinal; measurements, however, must be interval. Arch Phys Med Rehabil. 1989;70(12):857. 36. Schmitt M, Maes J. Simplification of the Beck-Depression-Inventory
(BDI). Diagnostica. 2000;46(1):38–46.
37. Valenstein M, Vijan S, Zeber JE, Boehm K, Buttar A. The cost– utility of screening for depression in primary care. Ann Intern Med. 2001;134(5):345–360.
38. Zimmerman M, Chelminski I, McGlinchey JB, Posternak MA. A clini-cally useful depression outcome scale. Compr Psychiatry. 2008;49(2): 131–140.
39. Sauer S, Ziegler M, Schmitt M. Rasch analysis of a simplified Beck Depression Inventory. Pers Individ Dif. 2013;54(4):530–535. 40. Zimmerman M, Coryell W. The Inventory to Diagnose Depression
(IDD): a self-report scale to diagnose major depressive disorder.
J Consult Clin Psychol. 1987;55(1):55–59.
41. Rasch G. Probabilistic Models for Some Intelligence and Attainment
Tests. Copenhagen, Denmark: Danish Institute for Educational
Research; 1960.
42. Bond TG, Fox CM. Applying the Rasch Model: Fundamental
Measurement in the Human Sciences. Mahwah, NJ: Lawrence Erlbaum;
2007.
43. da Rocha NS, Chachamovich E, de Almeida Fleck MP, Tennant A. An introduction to Rasch analysis for psychiatric practice and research.
J Psychiatr Res. 2012;47(2):141–148.
44. Edelen MO, Reeve BB. Applying item response theory (IRT) modeling to questionnaire development, evaluation, and refinement. Qual Life
Res. 2007;16(1):5–18.
45. Pallant JF, Tennant A. An introduction to the Rasch measurement model: an example using the Hospital Anxiety and Depression Scale (HADS). Br J Clin Psychol. 2007;46(1):1–18.
46. Thomas ML. The value of item response theory in clinical assessment: a review. Assessment. 2011;18(3):291–307.
47. Andrich D. A general form of Rasch’s extended logistic model for partial credit scoring. Applied Measurement in Education. 1988;1(4):363–378. 48. Wright BD, Masters GN. Rating Scale Analysis. Chicago, IL: Mesa
Press; 1982.
49. Andrich D. Rasch Models for Measurement. Thousands Oaks, CA: Sage Publications; 1988.
50. Andrich D. A rating formulation for ordered response categories.
Psychometrika. 1978;43(4):561–573.
51. Hagquist C, Andrich D. Is the sense of coherence-instrument applicable on adolescents? A latent trait analysis using Rasch-modelling. Pers
Individ Dif. 2004;36(4):955–968.
52. Karabatsos G. The Rasch model, additive conjoint measurement, and new models of probabilistic measurement theory. J Appl Meas. 2001;2(4):389–423.
53. Linacre J. Optimizing rating scale category effectiveness. J Appl Meas. 2002;3(1):85.
54. Michell J. Measurement: a beginner’s guide. J Appl Meas. 2003;4(4):298. 55. O’Connor RJ, Tennant A. Measuring pain: issues of interpretation.
Lancet. 2008;371:1519–1525.
56. Waugh RF. Creating a scale to measure motivation to achieve academically: linking attitudes and behaviours using Rasch measurement. Br J Educ Psychol. 2002;72(1):65–86.
57. Wright BD. Logits? Rasch Measurement Transactions. 1993;7(2):288. 58. Wright BD, Stone M. Best Test Design. Chicago, IL: Mesa Press;
1979.
59. Bagby RM, Ryder AG, Schuller DR, Marshall MB. The Hamilton Depression Rating Scale: has the gold standard become a lead weight?
Am J Psychiatry. 2004;161(12):2163–2177.
60. Bech P, Allerup P, Gram L, et al. The Hamilton Depression Scale. Acta
61. Santor DA, Ramsay J, Zuroff DC. Nonparametric item analyses of the Beck Depression Inventory: evaluating gender item bias and response option weights. Psychol Assess. 1994;6(3):255–270.
62. Santor DA, Coyne JC. Examining symptom expression as a function of symptom severity: item performance on the Hamilton Rating Scale for Depression. Psychol Assess. 2001;13(1):127.
63. Holland PW, Wainer H. Differential Item Functioning. Hilldale, NJ: Lawrence Erlbaum Associates; 1993.
64. Forkmann T, Boecker M, Wirtz M, et al. Development and validation of the Rasch-based depression screening (DESC) using Rasch analy-sis and structural equation modelling. J Behav Ther Exp Psychiatry. 2009;40(3):468–478.
65. Forkmann T, Boecker M, Wirtz M, et al. Validation of the Rasch-based depression screening in a large scale German general population sample.
Health Qual Life Outcomes. 2010;8(1):105.
66. Parkitny L, McAuley JH, Walton D, et al. Rasch analysis supports the use of the depression, anxiety, and stress scales to measure mood in groups but not in individuals with chronic low back pain. J Clin
Epidemiol. 2012;65(2):189–198.
67. Fliege H, Becker J, Walter OB, Bjorner JB, Klapp BF, Rose M. Development of a computer-adaptive test for depression (D-CAT).
Qual Life Res. 2005;14(10):2277–2291.
68. Irwin DE, Stucky B, Langer MM, et al. An item response analysis of the pediatric PROMIS anxiety and depressive symptoms scales. Qual
Life Res. 2010;19(4):595–607.
69. Lai J-s, Cella D, Chang C-H, Bode RK, Heinemann AW. Item banking to improve, shorten and computerize self-reported fatigue: an illustration of steps to create a core item bank from the FACIT-Fatigue Scale. Qual
Life Res. 2003;12(5):485–501.
70. Pilkonis PA, Choi SW, Reise SP, Stover AM, Riley WT, Cella D. Item banks for measuring emotional distress from the Patient-Reported Outcomes Measurement Information System (PROMIS®): depression,
anxiety, and anger. Assessment. 2011;18(3):263–283.
71. American Psychiatric Association. Diagnostic and Statistical Manual of
Mental Disorders: DSM-IV-TR®. Arlington, VA: American Psychiatric
Publishing; 2000.
72. Angleitner A, John O, Löhr F. It’s what you ask and how you ask it: an itemetric analysis of personality questionnaires. In: Angleitner A, Wiggins J, editors. Personality Assessment via Questionnaires. Berlin, Germany: Springer; 1986.
73. Clak DA, Beck AT, Alford BA. Scientific Foundations of Cognitive
Theory and Therapy of Depression. New York: Wiley; 1999.
74. American Psychiatric Association. DSM-V. APATFo. Diagnostic
and Statistical Manual of Mental Disorders: DSM-V. Arlington, VA:
American Psychiatric Publishing; 2013.
75. Kline P. A Handbook of Test Construction: Introduction to Psychometric
Design. London, UK: Methuen; 1986.
76. Mayberg HS, Brannan SK, Tekell JL, et al. Regional metabolic effects of fluoxetine in major depression: serial changes and relationship to clinical response. Biol Psychiatry. 2000;48(8):830–843.
77. Andrich D, Lyne A, Sheridan B, Luo G. RUMM 2020. Perth, Australia: RUMM Laboratory; 2003.
78. Giampaglia G. Il Modello di Rasch nella Ricerca Sociale [Rasch Model
in Social Research]. Naples, Italy: Liguori Editore; 2011.
79. Andrich D. An extension of the Rasch model for ratings providing both location and dispersion parameters. Psychometrika. 1982;47(1): 105–113.
80. Tennant A, Conaghan PG. The Rasch measurement model in rheumatology: what is it and why use it? When should it be applied, and what should one look for in a Rasch paper? Arthritis Care Res. 2007;57(8):1358–1362. 81. Briggs SR, Cheek JM. The role of factor analysis in the development
and evaluation of personality scales. J Pers. 1986;54(1):106–148. 82. Smith E Jr. Detecting and evaluating the impact of multidimensionality
using item fit statistics and principal component analysis of residuals.
J Appl Meas. 2002;3(2):205–231.
83. Linacre JM. Detecting multidimensionality: which residual data-type works best? J Outcome Meas. 1998;2:266–283.
84. Tennant A, Pallant J. Unidimensionality matters. Rasch Measurement
Transactions. 2006;20(1):1048–1051.
85. Broekman B, Nyunt S, Niti M, et al. Differential item functioning of the Geriatric Depression Scale in an Asian population. J Affect Disord. 2008;108(3):285–290.
86. Gottlieb SS, Khatta M, Friedmann E, et al. The influence of age, gender, and race on the prevalence of depression in heart failure patients. J Am Coll Cardiol. 2004;43(9):1542–1549.
87. Wittchen H-U, Jacobi F. Size and burden of mental disorders in Europe – a critical review and appraisal of 27 studies. Eur
Neuropsychopharmacol. 2005;15(4):357–376.
88. Cronbach LJ. Response sets and test validity. Educ Psychol Meas. 1946;6(4):475–494.
89. Millham J, Kellogg RW. Need for social approval: Impression manage-ment or self-deception? J Res Pers. 1980;14(4):445–457.
90. Andrich D, Lyne A, Sheridan B, Luo H. RUMM2010: a Windows program for analyzing item response data according to Rasch Unidimensional Measurement Models (Version 3.3) [Computer program]. Perth, Australia: RUMM Laboratory; 2001.
91. Embretson S, Reise S, Reise S. Item Response Theory for Psychologists. Hillsdale, NJ: Lawrence Earlbaum Associates; 2000.
92. Allan S, Gilbert P, Goss K. An exploration of shame measures–II: psychopathology. Pers Individ Dif. 1994;17(5):719–722.
93. Andrews B, Qian M, Valentine JD. Predicting depressive symptoms with a new measure of shame: the experience of shame scale. Br J
Clin Psychol. 2002;41(1):29–42.
94. Cheung M-P, Gilbert P, Irons C. An exploration of shame, social rank and rumination in relation to depression. Pers Individ Dif. 2004;36(5): 1143–1153.
95. Cook D. Empirical studies of shame and guilt: the internalised shame scale. In: Nathanson D, editor. Knowing Feeling: Affect, Script and
Psychotherapy. New York: Norton; 1996:132–165.
96. Kim S, Thibodeau R, Jorgensen RS. Shame, guilt, and depressive symptoms: a meta-analytic review. Psychol Bull. 2011;137(1):68–96. 97. Fontaine JR, Luyten P, De Boeck P, Corveleyn J. The test of self‐
conscious affect: internal structure, differential scales and relationships with long-term affects. Eur J Pers. 2001;15(6):449–463.
98. Gee A, Troop N. Shame, depressive symptoms and eating, weight and shape concerns in a non-clinical sample. Eat Weight Disord. 2003;8(1):72.
99. Gilbert P, Cheung M, Irons C, McEwan K. An exploration into depression-focused and anger-focused rumination in relation to depres-sion in a student population. Behav Cogn Psychother. 2005;33(3):273. 100. Tangney JP. Recent advances in the empirical study of shame and
guilt. Am Behav Sci. 1995;38(8):1132–1145.
101. Thompson RJ, Berenbaum H. Shame reactions to everyday dilemmas are associated with depressive disorder. Cognit Ther Res. 2006;30(4): 415–425.
102. Abdel-Khalek AM. Can somatic symptoms predict depression. Soc
Behav Pers. 2004;32(7):657–666.
103. Simon GE, VonKorff M, Piccinelli M, Fullerton C, Ormel J. An international study of the relation between somatic symptoms and depression. N Engl J Med. 1999;341(18):1329–1335.
104. Gibbons CJ, Mills RJ, Thornton EW, et al. Rasch analysis of the Hos-pital Anxiety and Depression Scale (HADS) for use in motor neurone disease. Health Qual Life Outcomes. 2011;9:82.
105. Thombs BD, Magyar-Russell G, Bass EB, et al. Performance characteristics of depression screening instruments in survivors of acute myocardial infarction: review of the evidence. Psychosomatics. 2007;48(3):185–194.
106. Bush DE, Ziegelstein RC, Tayback M, et al. Even minimal symptoms of depression increase mortality risk after acute myocardial infarction.
Am J Cardiol. 2001;88(4):337–341.
107. Di Benedetto M, Lindner H, Hare DL, Kent S. Depression follow-ing acute coronary syndromes: a comparison between the Cardiac Depression Scale and the Beck Depression Inventory II. J Psychosom