A&A 582, A31 (2015) DOI:10.1051/0004-6361/201424955 c ESO 2015
Astronomy
&
Astrophysics
Planck intermediate results
XXVIII. Interstellar gas and dust
in the Chamaeleon clouds as seen by Fermi LAT and Planck
?Planck and Fermi Collaborations: P. A. R. Ade79, N. Aghanim55, G. Aniano55, M. Arnaud67, M. Ashdown64,5, J. Aumont55, C. Baccigalupi78, A. J. Banday85,9, R. B. Barreiro61, N. Bartolo28, E. Battaner87,88, K. Benabed56,84, A. Benoit-Lévy21,56,84, J.-P. Bernard85,9, M. Bersanelli31,47, P. Bielewicz85,9,78, A. Bonaldi63, L. Bonavera61, J. R. Bond8, J. Borrill12,81, F. R. Bouchet56,84, F. Boulanger55, C. Burigana46,29,48, R. C. Butler46,
E. Calabrese83, J.-F. Cardoso68,1,56, J. M. Casandjian67, A. Catalano69,66, A. Chamballu67,14,55, H. C. Chiang25,6, P. R. Christensen76,34, L. P. L. Colombo20,62, C. Combet69, F. Couchot65, B. P. Crill62,77, A. Curto5,61, F. Cuttaia46, L. Danese78, R. D. Davies63, R. J. Davis63, P. de Bernardis30, A. de Rosa46, G. de Zotti43,78, J. Delabrouille1, F.-X. Désert51, C. Dickinson63, J. M. Diego61, S. W. Digel89, H. Dole55,54,
S. Donzelli47, O. Doré62,10, M. Douspis55, A. Ducout56,52, X. Dupac37, G. Efstathiou58, F. Elsner56,84, T. A. Enßlin72, H. K. Eriksen59, E. Falgarone66, F. Finelli46,48, O. Forni85,9, M. Frailis45, A. A. Fraisse25, E. Franceschi46, A. Frejsel76, Y. Fukui24, S. Galeotta45, S. Galli56,
K. Ganga1, T. Ghosh55, M. Giard85,9, E. Gjerløw59, J. González-Nuevo61,78, K. M. Górski62,90, A. Gregorio32,45,50, I. A. Grenier67,??, A. Gruppuso46, F. K. Hansen59, D. Hanson74,62,8, D. L. Harrison58,64, S. Henrot-Versillé65, C. Hernández-Monteagudo11,72, D. Herranz61, S. R. Hildebrandt62, E. Hivon56,84, M. Hobson5, W. A. Holmes62, W. Hovest72, K. M. Huffenberger22, G. Hurier55, A. H. Jaffe52, T. R. Jaffe85,9,
W. C. Jones25, M. Juvela23, E. Keihänen23, R. Keskitalo12, T. S. Kisner71, R. Kneissl36,7, J. Knoche72, M. Kunz16,55,2, H. Kurki-Suonio23,41, G. Lagache55, J.-M. Lamarre66, A. Lasenby5,64, M. Lattanzi29, C. R. Lawrence62, R. Leonardi37, F. Levrier66, M. Liguori28, P. B. Lilje59, M. Linden-Vørnle15, M. López-Caniego61, P. M. Lubin26, J. F. Macías-Pérez69, B. Maffei63, D. Maino31,47, N. Mandolesi46,4,29, M. Maris45,
D. J. Marshall67, P. G. Martin8, E. Martínez-González61, S. Masi30, S. Matarrese28, P. Mazzotta33, A. Melchiorri30,49, L. Mendes37, A. Mennella31,47, M. Migliaccio58,64, M.-A. Miville-Deschênes55,8, A. Moneti56, L. Montier85,9, G. Morgante46, D. Mortlock52, D. Munshi79,
J. A. Murphy75, P. Naselsky76,34, P. Natoli29,3,46, H. U. Nørgaard-Nielsen15, D. Novikov52, I. Novikov76, C. A. Oxborrow15, L. Pagano30,49, F. Pajot55, R. Paladini53, D. Paoletti46,48, F. Pasian45, O. Perdereau65, L. Perotto69, F. Perrotta78, V. Pettorino40, F. Piacentini30, M. Piat1, S. Plaszczynski65, E. Pointecouteau85,9, G. Polenta3,44, L. Popa57, G. W. Pratt67, S. Prunet56,84, J.-L. Puget55, J. P. Rachen18,72, W. T. Reach86,
R. Rebolo60,13,35, M. Reinecke72, M. Remazeilles63,55,1, C. Renault69, I. Ristorcelli85,9, G. Rocha62,10, G. Roudier1,66,62, B. Rusholme53, M. Sandri46, D. Santos69, D. Scott19, L. D. Spencer79, V. Stolyarov5,64,82, A. W. Strong73, R. Sudiwala79, R. Sunyaev72,80, D. Sutton58,64, A.-S. Suur-Uski23,41, J.-F. Sygnet56, J. A. Tauber38, L. Terenzi39,46, L. Tibaldo89, L. Toffolatti17,61,46, M. Tomasi31,47, M. Tristram65, M. Tucci16,65,
G. Umana42, L. Valenziano46, J. Valiviita23,41, B. Van Tent70, P. Vielva61, F. Villa46, L. A. Wade62, B. D. Wandelt56,84,27, I. K. Wehus62, D. Yvon14, A. Zacchei45, and A. Zonca26
(Affiliations can be found after the references) Received 10 September 2014/ Accepted 25 February 2015
ABSTRACT
The nearby Chamaeleon clouds have been observed in γ rays by the Fermi Large Area Telescope (LAT) and in thermal dust emission by Planck and IRAS. Cosmic rays and large dust grains, if smoothly mixed with gas, can jointly serve with the H
and12CO radio data to (i) map the hydrogen column densities, NH, in the different gas phases, in particular at the dark neutral medium (DNM) transition between the H
-bright and CO-bright media; (ii) constrain the CO-to-H2conversion factor, XCO; and (iii) probe the dust properties per gas nucleon in each phase and map their spatial variations across the clouds. We have separated clouds at local, intermediate, and Galactic velocities in H
and12CO line emission to model in parallel the γ-ray intensity recorded between 0.4 and 100 GeV; the dust optical depth at 353 GHz, τ353; the thermal radiance of the large grains; and an estimate of the dust extinction, AVQ, empirically corrected for the starlight intensity. The dust and γ-ray models have been coupled to account for the DNM gas. The consistent γ-ray emissivity spectra recorded in the different phases confirm that the GeV–TeV cosmic rays probed by the LAT uniformly permeate all gas phases up to the12CO cores. The dust and cosmic rays both reveal large amounts of DNM gas, with comparable spatial distributions and twice as much mass as in the CO-bright clouds. We give constraints on the H
-DNM-CO transitions for five separate clouds. CO-dark H2dominates the molecular columns up to AV ' 0.9 and its mass often exceeds the one-third of the molecular mass expected by theory. The corrected AVQextinction largely provides the best fit to the total gas traced by the γ rays. Nevertheless, we find evidence for a marked rise in AVQ/NHwith increasing NHand molecular fraction, and with decreasing dust temperature. The rise in τ353/NHis even steeper. We observe variations of lesser amplitude and orderliness for the specific power of the grains, except for a coherent decline by half in the CO cores. This combined information suggests grain evolution. We provide average values for the dust properties per gas nucleon in the different phases. The γ rays and dust radiance yield consistent XCOestimates near 0.7 × 1020cm−2K−1km−1s. The AVQand τ353tracers yield biased values because of the large rise in grain opacity in the CO clouds. These results clarify a recurrent disparity in the γ-ray versus dust calibration of XCO, but they confirm the factor of 2 difference found between the XCOestimates in nearby clouds and in the neighbouring spiral arms.Key words.ISM: structure – gamma rays: ISM – cosmic rays – dust, extinction – local insterstellar matter
? Appendices are available in electronic form athttp://www.aanda.org ?? Corresponding author: I. Grenier,[email protected]
1. Introduction
The interstellar gas reserves of the Milky Way are commonly evaluated by means of a large set of multiwavelength tracers. Frequently used are the ubiquitous 21 cm line emission from atomic hydrogen (H
, seeKalberla et al. 2010), the widespread 2.6 mm line emission from12CO as a proxy for H2 molecules
(Dame et al. 2001;Planck Collaboration XIII 2014), submillime-tre to infrared thermal emission from dust grains mixed with the gas (Planck Collaboration XXI 2011), and γ rays with energies above a few hundred MeV spawned by cosmic rays (CRs) per-meating the gas and interacting with its nucleons (Strong et al. 1988). Knowledge of the mass, physical state, volume distribu-tion, and dynamics of the different gas phases is the key to un-derstanding the life cycle of the interstellar medium (ISM) in our Galaxy. To this end we need to carefully investigate the va-lidity domain of the total-gas tracers and to quantify their de-parture from a linear behaviour due to radiation transfer and/or environmental evolution. In this context, the synergy between the Planck1and Fermi LAT all-sky surveys offers new perspec-tives to study the properties and limitations of these tracers in the multi-phase complexity of clouds down to parsec scales in the solar neighbourhood.
1.1. Specific goals
The ISM is optically thin to thermal dust emission at far in-frared to millimetre wavelengths. The emission arises from large grains in thermal equilibrium with the ambient interstellar radi-ation field (ISRF). Several studies have reported an apparent in-crease in dust emissivity (intensity radiated per gas nucleon) and opacity (optical depth per gas nucleon) with increasing gas col-umn density in both the atomic and molecular gas (Stepnik et al. 2003;Planck Collaboration XXIV 2011;Martin et al. 2012;Roy et al. 2013;Ysard et al. 2013;Planck Collaboration XI 2014; Planck Collaboration Int. XVII 2014). Interestingly, this might be a hint of dust evolution across the gas phases. Alternatively, dust opacities can be underestimated because of irradiation and temperature changes along the lines of sight, and overestimated by underrating the total gas for reasons that include significant H
opacity, insufficient sensitivity to CO emission, significant amounts of CO-dark H2, and opaque CO in dense regions. Inthis context, the joint analysis of the interstellar γ radiation and thermal dust emission can help constrain the total gas column density, NH, in order to follow variations of the dust properties.
For a uniform CR irradiation through a cloud, the γ rays pro-vide a measure of the total gas, regardless of its thermodynamic and chemical state, and without absorption limitations across the whole Galaxy. They thereby give valuable insight into (i) satura-tion correcsatura-tions to NH column densities in the cloud; (ii) the
in-situ CO-to-H2 conversion for the derivation of H2 column
densities; and (iii) the mass content of the dark neutral medium (DNM) that escapes radio and millimetre surveys in the form of optically thick H
and/or CO-dark H2. Irregular CRdeple-tion or concentradeple-tion inside a cloud can be tested using spectral variations because of the energy dependent propagation of the particles through the magnetic field as they resonantly diffuse on small-scale magnetic turbulence or by focusing or mirroring 1 Planck (http://www.esa.int/Planck) is a project of the European Space Agency (ESA) with instruments provided by two sci-entific consortia funded by ESA member states (in particular the lead countries France and Italy), with contributions from NASA (USA) and telescope reflectors provided by a collaboration between ESA and a scientific consortium led and funded by Denmark.
on the larger-scale structure of the magnetic field. The current γ-ray observations span two to three decades in particle energy and can be used to test these effects.
The integrated J= 1 → 0 CO line intensity, WCO, is often
assumed to scale linearly with the NH2 column density (Dame
et al. 1987), but the value of the conversion factor, XCO ≡
NH2/WCO, remains uncertain, both in the solar neighbourhood
(Abdo et al. 2010;Pineda et al. 2010;Planck Collaboration XIX 2011;Ackermann et al. 2012a) and at large scales in the Galaxy along the metallicity and UV-flux gradients (Strong et al. 2004; Abdo et al. 2010;Ackermann et al. 2011b;Pineda et al. 2013; Bolatto et al. 2013). Cloud-to-cloud variations in average XCO
can reflect dynamical differences in the relative mass contained in the molecular envelopes (more exposed to CO photodissoci-ation, thus with a higher XCO) and in well-shielded cores (with
lower XCO,Sheffer et al. 2008). Dust and γ-ray proxies for the
total gas have been used separately to measure XCO in di
ffer-ent locations, at different angular resolutions, and with different methods, leading to discrepant values (seeBolatto et al. 2013, for a review of past references). We aim to compare the calibra-tion of XCOwith dust and γ rays in the same cloud and with the
same method for the first time.
At the atomic-molecular interface of the ISM, a combination of H
and H2 gas with little or no CO can escape the H
andCO surveys because of high levels of H
self-absorption and low levels of CO excitation. Such a mix of DNM has been the-oretically predicted in translucent clouds (1 ≤ AV ≤ 5 mag) ortranslucent envelopes of giant molecular clouds (van Dishoeck & Black 1988). In this zone, a large fraction of H2 is
associ-ated with C0and C+instead of with CO because H2is more
effi-cient at self-shielding against UV dissociation than CO. The lack of correlation between the OH column-density and WCO
sug-gests large quantities of H2that are either unseen in CO surveys
(Barriault et al. 2010; Allen et al. 2012) or detectable only by summing lines over wide regions without any mapping (Pineda et al. 2010).
The γ-ray studies have revealed the ubiquity of the DNM, both in mass fraction and spatial extent (Grenier et al. 2005). In the solar neighbourhood, it appears to be as extended as the dense H
and as massive as the CO-bright H2. Recentanaly-ses of Fermi data have confirmed its ubiquity in nearby clouds (Abdo et al. 2010; Ackermann et al. 2012a). It contributes al-most one million solar masses in the star-forming complex of Cygnus X (Ackermann et al. 2012b). The DNM presence has been repeatedly suggested in dust studies as emission excesses over the NH and WCO expectations (Blitz et al. 1990; Reach
et al. 1994,1998;Magnani et al. 2003;Lee et al. 2012;Planck Collaboration XXI 2011). According to the Planck data, little CO emission has been missed outside the boundaries of the present 2.6 mm surveys, down to a sensitivity of 1 or 2 K km s−1
(Planck Collaboration XIII 2014). Fainter CO cannot account for the brightness of the excesses seen off the Galactic plane (Planck Collaboration XIX 2011). DNM mass fractions, however, re-main uncertain for various causes: from dust emission because of the potential emissivity variations mentioned above (Planck Collaboration XXI 2011;Planck Collaboration XIX 2011); from dust stellar reddening because of the uncertain colour distribu-tion of the background star populadistribu-tion, the contaminadistribu-tion of unreddened foreground stars, and some incompleteness along the lines of sight (Paradis et al. 2012;Ackermann et al. 2012b); and from C+ line emission at 158 µm because of the difficult separation of the contributions from the DNM, the atomic cold neutral medium (CNM), and photon-dominated regions (PDR; Pineda et al. 2013;Langer et al. 2014).
In this context, we aim to couple the total gas tracing capa-bility of the CRs and of dust emission to extract reliable column densities in the DNM and to characterize the transition between the H
-bright, DNM, and CO-bright media in a nearby cloud complex.1.2. Choice of cloud
With its proximity, its moderate molecular mass of the order of 104 M
(Mizuno et al. 2001), and its moderate star-formation
activity, the Chamaeleon-Musca complex provides a useful tar-get to probe gas tracers in the 1020−22cm−2 range in NH. The
clouds lie at distances of 140−180 pc (Mizuno et al. 2001) or 120−150 pc (Corradi et al. 2004). We adopt a distance of 150 pc for mass derivations, but we note that the NHmeasurements do
not depend on this choice.
Because of its location at relatively high Galactic latitudes and with typical linear sizes of 10−20 pc, variations in column density are more likely to reflect changes in volume density than pile-up along the line of sight or confusion with background structures. The available observations have angular resolutions ranging from 50to 150that limit the cross-talk between the
struc-tures of the different gas phases.
The Chamaeleon clouds should be bathed in a relatively uni-form ISRF. The lack of OB stellar clusters ensures a relatively quiet environment in terms of: (i) UV irradiation for dust heat-ing; (ii) photo-ionization with little H
mass; (iii) stellar-wind turbulence for standard CR diffusion (unlike in the turbulent Cygnus X, Ackermann et al. 2011a); and (iv) lack of internal CR sources in the form of supernova remnants. Early Fermi LAT analyses have shown that the clouds are pervaded by a CR flux close to the average in the local ISM and with an en-ergy spectrum, the so-called Local Interstellar Spectrum (LIS), that is consistent with particle measurements in the solar system (Ackermann et al. 2012a).The derivation of the dust spectral energy distribution (SED) so far from the ecliptic plane is minimally affected by uncer-tainties in the zodiacal light removal from the IRAS and Planck data (Planck Collaboration XI 2014). The subtraction of the mological microwave background and fluctuations in the cos-mic infrared background do not significantly affect the bright SEDs (Planck Collaboration XI 2014). The clouds also lie con-veniently away from the Fermi bubbles that dominate the γ-ray sky at energies above a few GeV (Su et al. 2010;Ackermann et al. 2014).
1.3. Analysis rationale
We can take advantage of the sensitivity, angular resolution, and broad frequency coverage of Planck and Fermi LAT to reassess the relationship between GeV γ rays, dust emission, and H
and CO line intensities. We defer the joint analysis of γ rays and dust extinction or reddening to later work. We use instead two spectral characterizations of the dust thermal emission re-cently proposed to match the Planck, IRAS, and Wide-field Infrared Survey Explorer (WISE) data. The first is based on modified blackbody spectra parametrized by the optical depth at 353 GHz, τ353, the temperature T , and spectral index β (PlanckCollaboration XI 2014). The second uses the physical model of Draine & Li(2007) to estimate the dust optical extinction and to renormalize it according to the starlight intensity (Umin,
de-fined in Sect.2.2) to better match reddening measurements from quasars (Planck Collaboration Int. XXIX 2015). We denote this corrected extinction AVQhereinafter. To follow spatial variations
in the dust heating rate, we have also considered a third dust tracer, the radiance R, which is the bolometric integral of the thermal intensity (Planck Collaboration XI 2014).
The atomic gas largely dominates the mass budget. Consequently it is the largest contributor to the γ-ray and dust signals. Atomic clouds in different locations and states may have different CR or dust content, so we have developed a careful kinematical separation of the different H
structures present in the region under study. We have distinguished the H
gas asso-ciated with the star-forming CO clouds, an intermediate-velocity H
arc crossing the field, and the Galactic H
background.The γ-ray emission detected toward the Chamaeleon region is shown in Fig.1. It is dominated by hadronic interactions be-tween CR and gas nuclei. The ISM itself is transparent to γ rays at these energies. Earlier studies have indicated that the bulk of the Galactic CRs radiating in the energy bands selected for this work have diffusion lengths far exceeding typical cloud dimen-sions (Hunter et al. 1997; Abdo et al. 2010;Ackermann et al. 2011b). They also indicate an efficient CR penetration in all the gas phases studied here (H
, DNM, and CO-bright). The in-terstellar part of the γ-ray emission can therefore be modelled, to first order, as a linear combination of the gas column den-sities summed for the various gas phases and different clouds present along the lines of sight. The γ-ray intensity I(l, b, E) in the (l, b) Galactic direction and at energy E can be expressed as I(l, b, E) = Pi∈{HI1,HI2,...,CO,DNM}qi(E) Ni(l, b)+ . . . The qi(E)parameters are to be determined by fits to the Fermi data. They bear information on the CR flux and gas mass in the different interstellar structures. The model includes other sources of non-gaseous origin (e.g. point sources) that are detailed in Sect.3.2.
The ISM is also optically thin to the thermal emission of large dust grains. For a uniform dust-to-gas mass ratio, RDG,
and uniform mass emission coefficient, κν, of the grains in a cloud, the dust column density can be modelled to first order as a linear combination of the gas column densities in the dif-ferent phases and clouds: if we denote with D ∈ {AV Q, τ353, R}
any of the three dust tracers, we can express it as D(l, b) = P
i∈{HI1,HI2,...,CO,DNM}yiNi(l, b)+ . . . The yicoefficients are to be
fitted to the data of the D(l, b) tracer. They give measures of the average dust properties per gas nucleon in the different inter-stellar structures, namely the AVQ/NHratio, the opacity τ353/NH
at 353 GHz, and the specific power 4πR/NHof the grains. The
models are detailed in Sect.3.3.
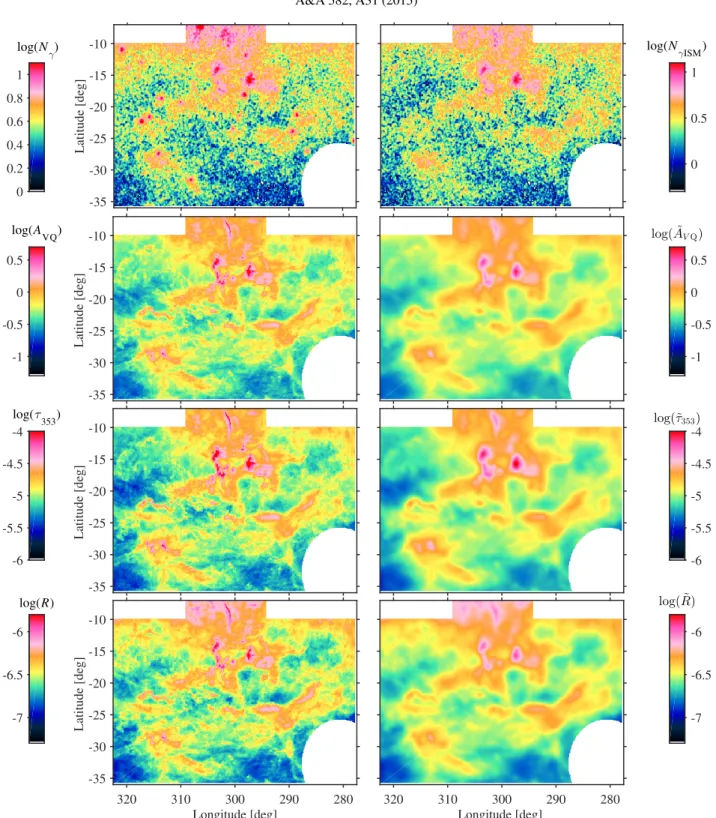
The interstellar γ-ray emission and the dust tracers shown in Fig.1exhibit very strong structural similarities. They reflect the common presence of CRs and dust in the H
and CO bright media, but also in the DNM, for which we have no independent template. This inconspicuous phase, however, shows up jointly as γ-ray and dust emission excesses over NHand WCOexpec-tations, with comparable spatial distributions. We have therefore iteratively coupled the γ-ray and dust models to account for the DNM contribution to the total gas. The method is described in Sect.3.4. The use of the γ rays and of three different dust tracers enables tests of the robustness of the DNM reconstruction.
In order to show the spatial distributions of the dust and γ rays at the angular resolution sampled by the LAT, we have convolved the dust maps with the energy-dependent response of the LAT. To do so, we have assumed the γ-ray emissivity spec-trum qLISof the local interstellar matter. The maps of the
LAT-averaged quantities, ˜AVQ, ˜τ353, and ˜R, are shown in Fig.1for
the overall energy band. They illustrate the close resemblance in spatial distribution between the dust and γ-ray photon counts of interstellar origin. Figure 1 also shows that the three dust maps largely agree on the overall distribution of the grains at
Latitude [deg] -35 -30 -25 -20 -15 -10 0 0.2 0.4 0.6 0.8 1 log(N γ) 0 0.5 1 log(N γISM) Latitude [deg] -35 -30 -25 -20 -15 -10 -1 -0.5 0 0.5 log(AVQ) -1 -0.5 0 0.5 log( ˜AVQ) Latitude [deg] -35 -30 -25 -20 -15 -10 -6 -5.5 -5 -4.5 -4 log(τ 353) -6 -5.5 -5 -4.5 -4 log(˜τ353) Longitude [deg] 280 290 300 310 320 Latitude [deg] -35 -30 -25 -20 -15 -10 -7 -6.5 -6 log(R) Longitude [deg] 280 290 300 310 320 -7 -6.5 -6 log( ˜R)
Fig. 1.Maps toward the Chamaeleon region of the γ-ray counts recorded in the 0.4−100 GeV band and of the dust quantities (modified extinction AVQ in magnitudes, optical depth τ353, and radiance R in W m−2sr−1). The total γ-ray photon counts are shown on the left and those spawned by cosmic-ray interactions with gas (after subtraction of other ancillary components) on the right. The γ-ray maps have been constructed on a 7.0
5 pixel grid and smoothed with a Gaussian kernel of 00.1 for display. The dust quantities are shown at 50
resolution in the left panels, and at the FermiLAT resolution on the right (after convolution with the energy-dependent response function of the LAT, assuming the local interstellar γ-ray spectrum over the 0.4−100 GeV band, tilded variables). Regions excluded from the analysis have been masked out.
the original 50resolution, but that they significantly differ in
con-trast (see e.g. at latitudes b > −15◦). The radiance has 3 times less dynamical range than the optical depth, in particular toward the densest molecular zones. The dynamical range of AVQ is
intermediate between that in R and τ353. These differences are
still present when seen at the LAT resolution. They signal poten-tial variations of the dust properties per gas nucleon that can be tested against the independent γ rays.
1.4. Contents
The paper is organized as follows. Section2presents the γ-ray, dust, H
, and CO data; Sect.3summarizes the models developed to study the H
, CO, and DNM contributions to the dust and γ-ray data, and how the DNM templates are built. In Sect.4, we describe the results of the model fits, their errors, and the impact of the H
optical depth correction. Sections5 and6 focus onthe CR spectrum pervading the different gas phases and on the column-density maps inferred for the DNM. In Sects.7and8we discuss the results on the XCOfactors and the average dust
prop-erties in each phase. In Sect.9, we present evidence for a marked evolution in dust opacity and a milder evolution in AVQ/NH
ra-tio and specific power as the gas becomes denser. In Sect. 10, we discuss the transitions between the different gas phases in five separate clouds within the local complex. We summarize the main conclusions and discuss follow-on studies in the last sec-tion. AppendicesAtoEpresent additional information on the kinematical separation of the H
structures, checks on the WCOcalibration, fits without a DNM contribution, and the table of qi
and yicoefficients.
2. Data
We have selected a region around the Chamaeleon complex at Galactic longitudes 277.5◦ ≤ l ≤ 322.5◦ and latitudes −36◦ ≤ b ≤ −7◦, and we have masked a disc around the
Large Magellanic Cloud and toward regions with large con-tamination from gas in the Galactic disc, at −10◦ ≤ b ≤ −7◦
and l < 294◦ or l > 309◦. The analysis region is shown in Fig. 1. We have selected a broad region to provide enough contrast in the diffuse H
gas. All maps are projected on the same 0.125◦-spaced Cartesian grid as that of the CO survey from the Harvard-Smithsonian Center for Astrophysics (CfA). A finer grid would oversample the Parkes Galactic All Sky Survey (GASS, McClure-Griffiths et al. 2009) H
data and yield too many empty bins, with zero photons, at high energy in γ rays. 2.1.γ-ray dataWe have analysed five years of LAT survey data, starting on 5 August 2008. We have applied tight rejection criteria (CLEAN class selection, photon arrival directions within 100◦of the Earth zenith and time intervals when the LAT rocking angle was be-low 52◦) in order to reduce the contamination by residual CRs and γ rays from the Earth atmospheric limb (see Nolan et al. 2012for details). To improve the LAT angular resolution below 1.6 GeV, we have kept only the photons that converted to pairs in the front section of the tracker (Atwood et al. 2009). At higher energy, we took all photons that produced pairs in the front and back sections of the tracker. We have used the reprocessed Pass 7 photon data, its associated instrument response functions (IRFs, version P7REP-V15) and the related isotropic spectrum2.
The LAT exposure was calculated for the adopted photon selec-tion with the RELEASE-09-32-05 of the LAT Science Tools3.
Systematic errors on the LAT sensitive area increase from 5% to 10% with energy over the 0.4−100 GeV range selected for the analysis (Ackermann et al. 2012c).
We have calculated the effective point-spread-function (PSF), the exposure map, the γ-ray emissivity spectrum qLIS
of the local interstellar gas (Casandjian 2012) and the spectrum of the isotropic background in 12 energy bins, with a bin width of 0.2 dex, and centred from 102.7to 104.9MeV. To ensure
statis-tics robust enough to follow details in the spatial distributions of the different interstellar components, we have analysed the data in 4 broader and independent energy bands, bounded by 102.6, 102.8, 103.2, 103.6, and 105 MeV. We have also analysed 2 http://fermi.gsfc.nasa.gov/ssc/data/access/lat/ BackgroundModels.html
3 The Science Tools are available from the Fermi Science Support Center,http://fermi.gsfc.nasa.gov/ssc/
the entire 102.6−105 MeV interval as a single band. The LAT energy resolution decreases from 15% to 8% across these ener-gies. Given the large width of the analysis bands, we have not corrected the fluxes for the energy resolution.
The LAT PSF is strongly energy-dependent (Atwood et al. 2009). For the local interstellar spectrum (LIS), the half widths at half maximum of the effective PSF are respectively 0.◦44, 0.◦27, 0.◦16, 0.◦07 with increasing energy in the four bands, and 0.◦14 in
the overall band. To account for the spillover of γ-ray emission produced outside the analysis region, we have modelled both point sources and interstellar contributions in a region 4◦wider
than the region of analysis. This choice corresponds to the 99.5% containment radius of the PSF in the lowest energy band.
The observed γ-ray emission also includes a contribu-tion from the large-scale Galactic inverse Compton (IC) emis-sion emanating from the interactions of CR electrons with the ISRF. It can be modelled with GALPROP4, version 5.4. The run
54-LRYusifovXCO4z6R30-Ts150-mag2 has been tested against the LAT data (Ackermann et al. 2012d). It assumes a 30 kpc ra-dius for the Galaxy and a radial distribution of CR sources such as pulsars in the Galactic plane. The particles are allowed to dif-fuse in the plane and into a halo that is 4 kpc high. We have used this run to generate an energy-dependent template of the Galactic inverse Compton emission across the field of view.
2.2. Dust data
We have used the all-sky maps of the dust optical depth τ353,
temperature T , and spectral index β, which were constructed at an angular resolution of 50 from the combined analysis of the Planck 857, 545, and 353 GHz data, and of the IRAS 100 µm data (product release 5,Planck Collaboration XI 2014). Compared to previous works (e.g.Schlegel et al. 1998), the use of the Planck data has greatly improved in precision and in an-gular resolution the spectral characterization of the dust emis-sion, in particular in regions of large temperature contrast in-side molecular clouds and near stellar clusters or IR sources. We summarize here important aspects of this characterization.
Modified blackbody intensity spectra, Iν= τν0Bν(T )(ν/ν0)
β,
where Bν(T ) is the Planck function for dust at temperature T , were fitted to the observed SED in each direction. The fits were performed at 300 resolution with τ
ν0, T , and β as free
param-eters. The fits were then repeated at 50 resolution by fixing β as obtained in the first step. This procedure limited the noise impact on the T –β degeneracy. SEDs were checked to be con-sistent with the data at all frequencies (see Fig. 11 inPlanck Collaboration XI 2014), in particular in bright interstellar areas such as the Chamaeleon region. We note that the contamination from CO line emission in the 353 GHz filter band, amounting to a few per cent of the signal, was not removed, so as to avoid adding large noise in all directions away from CO clouds.
The derivation of the optical depth, τν, and opacity, σν, at frequency ν follows the relations
τν= Iν Bν(T ) = σνNH= κ0 ν ν0 !β RDGµHNH (1)
for the observed specific intensity Iν of the dust emission,
the Planck function Bν(T ) at temperature T , the hydrogen column density NH, the mean gas mass per hydrogen atom
µH= 2.27 × 10⁻²⁷ kg, the dust-to-gas mass ratio RDG, and 4 http://galprop.stanford.edu/
the mass emission or absorption coefficient κ0at reference
fre-quency ν0. We have used the map of optical depth, τ353,
esti-mated at 353 GHz, and its associated uncertainty.
The radiance, in W m−2sr−1, gives the integral in frequency
of the thermal spectrum and it relates to the specific power,Π, radiated per gas nucleon as
R= τ353 Z ∞ 0 ν ν353 !β Bν(T )dν= Π NH 4π · (2)
We have propagated the errors on τ353, T , and β to calculate the
uncertainties on the radiance. These uncertainties are upper lim-its to the real values, since we could not include the negative covariance terms between the anti-correlated T and β (Planck Collaboration XI 2014). Within the region of analysis, the op-tical depth uncertainties range from 2% to 4% and the radiance uncertainties range from 10% to 20%, with a strong peak in fre-quency around 14%.
The dust model of Draine & Li (2007) has also been fit-ted to the SEDs recorded by Planck, IRAS, and WISE from 12 to 850 µm (Planck Collaboration Int. XXIX 2015). All-sky maps were thereby constructed for the mass surface density of the dust, the optical extinction, the mass fraction locked up in PAH grains, and the lower Umin cutoff in the U−2 distribution
of starlight intensities heating the bulk of the grains. The com-parison between the resulting extinction values and independent estimates based on quasar colours has revealed deviations that significantly correlate with Umin. The modelled extinction has
thus been renormalized according to Uminto compensate for this
bias (Planck Collaboration Int. XXIX 2015). For our work, we have used the renormalized AVQextinction map at 50resolution
(denoted QDL07 byPlanck Collaboration Int. XXIX 2015). We stress that AVQis a quantity drawn from the thermal emission of
the grains, in spite of its absorption-related name. We also note that the physical parameters of the Draine & Li(2007) model yield poorer fits to the observed SEDs than modified blackbody spectra. Nonetheless, we show below that, after renormalization, the AVQmap is better correlated with the interstellar γ rays than
the optical depth deduced from the modified blackbody charac-terization (see Fig.1and the results in Sect.3).
The τ353, radiance, and AVQmaps have been derived with the
Planckdata from the first release. We have checked that the re-sults of the present work are not significantly changed when we use the most recent version of the Planck data available within the Planck consortium.
2.3. HI data and kinematical component separation
The H
Galactic All Sky Survey (GASS) is the most sensi-tive and highest resolution survey of 21 cm line emission of the southern sky (McClure-Griffiths et al. 2009). We have used the GASS data corrected for stray radiation, instrumental base-lines and radio interference contamination, and with both IFs to remove the negative ghosts occasionally caused in frequency-switching mode by the presence of high-velocity-cloud lines in one of the bands (Kalberla et al. 2010). We have used the GASS data server5 to resample the original data cubes ontoour spatial grid. Our choice of 0.◦1 for the Gaussian interpo-lation kernel gives an effective full width at half maximum (FWHM) resolution of 14.05 and a root-mean square (rms) noise
of 0.07 K per channel. We have kept the original velocity resolu-tion of 0.82 km s−1in the 3D (longitude, latitude, velocity) cube. 5 http://www.astro.uni-bonn.de/hisurvey/gass/index. php
All velocities mentioned hereinafter are given with respect to the local standard of rest.
Line profiles in the 3D cube have been used to kinematically separate the four main structures that can be distinguished in velocity (see Fig.A.1), namely:
– the local atomic gas in the Chamaeleon complex;
– the gas in an intermediate velocity arc (IVA), crossing the whole region around −25◦in latitude;
– the more distant gas at large height above the Galactic plane; – gas from the Large Magellanic Cloud (LMC) and its tidal
tails.
The wide velocity range of the IVA component, spanning the −40 ≤ v ≤ −4 km s−1interval, is due to very broad line wings in
addition to a small velocity gradient along the structure. The ori-gin and distance of this dynamically unusual cloud are unknown; it is half as massive as the nearby Chamaeleon region if it is at the same distance.
The four features are well defined in the longitude, latitude, velocity (l, b, v) cube, but they occasionally merge because of the gas dynamics and large line widths. In order to separate them, we have developed a specific separation scheme which is described in AppendixA. It is based on fitting each H
spectrum as a sum of lines with pseudo-Voigt profiles. The prior detection of line peaks and shoulders in each spectrum limits the number of lines to be fitted and it provides objective initial values for their veloc-ity centroids. All fits match the data to better than 80 or 90% of the total intensity. In order to preserve the total intensity exactly, the small residuals between the modelled and observed spectra have been distributed among the fitted lines according to their relative strength in each channel.We have defined 3D boundaries in longitude, latitude, and velocity for each of the four components. The spatial separa-tions between the IVA and Galactic disc components on the one hand, and between the Galactic disc and LMC components on the other, run along curves of minimum intensity at medium lat-itudes. The details are given in AppendixA.
We have constructed the NH column-density map of each
component by selecting the lines with centroids falling within the appropriate velocity interval, depending on the (l, b) di-rection, and by integrating their individual profiles in velocity. This procedure gives more reliable column-density estimates than a direct integration of the H
spectra over the chosen velocity interval. The difference is exemplified in the case of two partially overlapping lines with different peak temperatures. Integrating the observed spectrum in velocity on both sides of a boundary set between the lines would incorrectly attribute the intensity of the wings spilling over the boundary. The large over-(under-)estimation of NHfrom the weak (bright) line wouldaf-fect the derivation of average cloud properties per gas nucleon in both components. The method used here corrects for the line spillover across velocity boundaries. It also avoids sharp spatial jumps across the resulting maps. This approach thereby enables the exploration of differences in CR and dust volume densities in different structures along the line of sight.
We have checked that changes in velocity cuts of a few km s−1 have little impact on the resulting N
H maps. The lines of the local and IVA components strongly overlap in velocity around l= 283◦ and b= −25◦. Changing the velocity cut by 1
or 2 km s−1 results in a 3 to 6% change in the total mass in the corresponding velocity range. The difference arises mainly from the region of strong overlap.
We have integrated the line profiles for a given choice of spin temperature (Ts) to correct for the H
optical depth. The sameN HI IVA Latitude [deg] -35 -30 -25 -20 -15 -10 N HI Cha N HI Gal Longitude [deg] 280 290 300 310 320 Latitude [deg] -35 -30 -25 -20 -15 -10 19.5 20 20.5 21 21.5 log(N HI) Musca Musca Cha I Cha II+III Cha East I Cha East II W CO Longitude [deg] 280 290 300 310 320 -0.5 0 0.5 1 log(W
CO) Fig. 2. Maps of the NH column densities (in cm−2) and W
CO line intensities (in K km s−1) obtained for different velocity components in the analysis region: NHfor the intermediate velocity arc; NHand WCOfor the local Chamaeleon com-plex; and NHfor the Galactic disc background. The NHcolumn densities have been obtained for optically thin emission. The solid black contour marks the analysis region. The dashed rectangles outline the boundaries of the five substructures described in Sect.2.5and analysed in Sect.10.
temperature correction has been applied to all H
components. In addition to the optically thin case, maps have been produced for uniform spin temperatures of 125, 200, 300, 400, 500, 600, 700, and 800 K.The maps obtained for the optically thin case are shown in Fig. 2. Within the region of analysis, the local, IVA, and Galactic disc components exhibit a comparable range of column-densities, with peak values in slight excess of 1021cm−2. With comparable intensities, but distinct spatial distributions, they can be treated as independent components contributing to the overall dust or γ-ray emission.
We have checked that the anti-correlation that can be seen in Fig. 2 between the local and IVA components corresponds to the presence of two lines of different brightness along those directions. Examples are given in AppendixA. The trough that crosses the local Chamaeleon map is visible in Fig.A.1at posi-tive velocities prior to any component separation. One may spec-ulate that a large-scale shock has expelled gas from the low ve-locity Chamaeleon region and caused both the anti-correlation and the unsually broad wings of the IVA lines.
2.4.12CO data
To trace the distribution of the 12CO (J= 1 → 0) emission at 115 GHz, we have used the NANTEN observations of the Chamaeleon clouds with a 2.06 beam, 80spacing grid, 0.1 km s−1
velocity resolution, and a typical noise below 0.4 K per channel (Mizuno et al. 2001). Because of the undersampling, we have checked the NANTEN WCO intensities against the fully
sam-pled CfA survey data (8.08 FWHM beam with 7.05 spacing, from
Boulanger et al. 1998) across the subset of clouds that have been observed by both instruments (Cham I, II, and III). After re-moving negative ghosts and flattening baselines in the NANTEN data cube (see Appendix Cfor details), we have obtained con-sistent intensities between it and data from the CfA survey. Unlike what was found in other high-latitude regions (Planck Collaboration XIX 2011), Fig. C.1 shows that the NANTEN and CfA photometries fully agree in this region. The deriva-tion of the XCOfactor from the present analyses therefore can
be directly compared to previous estimations based on CfA data in the solar neigbourhood (Abdo et al. 2010;Ackermann et al. 2012a,e;Bolatto et al. 2013).
The ground-based data were preferred over the Planck CO products for the present work because of the high noise level in the Planck TYPE 1 CO map and because the dust optical depth was used in the component separation to extract the Planck TYPE 3 CO map (Planck Collaboration XIII 2014). FigureC.1 also shows a systematic photometric difference between the measurements by Planck and the two radio telescopes. Re-analysing the Planck data for CO in this specific region is beyond the scope of this paper, however.
The most sensitive (TYPE 3) Planck CO map shows only three tiny clumps beyond the boundary of the NANTEN survey. They lie at low latitude to the west of the Cha East II cloud in Fig.2. Because of their small intensity, <5 K km s−1, and small extent, <0.25 deg2, and because of the photometry mismatch
be-tween the Planck and radio line data, they were not added to the WCOmap. Their absence does not affect the XCOresults or the
CO-cloud masses presented below.
The CO line velocities span −12 to +8 km s−1 (see Fig. 3
of Mizuno et al. 2001). The cloudlet detected at −12 < v < −4 km s−1appears to be an extension of the local complex rather
than a molecular counterpart to the intermediate velocity arc. We did not attempt to separate its small contribution as an indepen-dent component. We have thus integrated the CO lines over the whole −12 ≤ v ≤+8 km s−1interval to produce the WCO
inten-sity map shown in Fig.2.
We have also used the moment-masked CfA CO survey of the Galactic plane (Dame et al. 2001; Dame 2011) to com-plement the NANTEN data at low latitudes. We have checked that, when convolved with the LAT PSF, the contribution of the Galactic disc emission inside the analysis region is too faint to be detected as an additional component in the γ-ray analyses presented below. This is even more true for the dust analyses be-cause of their better angular precision, so we have dropped the Galactic disc contribution from these analyses.
2.5. Individual substructures
In order to study the relative contributions of the different gas phases to the total column density, we have considered five separate substructures in the complex, away from the zone where H
lines may overlap between the local and IVA components:– Cha I at 285◦≤ l< 299.◦5, −20.◦5 ≤ b ≤ −11.◦4; – Cha II+III at 299.◦5 ≤ l < 308◦, −23◦≤ b ≤ −11.◦4;
– Cha East I at 308◦≤ l ≤ 319◦, −23.◦5 ≤ b ≤ −18◦; – Cha East II at l ≥ 300◦, b ≤ −26◦.
These limits and names, which are shown in Fig. 2, approxi-mately followMizuno et al.(2001).
2.6. Ionized gas
In view of the very faint diffuse free-free emission detected at 40 GHz across this field in the nine years of observations of WMAP, we have ignored the contribution from the warm ion-ized gas in this study. To verify this assumption, we have taken the 9-year free-free map, based on the maximum-entropy sepa-ration and the extinction-corrected Hα map as a prior (Gold et al. 2011). We have translated the intensities into H
column densi-ties for a gas temperature of 104K and effective electrondensi-ties of 2 or 10 cm−3(Sodroski et al. 1997). The resulting column densities, in the 1014−15cm−2range, show little spatial contrast.
Such a quantitatively small and spatially smooth contribution to the total gas column density would not be detected against the other more massive and more structured gaseous components.
3. Models and analyses 3.1. Gas components on test
All the analyses use only four H
and CO maps: – the NHmap from the local Chamaeleon clouds; – the NHmap from the intermediate velocity arc; – the NHmap from the Galactic disc;– the WCOmap from the local Chamaeleon clouds.
Faint H
emission from the LMC outskirts and its streams is present in the analysis region. This emission has not been de-tected in the γ-ray and dust fits presented in Sects.3.2and3.3. There is no detection either of the faint CO emission from the Galactic disc background near the low latitude edge of the re-gion. Both these components have thus been dropped from the analyses. In addition to the four H
and CO components listed above, we have constructed DNM templates from the γ-ray data and dust tracers, so that any analysis uses a total of five gaseous components.We have performed multivariate fits to separate and study the individual contribution of each component to the γ-ray and dust data shown in Fig.1. We have performed three studies in paral-lel, jointly analysing either the γ rays and AVQmaps (γ+AVQ),
the γ rays and dust optical depth (γ+τ353), or the γ rays and dust
radiance (γ+R).
3.2.γ-ray model
Because of the arguments presented in Sect. 1.3 on the ISM transparency to γ rays and on the smooth penetration of cos-mic rays through the different forms of gas probed by the H
and CO lines or in the intermediate DNM phase, we have mod-elled the γ-ray emission as a linear combination of template maps representing the different ISM components. The model also includes a contribution from the Galactic IC emission, point sources of non-interstellar origin, and an isotropic flux to ac-count for the extragalactic γ-ray background and for any residual cosmic rays misclassified as γ rays.The γ-ray intensity in each (l, b) direction, I(l, b, E) in γ cm−2s−1sr−1MeV−1, is modelled at each energy E as
I(l, b, E)= qLIS(E) ×
3 X i=1 qH,i(E) NH,i(l, b) + qCO(E) WCO(l, b)+ qDNM(E) DDNM(l, b) + qIC(E) IIC(l, b, E)+ qiso(E) Iiso(E)
+ X
j
qSj(E) Sj(E) δ(lj, bj)+ qSextSext(l, b, E), (3)
where NHi denotes the three H
maps listed in Sect. 3.1and DDNMstands for the DNM map derived from the dust data.
The derivation of the DNM templates is described in Sect.3.4. The q coefficients of the model are to be determined from fits to the Fermi LAT data.
The qH,i, qIC, and qiso parameters are simple normalization
factors to account for possible deviations from the input spec-tra taken for the CR-gas interactions (qLIS(E)), for the isotropic
intensity (Iiso(E)), and for the IC intensity (IIC(l, b, E)). We
check that there are no spectral deviations form the LIS, as they may signal a CR penetration or exclusion problem between the different gas phases or clouds.
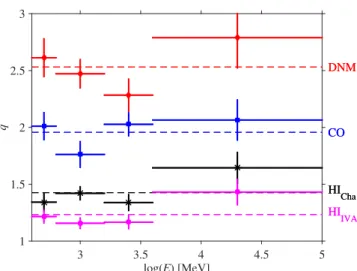
Together with the LIS, the qH,iparameters give estimates of the average γ-ray emissivity per nucleon in the different atomic clouds. With the further assumption of a uniform CR flux, they serve to scale the mass probed by the γ rays in the other phases. As a reliable input for the gas emissivity spectrum, we have used the qLISemission rate, in photons s−1sr−1MeV−1per
nu-cleon, measured with five years of LAT data with the same IRFs and the same selection criteria in instrumental and Earth-limb background rejections, but with all front and back conversions in the tracker at all energies (Casandjian 2012). The LIS measure-ment was based on the correlation between the γ rays and the H
column densities derived from the Leiden/Argentine/Bonn (LAB) survey (Kalberla et al. 2005), for a spin temperature of 140 K, in the local Galactic ring spanning 7 to 10 kpc in Galactocentric distance. We have employed the LIS to apply the energy-dependent IRFs to model the gas emission. Large de-viations from the LIS are unlikely in the nearby clouds of the Chamaeleon region (Ackermann et al. 2012a), but small vari-ations are possible in the complex as a whole or between gas phases. The absolute intensity of the LIS also changes for di ffer-ent choices of H
spin temperature. This prompted us to leave the γ-ray emissivities of the different gaseous components free to renormalize in each energy band.Sixty individual point sources have been detected inside the analysis region. Most of them are listed in the 2FGL catalogue (Nolan et al. 2012). New ones have been added from the source list in preparation within the LAT collaboration for the next catalogue. A number of “c” sources have been flagged in the 2FGL catalogue for their likely confusion with ISM clumps or with temperature artefacts in the dust map of Schlegel et al. (1998) that was part of the interstellar background model used for source detection. The “c” sources have not been confirmed as significant point sources in the present analysis, and they have been removed from the fits. We have used the spectral char-acteristics given in the catalogues to compute the source flux spectra, Sj(E). Their individual flux normalizations, qSj, have
been left free in each energy band to compensate for the fact that their input spectral characteristics have been derived above a different interstellar background model. The contribution from
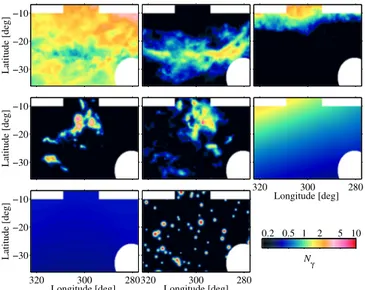
Latitude [deg] −30 −20 −10 Latitude [deg] −30 −20 −10 Longitude [deg] 300 280 320 Longitude [deg] Latitude [deg] 280 300 320 −30 −20 −10 N γ Longitude [deg]300 280 320 0.2 0.5 1 2 5 10
Fig. 3.Photon yields, on a 0.◦
125-pixel grid, from the various compo-nents of the γ-ray model in the 0.4−100 GeV band. From left to right and from top to bottom, the yields come from the NHcolumn densities in the local, IVA, and Galactic disc clouds, the WCOintensity in the local clouds, the NHDNM column density derived from AVQ, the IC emission, the isotropic background, and point sources.
sources lying within 4◦outside the analysis perimeter has been summed into a single map, Sext(l, b, E), for each energy band,
and its global normalization, qSext, has been left free. Similarly,
because the IC model and isotropic intensity have been studied over the whole sky and with less data, we have left their normal-ization free in each band.
We have modelled the I(l, b, E) intensity inside the anal-ysis region and in a 4◦-wide peripheral band to account for its faint contribution inside the analysis perimeter through the wings of the LAT PSF. The modelled intensity I(l, b, E) has been processed through the LAT IRFs to account for the position-and dependent exposure on the sky position-and for the energy-dependent PSF. The resulting photon map, integrated over a spe-cific energy band, can be directly compared to the observed data. We have used a binned maximum-likelihood with Poisson statis-tics to fit the model coefficients (q) to the LAT data in each of the four energy bands and in the overall one.
Figure3 shows the photon yields obtained for the various components of the model in the overall energy band, with the DNM template provided by the AVQ extinction. The photon
yields from the ISM dominate the total signal. The variety of spatial distributions and the relative strengths of the interstellar components allow their effective separation despite the limited resolving power of the LAT.
3.3. Dust models
We have considered three linear models for the dust analyses, using either the AVQ(l, b) extinction, the τ353(l, b) optical depth,
or the R(l, b) radiance as a tracer of the total dust column den-sity. Mild variations in dust emissivity over spatial scales com-parable to the cloud size would preserve a significant correlation between the structures observed with dust and the NH
distribu-tion. We have therefore modelled the AVQand τ353data in each
direction as the linear combination of the different gaseous con-tributions, with free normalizations. The correlation visible in Fig.1between the dust radiance and either the interstellar γ rays or the other dust maps has prompted us to use the same linear
model even though the radiance is more sensitive to small-scale variations in grain temperatures. We have added a free isotropic term to all models to account for the residual noise and the uncer-tainty in the zero level of the dust maps (Planck Collaboration XI 2014;Planck Collaboration Int. XXIX 2015)
D(l, b) = 3 X 1 yH,iNHi(l, b)+ yCOWCO(l, b) + yDNMNH γDNM(l, b)+ yiso, (4)
where D(l, b) stands for AVQ, τ353, or R. The y coefficients of the
model are to be determined from fits to the data. The NDNM H γ (l, b)
column-density map in the DNM phase has been constructed from the γ-ray data (see Sect.3.4).
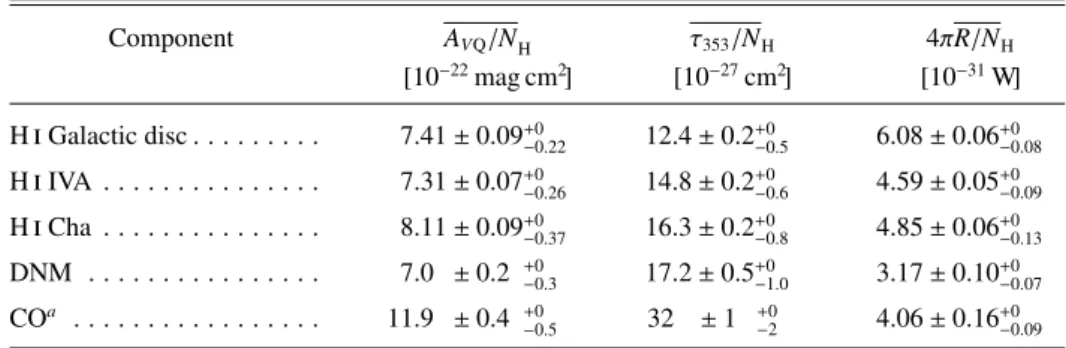
The yH,icoefficients in each analysis respectively give the
average values of the AVQ/NHratio, τ353/NHopacity, and R/NH
ratio (thus the specific power ratio 4πR/NH) in the different
H
maps. The yDNM and yCOparameters can probe changes ofthese characteristics in the denser DNM and CO-bright phases. Toward dense regions, fitting a single modified blackbody spectrum to the combination of SEDs produced in various ISRF conditions along the sightlines yields an overestimate of the colour temperature, thus an underestimate of τ353 and of the
opacity (Ysard et al. 2012). This bias is gradual, but significant only beyond the high NH range of our sample. In any case, it
would enhance rather than suppress any rising trend in opac-ity derived from the y coefficients or in the curves and maps of Sect.9.
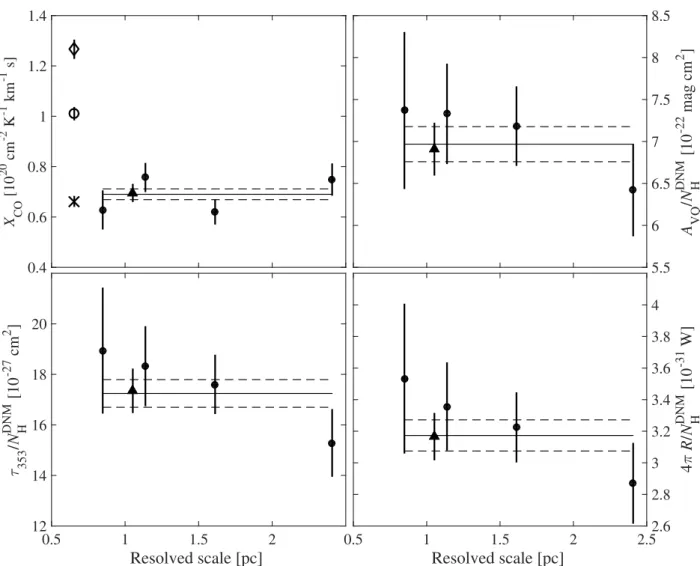
The dust models have been tested against the data using a least-squares (χ2) minimization. We expect the uncertainties in the different models to exceed those of the observed dust maps because of our assumption of uniform grain distributions through the clouds and because of the limited capability of the H
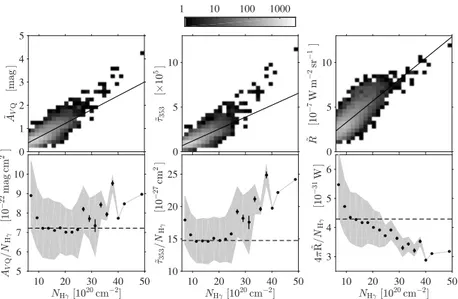
and CO data to trace the total gas (because of the data sam-pling, self-absorption, etc.). In the absence of a reliable estimate for the model uncertainties, we have set fractional error levels in order to obtain a reduced χ2value of 1 in the dust fits. This has been achieved for fractions of 16%, 18%, and 13%, respectively for the AVQ, τ353, and R models.The results presented below, however, show curvature in the evolution of AVQ/NH, τ353/NH, and 4πR/NHwith increasing NH
(see Fig. 10of Sect. 9). In this context, changing the statisti-cal weight of the outlier data points can affect the values of the best-fit slopes of the linear model. We have therefore also per-formed the χ2fits using the smaller uncertainties of the τ353and
Rmaps. The results differ only slightly from those obtained with the model uncertainties set to achieve a unit reduced χ2. We dis-cuss this case in the rest of the paper as the results provide a better statistical description of the average slopes in the multi-variate fits. None of our conclusions depends on this choice.
3.4. DNM templates and analysis iterations
Earlier γ-ray works cited in Sect. 1 have shown that both the dust column density and the interstellar γ-ray intensity present significant and similarly structured residuals above the linear ex-pectations from the NH column densities and WCO intensities.
In the Chamaeleon region analysis, we have independently fitted the γ-ray intensity and the three dust maps according to Eqs. (3) and (4) with only the H
and CO maps as gaseous components. FigureD.1shows extended regions where the data significantly exceed the best-fit models (positive residuals). These excesseshave comparable spatial distributions in all data sets. They ex-tend to several degrees (or parsecs) around the CO clouds. As these residuals delineate gas not accounted for by the H
and CO line intensities, we can use their specific distribution, above the noise, to build a DNM template.Since the work byGrenier et al.(2005), dust data in opti-cal depth or reddening have been used to construct DNM tem-plates for γ-ray analyses to complement the H
and CO data. The present analysis allows a more reliable derivation of the DNM gas contribution in three ways.– First, by closing the loop between the γ-ray and dust fits. The DNM template estimated from the dust emission is provided to the γ-ray model; conversely, the DNM map derived from the γ-ray intensity is provided to the dust model. The resid-uals are obtained in each case by subtracting from the ob-servations the best-fit contributions from the NH, WCO, and
ancillary (other than gas) components. Only positive residu-als above the noise are kept (see below).
– Second, by iterating between the dust and γ-ray fits in order to reach a solution where the q and y model coefficients, in particular those associated with the H
and CO maps, min-imally compensate for the missing DNM gas structure (see AppendixD.1). They still do at some level because the DNM templates provided by the γ rays or dust emission are not perfect.– Third, by testing three different tracers of the total dust column density in parallel analyses.
We have not smoothed the dust maps to the γ-ray resolution in the iteration. The dust maps have a finer angular resolution than the model templates and the fit results are not sensitive to struc-ture on angular scales below the resolution of the template maps. It is therefore possible, and important, to keep the dust resolution to model the clumpy CO component. We also note that the dif-fuse DNM structures independently seen in the γ-ray and dust data (in Fig.D.1) extend over large angular scales, which can be resolved by the modest γ-ray or H
resolutions.Special attention was paid to the construction of a DNM tem-plate from the positive residuals found in γ rays and in dust. A simple cut of the residuals at zero is not acceptable as it cre-ates an offset bias by cutting out the negative noise, but not the positive noise. For both the dust and γ-ray emission, the resid-ual histograms showed Gaussian noise near or below zero, and a significant positive wing extending to large values. We have therefore denoised the residual maps using the multiresolution support method implemented in the MR filter software (Starck & Pierre 1998). We have used six scales in the B-spline-wavelet transform (à trous algorithm) and a hard 2σ threshold, using all scales for detection in dust and starting with the second scale in γ rays in order to limit the Poisson noise. We have also im-plemented a simple clipping method, first fitting a Gaussian to the noise-dominated part of the residual histogram, then setting the clipping threshold at the level where the histogram counts exceed the Gaussian. We have checked the consistency of the denoised and clipped maps in the regions rich in signal. We have adopted the former because the wavelet denoising is more e ffi-cient in the regions void or nearly void of signal.
Figure1 shows that the Poisson noise in the γ-ray map is still large after five years of data acquisition. To gather the largest photon statistics, we have used all four energy bands to construct the γ-ray DNM templates by summing the residuals obtained in each band before denoising. This was preferred over the direct use of the residual map obtained in the overall-band fit because the emissivity spectra of all components are better adjusted.
7.9 8.1 8.3 0 200 400 yHI Cha 7.1 7.3 7.5 yHI IVA 7.2 7.4 7.6 yHI Gal 15.5 16.5 17.5 yCO 6.5 7 7.5 0 200 400 yDNM -17.5 -16.5 -15.5 yiso 1.32 1.37 1.42 qHI Cha 1.16 1.2 1.24 qHI IVA 1.2 1.25 1.3 0 200 400 qHI Gal 1.8 1.9 2 qCO 19 20 21 qDNM 1.25 1.35 1.45 qIC 0.6 0.8 1 0 200 400 qiso
Fig. 4.Number distributions of the model coefficients obtained in the 1500 jackknife fits of the γ+AVQanalysis for the optically thin H
case and overall energy band in γ rays. The yH,iand yDNMquantities are in units of 10−22mag cm2, yCOin 10−2mag K−1km−1s, yisoin 10−2mag, qCO in 1020cm−2K−1km−1s, and qDNMin 1020cm−2mag−1. The qH,i, qIC, and qisovalues are simple normalization factors.
3.5. Jackknife tests
The variation of the log-likelihood ratio and χ2value around the best-fit parameters, namely the information matrix (e.g.Strong 1985), yields formal errors on each parameter. They include the effect of the correlation between parameters. Given the large number of pixels in the analysis, the small set of free parame-ters in each model, and the tight correlations present between the maps, the statistical errors on the best-fit coefficients are gener-ally small (3−9% for the gas γ-ray emissivities, 4−13% for qIC,
and 0.3−0.7% for the dust parameters).
More systematic uncertainties may arise from spatial varia-tions of the model coefficients across the field, from the pres-ence of deviant sub-regions (e.g. near young stellar clusters), or from spatial variations in the mean level of H
and CO self-absorption. To check the magnitude of these uncertainties, we have performed jackknife tests for the last analysis iteration. We have masked 20% of the analysis region with a random set of 2.◦625-wide squares and performed the γ-ray and dust fits on the unmasked zones. The process has been repeated 1500 times for each analysis. We have found robust distributions for the best-fit coefficients, as illustrated in Fig.4for the γ+AVQmodel. All theparameters are well constrained in all analyses, with standard deviations of 2−6% for the gas γ-ray emissivities and 1−3% for the dust parameters. From a statistical point of view, the aver-age coefficients that characterize our linear models apply to the whole region. They are not driven by a particular subset.
To construct the final statistical uncertainties on the q and y coefficients, we have added quadratically the standard devi-ations of the jackknife distributions and the 1σ errors inferred from the information matrices.
4. Results
The values of the best-fit q and y coefficients that have been ob-tained for the different γ-ray and dust fits are given in TableE.1. In this section, we discuss the results on the relative quality of the fits obtained with the different dust tracers, with and without
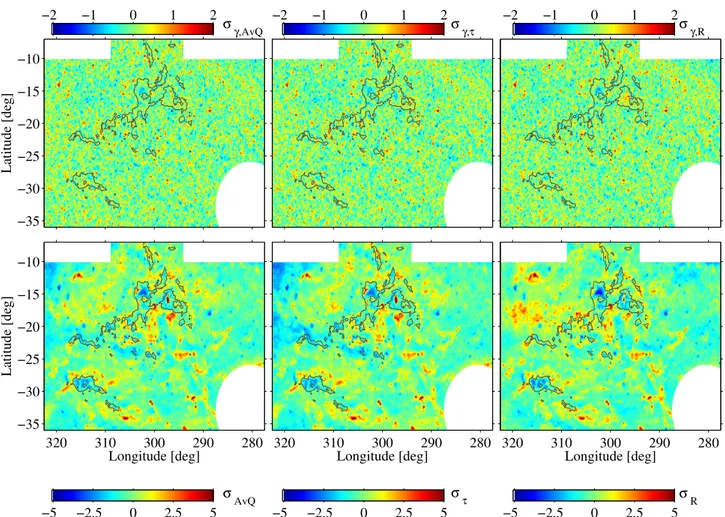
Latitude [deg] σ γ,AvQ −35 −30 −25 −20 −15 −10 −2 −1 0 1 2 Longitude [deg] Latitude [deg] σ AvQ 280 290 300 310 320 −35 −30 −25 −20 −15 −10 −5 −2.5 0 2.5 5 σ γ,τ −2 −1 0 1 2 Longitude [deg] σ τ 280 290 300 310 320 −5 −2.5 0 2.5 5 σ γ,R −2 −1 0 1 2 Longitude [deg] σ R 280 290 300 310 320 −5 −2.5 0 2.5 5
Fig. 5.Upper row: photon count residuals between the data and best-fit model, in sigma units on a 0.◦
125-pixel grid, in the 0.4−100 GeV band, with the DNM template from the dust AVQ(left), τ353(middle), or radiance (right). Lower row: dust residuals between the data and best-fit model, in sigma units, for the fit in AVQ(left), τ353(middle), and radiance (right). The grey contours outline the CO clouds at the 2.3 K km s−1level.
the DNM component, and for different optical depth corrections in the H
.4.1. Comparison of the dust tracers
As a first test, we have replaced the combination of H
, CO, and DNM templates in the γ-ray fits by a single dust map to trace the total gas. The quality of the fit greatly changes with the choice of dust tracer: the highest likelihood value is obtained with the Umin-corrected AVQextinction, then with τ353, and the poorest fitwith the radiance. The values obtained for the log-likelihood ra-tios and the Neyman-Pearson lemma (Neyman & Pearson 1933) indicate that AVQ is a better representation of the γ-ray
obser-vations than the other two dust maps with rejection probabil-ities <2 × 10⁻¹¹. This statement remains valid for all choices
of H
spin temperature. The τ353 and AVQ quantities are bothdrawn from the dust emission SEDs, but the latter incorporates a Umin-dependent correction to better match the dust reddening
constraints. The present test against the γ rays, independent of dust, strongly confirms that the renormalization of AVQbrings
it in closer linear agreement with the total gas. It implies that the Umin parameter of theDraine & Li(2007) model does not
only trace the ISRF, but also opacity variations.
4.2. Detection of the DNM component
We have then checked that the γ-ray fits considerably improve when adding the dust-derived DNM template to the H
andCO data. We obtain very large log-likelihood ratios between the best-fit models with and without a DNM component (re-spectively 1463, 1418, and 1354 for the γ+AVQ, γ+τ353, and
γ+R analyses), so the DNM structures are detected with a for-mal significance greater than 36σ. Reciprocally, the γ-ray DNM template is detected at even larger confidence levels in the dust fits when we use a χ2 minimization with the observed uncer-tainties, when they are available (for τ353and the radiance). We
cannot obtain a measure of the DNM detection when we set the dust-model uncertainties to achieve a reduced χ2of 1.
We then note that the combination of H
, CO, and DNM data represents the γ-ray emission better than a single dust map. The large confidence probabilities of the improvement (log-likelihood ratios of 68, 419, and 189, for AVQ, τ353, and R,re-spectively) indicate the presence of significant differences in the average dust properties in each gas phase.
4.3. H
optical depth correctionThe γ rays can help constrain the average level of H
optical-depth correction by comparing the TS-dependent contrast ofthe NH maps with the structure of the γ-ray flux emerg-ing from the H