1
Utilizzo di scores multiparametrici nella
caratterizzazione del rischio stimato di malignita’ di
noduli tiroidei sottoposti a citologia per ago sottile
Dottorato di Ricerca in Tecnologie Biomediche in Medicina Clinica XXXI Ciclo
Dott. Giorgio Grani Matricola 939973
Relatore
Prof. Cosimo Durante
2
Outline
Background ... 3 Thyroid ultrasonography ... 4 Cytology ... 9 Molecular testing ... 12 Aims ... 16 Sonographic evaluation ... 17 Methods ... 17Definition of sonographic features and interobserver reliability ... 17
Prospective cohort enrollment ... 22
Pre-FNAB ultrasound examination of the nodules ... 23
Classification of nodules using five sonographic risk-stratification systems ... 23
Reference standard diagnosis ... 24
Results ... 25
Discussion ... 31
Molecular evaluation ... 33
Methods ... 33
Sample collection ... 33
Molecular Analysis through targeted Next-Generation Sequencing ... 33
Data analysis ... 34
Digital PCR quantification of microRNA... 34
Reference standard ... 36
Results ... 37
Discussion ... 44
Conclusions ... 46
3
Background
Thyroid nodules are defined as discrete lesions within the thyroid gland, radiologically
distinct from surrounding thyroid parenchyma. Their diagnosis is increasingly frequent in clinical
practice (Durante, et al. 2018).
With neck palpation, thyroid nodule prevalence in iodine sufficient populations has been
estimated to about 5%, depending on age and sex (Mazzaferri 1993). Nowadays, however,
clinicians are asked to manage a much higher rate of asymptomatic patients with “occult” thyroid
nodules (up to 68% of the general population) (Guth, et al. 2009). This is largely due to the
incidental discovery of asymptomatic nodules, mainly during diagnostic imaging test for other
purposes (so-called “thyroid incidentalomas”). The prevalence is reported about 15% with
computed tomography (CT) or magnetic resonance imaging (MRI), and 1-2% with
18-fluorodeoxyglucose (FDG) positron emission tomography (PET) (Russ, et al. 2014). The risk of
malignancy in case of ultrasound (US), CT or MRI incidentalomas ranges between 5 and 13%,
while in case of focal FDG uptake, the expected malignancy rate may increase up to 55% (Russ et
al. 2014; Sharma, et al. 2015). Recognized risk factors for malignancy are head and neck and whole
body irradiation (Aldrink, et al. 2016; Cahoon, et al. 2017), exposure to ionizing radiation from
fallout in young age (Land, et al. 2015), hereditary syndromes that include thyroid cancer (e.g.,
multiple endocrine neoplasia syndrome type 2, familial adenomatous polyposis). Clinical features
such as rapid nodule growth and hoarseness also increase the probability of malignancy(Haugen, et
al. 2016).
The main clinical goal is the detection of the clinically relevant nodules (mainly those
harboring a clinically significant malignancy) among their sizable number in the general population:
in fact, the majority of nodules are benign, and so remain during long-term follow-up. Currently
4
Thyroid ultrasonography
Thyroid sonography is the main tool used for initial cancer risk stratification of thyroid
nodules. It is the preferred imaging modality: high frequency linear matrix probes (12 mHz) provide
excellent image resolution, because the thyroid is a superficial gland, with its posterior border
generally situated at less than 4 cm depth from the cutaneous surface. For this reason, if a thyroid
nodule is incidentally detected on another radiologic study, a sonographic re-evaluation is suggested
(Durante et al. 2018; Haugen et al. 2016). A complete diagnostic ultrasound examination should
include description of the background thyroid parenchyma, nodule location and size (in 3
dimensions), and a survey of the cervical lymph nodes (AIUM 2013).Individual sonographic
features may help stratifying the risk of malignancy of thyroid nodules, because some of them are
associated with thyroid cancer (e.g. solid composition, hypoechogenicity, irregular margins, and
microcalcifications) while others are more likely to indicate benignity (cystic content, “spongiform”
appearance) (Brito, et al. 2014; Campanella, et al. 2014; Moon, et al. 2012). The cancer risk is also
low (<5-10%) for solid noncalcified smoothly marginated nodules that are either iso- or
hyperechoic (same or lighter greyscale imaging compared to normal thyroid) (Moon, et al. 2008).
The American Thyroid Association (ATA) (Haugen et al. 2016) and multiple other
professional groups (Gharib, et al. 2016; Russ, et al. 2017; Shin, et al. 2016; Tessler, et al. 2017)
have devised similar, even if not identical systems, aiming to classify nodules by
patterns/combinations of sonographic features, according to their cancer risk, and then to
recommend graduated size cut-offs for fine-needle aspiration biopsy (FNAB) (Table 1). Guidelines
from endocrinology societies have generally focused on nodule pattern identification (Gharib et al.
2016; Haugen et al. 2016; Russ et al. 2017), accompanied by figures illustrating these patterns, with
correlation of each pattern to an estimated cancer risk. Recently, the American College of
5
imaging for thyroid nodules (TIRADS, Thyroid Imaging Reporting and Data System), similar to the
approach used by radiologists for other organs. Points are assigned based upon 5 ultrasound
features and the sum determines the TIRADS classification of the nodule, its estimated cancer risk,
and recommendations for either FNAB or surveillance. Malignancy risk estimates based upon
sonographic appearance is generally very similar among all 4 classification systems; however, there
are some differences in FNAB recommended cutoff sizes.
6
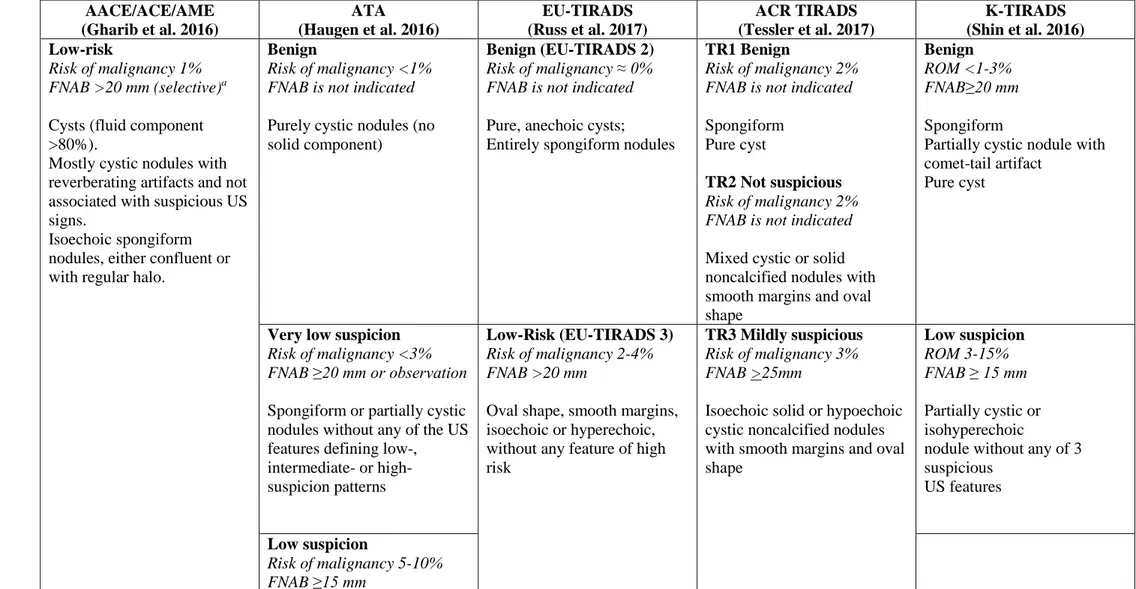
Table 1. An overview of the standardized sonographic scoring systems proposed or endorsed by international practice guidelines for risk-based guidance in planning FNAB of thyroid nodules. Modified from (Durante et al. 2018)
AACE/ACE/AME (Gharib et al. 2016) ATA (Haugen et al. 2016) EU-TIRADS (Russ et al. 2017) ACR TIRADS (Tessler et al. 2017) K-TIRADS (Shin et al. 2016) Low-risk Risk of malignancy 1% FNAB >20 mm (selective)a
Cysts (fluid component >80%).
Mostly cystic nodules with reverberating artifacts and not associated with suspicious US signs.
Isoechoic spongiform nodules, either confluent or with regular halo.
Benign
Risk of malignancy <1% FNAB is not indicated
Purely cystic nodules (no solid component)
Benign (EU-TIRADS 2)
Risk of malignancy ≈ 0% FNAB is not indicated
Pure, anechoic cysts; Entirely spongiform nodules
TR1 Benign
Risk of malignancy 2% FNAB is not indicated
Spongiform Pure cyst
TR2 Not suspicious
Risk of malignancy 2% FNAB is not indicated
Mixed cystic or solid noncalcified nodules with smooth margins and oval shape
Benign
ROM <1-3% FNAB≥20 mm
Spongiform
Partially cystic nodule with comet-tail artifact
Pure cyst
Very low suspicion
Risk of malignancy <3% FNAB ≥20 mm or observation
Spongiform or partially cystic nodules without any of the US features defining low-,
intermediate- or high-suspicion patterns
Low-Risk (EU-TIRADS 3)
Risk of malignancy 2-4% FNAB >20 mm
Oval shape, smooth margins, isoechoic or hyperechoic, without any feature of high risk
TR3 Mildly suspicious
Risk of malignancy 3% FNAB >25mm
Isoechoic solid or hypoechoic cystic noncalcified nodules with smooth margins and oval shape Low suspicion ROM 3-15% FNAB ≥ 15 mm Partially cystic or isohyperechoic
nodule without any of 3 suspicious
US features
Low suspicion
Risk of malignancy 5-10% FNAB ≥15 mm
7
Isoechoic or hyperechoic solid nodule, or partially cystic nodule with eccentric solid area without:
microcalcifications, irregular margin, extrathyroidal extension, taller than wide shape.
Intermediate-risk
Risk of malignancy 5-15% FNAB: >20mm
Slightly hypoechoic (vs. thyroid tissue) or isoechoic nodules, with ovoid-to-round shape, smooth or ill-defined margins May be present: • Intranodular vascularization • Elevated stiffness at elastography,
• Macro or continuous rim calcifications • Indeterminate hyperechoic spots Intermediate suspicion Risk of malignancy 10-20% FNAB ≥10 mm
Hypoechoic solid nodule with smooth margins without: microcalcifications, extrathyroidal extension or taller than wide shape
Intermediate-Risk (EU-TIRADS 4)
Risk of malignancy 6-17% FNAB >15 mm
Oval shape, smooth margins, mildly hypoechoic, without any feature of high risk
TR4 Moderately Suspicious
Risk of malignancy 5-20% FNAB >15mm
Hypoechoic solid noncalcified nodules with oval shape and either smooth or irregular or lobulated margins
Isoechoic solid or mixed noncalcified nodules with either nonparallel orientation (taller than wide) or punctate echogenic foci
Intermediate suspicion
ROM 15–50% FNAB ≥10 mm
Solid hypoechoic nodule without any suspicious US feature or partially cystic or isohyperechoic
nodule with any of the following: microcalcification, nonparallel orientation (taller-than-wide), spiculated/microlobulated margin High-risk Risk of malignancy 50-90% b FNAB ≥10 mm (5 mm, selectivec)
Nodules with ≥1 of the following: • Marked hypoechogenicity (vs. prethyroid muscles) High suspicion Risk of malignancy >70-90% FNAB ≥10 mm
Solid hypoechoic nodule or solid hypoechoic component of partially cystic nodule with ≥1 of the following:
High-Risk (EU-TIRADS 5)
Risk of malignancy 26-87% FNAB >10 mm
Nodules with ≥1 of the following: • Non-oval shape
• Irregular margins • Microcalcifications • Marked hypoechogenicity
TR5 Suspicious
Risk of malignancy “at least 20%”
FNAB >10mm
Hypoechoic solid nodule with any of the following:
• Nonparallel orientation (taller-than-wide) High suspicion ROM >60% FNAB ≥10 mm (>5 mm, selectived)
Solid hypoechoic nodule with any of the following:
• Microcalcification • Nonparallel orientation
8 • Spiculated or lobulated margins • Microcalcifications • Taller-than-wide shape (AP>TR) • Extrathyroidal growth • Pathologic adenopathy • Irregular margins (infiltrative, microlobulated) • Microcalcifications • Taller than wide shape • Rim calcifications with
small extrusive soft tissue • Extrathyroidal extension
• Extrathyroidal extension • Punctate echogenic foci
Isoechoic solid nodule with irregular or lobulated margins and either peripheral rim calcifications or punctate echogenic foci
• Spiculated/microlobulated margin
Abbreviations. AACE/ACE/AME: American Association of Clinical Endocrinologists, American College of Endocrinology, and Associazione Medici Endocrinologi; ACR: American College of Radiologists; ATA: American Thyroid Association. EU-TIRADS: European Thyroid Imaging Reporting and Data System; FNAB: fine-needle aspiration; TR: American College of Radiologists Thyroid Imaging Reporting and Data System. FNAB indicates the size above which a fine-needle aspiration cytology is recommended.
a Growing nodule, high-risk history, before surgery or local therapies. b In accordance with the presence of 1 or more suspicious findings.
c FNAB is recommended for smaller nodules in the following cases: subcapsular or paratracheal lesions; suspicious lymph nodes or extrathyroid
9
Cytology
Cytology usually provides the most definitive diagnostic information for the evaluation of
thyroid nodules (Haugen et al. 2016). FNAB is simple, safe, and reliable, and is usually performed
under ultrasound guidance. In the United States and much of the world, thyroid cytologic results
reporting is stratified using the Bethesda classification system which provides six diagnostic
categories (Table 2). An updated version of the Bethesda system was recently published including
minor changes in the nomenclature and the revision of the estimated malignancy risk for each class
(Baloch, et al. 2017; Pusztaszeri, et al. 2016). Category 1 is "nondiagnostic" or "insufficient", category 2 is “benign”, and categories 5 and 6 are “suspicious for malignancy” and "malignant",
respectively. Despite interobserver differences in cytologic interpretation (Cibas, et al. 2013),
Bethesda categories 2, 5, and 6 provide high enough predictive values for definite clinical decisions.
However, categories 3, and 4, comprising about 20-30% of all biopsies, are "indeterminate" or “suspicious” readings, and usually require additional evaluation. In the U.S., the dominant strategy
is the avoidance of surgery, because the majority of nodules in these three categories are benign
(Bongiovanni, et al. 2012; Strickland, et al. 2015).
The revised version of the Italian Consensus for Reporting Thyroid Cytopathology
published in 2014 (Nardi, et al. 2014), is a six-tiered system almost comparable to the Bethesda
system. The original TIR3 category was splitted in two subcategories: TIR3A, which comprises
specimens with increased cellularity with follicular pattern, or oxyphilic cells, is similar to the
Bethesda category 3, while TIR3B resembles Bethesda category 4 and includes lesions with high
cellularity characterized by a repetitive microfollicular or trabecular pattern but also those with
10
Table 2. Bethesda System and Italian Consensus for Reporting Thyroid Cytopathology synopsis: estimated risk of malignancy and suggestions for clinical management. The Bethesda System for
Reporting Thyroid
Cytopathology (Cibas and Ali
2017) Risk of malignancy (%) The Italian Consensus for Reporting Thyroid Cytopathology Usual management
(other factors may influence management)
Nondiagnostic or Unsatisfactory
Cyst fluid only Virtually acellular specimen Obscuring blood, artifacts. 0-5 (risk of malignancy varies with the type/structure of the nodule)
TIR 1 (Nondiagnostic) Repeat FNAB with ultrasound guidance Benign Benign follicular nodule (e.g., adenomatoid nodule, colloid nodule) Chronic lymphocytic (Hashimoto) thyroiditis Granulomatous (subacute) thyroiditis
0–3a TIR 2 (benign) Clinical and sonographic follow-up Atypia of Undetermined Significance or Follicular Lesion of Undetermined Significance ~10–30b TIR 3A (low-risk indeterminate lesion) [estimated risk <10%; published data 17%]
Repeat FNAB, molecular testing, or lobectomy
Follicular Neoplasm or Suspicious for a Follicular Neoplasmf
Specify if oncocytic (Hürthle cell) type
25-40c TIR 3B (high-risk indeterminate lesion) [estimated risk 15-30%; published data 47%]
Molecular testing, lobectomy
Suspicious for Malignancy Suspicious for papillary thyroid carcinoma
50–75 TIR4 (suspicious for malignancy)
Near-total thyroidectomy or lobectomy
Some studies have recommended molecular
11 Suspicious for medullary thyroid carcinoma Suspicious for metastatic carcinoma Suspicious for lymphoma
analysis to assess the type of surgical procedure (lobectomy vs. total thyroidectomy). Malignant Papillary thyroid carcinoma Poorly differentiated carcinoma Medullary thyroid carcinoma Undifferentiated (anaplastic) carcinoma Squamous cell carcinoma
Carcinoma with mixed features
97–99 TIR 5 (malignant) Near-total thyroidectomy (surgery may not be indicated in case of metastatic tumors; lobectomy is appropriate for papillary thyroid cancers < 4 cm without other high-risk features)
a) Estimate extrapolated from studies showing correlation between biopsied nodule and surgical pathology follow-up.
b)Estimates extrapolated from histopathologic data from large case cohorts (including repeat atypical FNAs) and meta-analysis of the post 2007 literature
c)Estimates extrapolated from histopathologic data from large case cohorts and meta-analysis of the post 2007 literature
d) The measured malignancy rates for the Italian Consensus indeterminate cytology reports were derived by two recent systematic reviews and meta-analyses (Trimboli, et al. 2018a; Trimboli, et al. 2018b)
12
Molecular testing
Over the last years, our knowledge of the genetic mechanisms of thyroid cancer has
expanded dramatically. A recent study from the Cancer Genome Atlas (Cancer Genome Atlas
Research Network 2014) provided comprehensive genetic characterization of papillary thyroid
carcinoma (PTC), the most common type of thyroid cancer, identified two main classes of PTC, the “BRAF V600E-like” and “RAS-like,” each with its own biologic and clinical characteristics. The
first class is characterized by classic papillary or tall-cell histology and reduced expression of
differentiation markers such as thyroglobulin, thyroid peroxidase, and Na/I symporter; the second
one is driven by RAS and similar mutations and gene fusions and characterized by follicular
morphology and preserved expression of differentiation markers (Nikiforov 2017). Furthermore,
novel genomic data were published about follicular thyroid cancer (Fagin and Wells 2016), Hürthle
cell carcinoma (Ganly, et al. 2018), poorly differentiated, and anaplastic thyroid cancer (Landa, et
al. 2016). Mutations occur principally in genes coding for proteins in the MAP kinase pathway that
regulates cellular proliferation and differentiation. A mutation in the BRAF gene (V600E) is found
in approximately 40% of PTC, as well as in some poorly differentiated and anaplastic cancers
arising from PTC (Nikiforova, et al. 2003). Mutations in the RAS gene family are found in some
PTC (usually follicular variant), follicular thyroid cancers, in benign follicular adenomas, as well as
in NIFTP. The RET/PTC fusion gene, in which the RET gene is fused with the PTC gene is
associated with radiation-related PTC, while another fusion gene (between the PAX8 and the PPARγ
gene) is seen in some follicular thyroid cancers, in some follicular adenomas, and in follicular
variant PTC. Mutations in TERT and TP53 tumor suppressor genes have also been observed in
some thyroid cancers and confer aggressive behavior.
This knowledge provides the basis for clinical use of molecular markers in diagnosis and
individualized management of patients with thyroid nodules. Molecular testing of FNAB specimens
13
2012) to the issue of cytologically indeterminate nodules. The two most popular molecular testing strategies are “mutational analysis” and “gene expression analysis”, in which genetic information
is can be derived from the same material obtained in the original FNAB sample. Mutational
analysis involves isolating DNA from thyroid follicular cells in the specimen and performing gene
sequencing, focusing on possible mutations in relevant genes, as well for the presence of fusion
genes (Nikiforov 2017). Mutational testing has been initially considered as “rule in test”, since if a
known drive mutation is found, or if fusion genes are present, thyroid cancer is almost always
present (Eszlinger, et al. 2017). However, mutations in RAS genes are seen in the full spectrum of
thyroid pathology, from non-malignant thyroid neoplasms (adenomas) to invasive cancers and have
less diagnostic utility. Furthermore, if no mutations are found, a thyroid malignancy with a
mutation that was not assessed could still be present, and therefore mutational testing may lead to
both false negative and false positive results (the latter especially if RAS and RAS-like mutations
are found).
In a single institution study of 239 patients with Bethesda category 3 and 4 cytology, the mutational
testing strategy (with an expanded number of genes tested; ThyroSeq v.2), yielded a negative
predictive value (NPV) when a mutation was not found of about 96%, and a positive predictive
value (PPV) of approximately 80%.(Nikiforov, et al. 2015) In a second single institution study of
182 patients with 190 Bethesda category 3 and 4 cytologies, the NPV was 91% (82-97%) and the
PPV was 42% (25-61%).(Valderrabano, et al. 2017) A new version of ThyroSeq (v.3), including
additional mutations and fusions, was developed and assessed in a multicenter trial (Steward, et al.
2018): it demonstrated a 94% (95% CI, 86%-98%) sensitivity and 82% (95% CI, 75%-87%)
specificity in Bethesda III and IV nodules combined, with a NPV of 97% and a PPV of 66%.
The second type of molecular testing, "gene expression analysis" or "gene expression
classifier" (GEC) uses a proprietary algorithm (derived by machine learning protocols) to analyze the expression of specific genes in a 142-gene panel. Nodules are classified as "benign" or
14
12 studies involving 1303 nodules, the NPV ranged from 87-96% (95% CI) with a malignancy
prevalence rate varying from 29-34%.(Al-Qurayshi, et al. 2017) The GEC has a low positive
predictive value, with a risk of malignancy in the range of 30-50% in the context of a "suspicious"
GEC result. (Alexander, et al. 2012) The first version of this test is no longer available: a newer
version (called Genomic Sequencing Classifier, including multiple new components), has a higher
specificity (sensitivity of 91% and a specificity of 68%), resulting in a higher positive predictive
value (PPV 47%), with a stable NPV of 96% (Patel, et al. 2018).
MicroRNA (miRNA) analysis is a more recent methodology for molecular testing for which
there are more limited data (Lithwick-Yanai, et al. 2017) but may prove to be useful in diagnostic
decision making. Two commercial diagnostic tests use miRNAs: ThyGenX/ThyraMIR is a
combination of a 7-gene mutation panel and a panel of 10 miRNA markers (ThyraMIR), with a
combined NPV of 94% and PPV of 74%) (Labourier, et al. 2015), and Rosetta GX Reveal test,
based on a panel of 24 miRNA, no more on the market.
Molecular testing is expensive: about $3000-5000 per test in the United States, depending
on the specific testing strategy (Nishino 2016); so, it is unaffordable in many parts of the world.
Some studies suggest that molecular testing is cost-effective (Labourier 2016; Lee, et al. 2014; Yip,
et al. 2012) since it decreases the number of diagnostic surgeries, and complications, when the test
results are benign. However, the results vary depending on the test performance parameters,
malignancy rates in the patient population, the health-care setting, among other factors (Eszlinger et
15
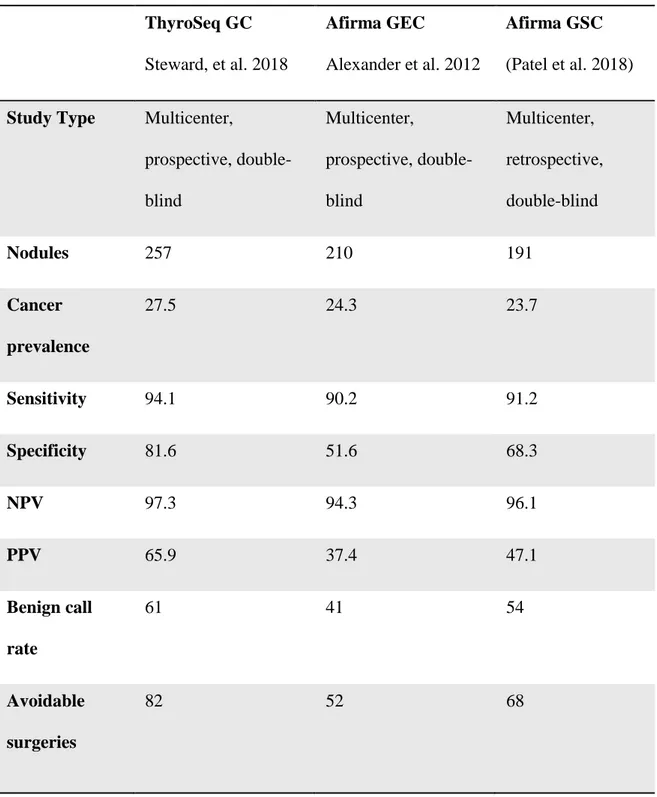
Table 3: Current commercially available molecular tests, with their main validation study ThyroSeq GC Steward, et al. 2018 Afirma GEC Alexander et al. 2012 Afirma GSC (Patel et al. 2018)
Study Type Multicenter,
prospective, double-blind Multicenter, prospective, double-blind Multicenter, retrospective, double-blind Nodules 257 210 191 Cancer prevalence 27.5 24.3 23.7 Sensitivity 94.1 90.2 91.2 Specificity 81.6 51.6 68.3 NPV 97.3 94.3 96.1 PPV 65.9 37.4 47.1 Benign call rate 61 41 54 Avoidable surgeries 82 52 68
16
Aims
Multiple sonographic systems and molecular tests are now available to guide physicians in the
management of thyroid nodules. Independent validation studies for sonographic systems were
typically small and demonstrated inconsistencies between the results of different groups. Molecular
tests are expensive, currently not commercially available in Italy, and the results of validation
studies were usually not replicated in real clinical practice.
The aims of the present project were to:
1. Prospectively validate current sonographic classification systems for the risk evaluation of
thyroid nodules;
2. Propose a molecular test strategy for risk refinement in case of indeterminate cytology;
3. Propose an integrated workflow to manage thyroid nodules using sonographic, cytological
17
Sonographic evaluation
MethodsDefinition of sonographic features and interobserver reliability
First of all, a literature review was performed to retrieve all the sonographic features
predictive of malignancy and included in the sonographic classification systems recommendations
already available at the time (Grant, et al. 2015; Horvath, et al. 2009; Kwak, et al. 2011; Kwak, et
al. 2013; Mohammadi and Hajizadeh 2013; Ozel, et al. 2012; Park, et al. 2009; Russ, et al. 2013;
Seo, et al. 2015; Su, et al. 2014). A standardized rating form was designed (Box 1) and an electronic
database for data collection was developed.
Box 1: Standardized rating form for sonographic features (an electronic version was used for consistent data collection).
Thyroiditis US pattern
Diameters (mm) _______ x ________ x ________ [transverse, anteroposterior, longitudinal]
Taller-than-wide (yes/no) Margins Sharp Irregular/Microlobulated Ill-defined Infiltrating Hypoechogenic halo
Suspected extrathyroidal extension
No Yes Internal architecture Cystic nodule Solid nodule Mixed nodule Spongiform nodule Solid component
18
o Nodular solid component Eccentric Central o Non-nodular o Septate cyst Echogenicity isoechogenic hypoechogenic markedly hypoechogenic hyperechogenic anechogenic Hyperechoic foci “comet-tail-artifact” foci indeterminate foci Calcifications
Microcalcifications (≤ 2 mm, with acoustic shadowing) Macrocalcifications (including eggshell calcifications)
Homogeneity homogeneous inhomogeneous Vascularity (1) None detectable (2) Peripheral only
(3) Central only or central and peripheral □ Suspicious lymph nodes
The definitions of the various sonographic features were based on the current literature and
preliminarily shared between the examiners, to ensure consistency (Table 4).
Table 4: definitions of the various sonographic features Feature Options Definition
Composition Solid almost entirely composed of solid tissue
Mixed both cystic and solid portions are present
Cystic completely or almost completely anechoic nodule
Spongiform Small cysts representing at least 50% of the nodule volume
Echogenicity Marked hypoechogenicity Hypoechoic relative to adjacent strap muscle Mild hypoechogenicity Hypoechoic relative to thyroid parenchyma
19
Isoechogenicity Same echogenicity of thyroid parenchyma Hyperechogenicity Hyperechoic relative to thyroid parenchyma
Shape Wider-than-tall Anteroposterior diameter equal or less than the transverse one
Taller-than-wide Anteroposterior diameter greater than the transverse one
Margin Sharp Clearly discernible smooth edge Irregular/microlobulated Spiculation, microlobulation, or jagged
appearance
Infiltrative Digitative soft tissue protrusions into the surrounding tissue
Ill-defined Poorly demarcated margin which cannot be clearly distinguished by the surrounding tissue
Halo Thin or thick hypoechoic rim surrounding nodule
(not described if irregular, microlobulated or infiltrative)
Calcification Absent
Microcalcification Echogenic foci of 2 mm or less with or without posterior acoustic shadowing within solid portion Macrocalcification Echogenic foci of more than 2 mm with posterior
acoustic shadowing, including eggshell calcifications
Other
echogenic foci
Absent
Comet-tail artifact Echogenic foci with reverberation artifacts within cystic component
Indeterminate Small echogenic foci without acoustic shadowing nor reverberation; small linear foci, including areas of fibrosis
Extrathyroidal extension
No
Suspicious loss of the echogenic thyroid border, abutment, or contour bulging
However, because interobserver variability has been documented during assessments of the
single sonographic features of thyroid nodules (Grani, et al. 2015), we preliminarily performed an
internal assessment of variability between the two examiners actually involved. We conducted a
retrospective analysis of 1055 ultrasound images of thyroid nodules identified in 265 patients (each
with less than four nodules). All had originally been classified as benign (those with suspicious US
features but benign cytology) or presumably benign (nodules with no suspicious ultrasound
features) and managed with active surveillance as long as there was no evidence of malignancy.
20
five years thereafter and stored in order to precisely document the main nodule features over time.
For the purposes of this analysis, the images of the 1055 nodules (at various follow-up points) were
converted to and stored as deidentified bitmap files. The blinded files were then randomly divided
into two groups: set 1 (501 nodules) and set 2 (554 nodules).
The selected of each nodule in set 1 was independently reviewed on a single liquid crystal display
monitor by two clinicians, each with 6 years of experience in thyroid US imaging, but trained in
two different thyroid units. The readers were blinded to the identity of the patient, the date of the
scan, and all other clinical information regarding the case. Using the standard form (Box 1) the two
readers rated the various US features of each nodule. For each nodule, the ratings of each reader
were used to classify the nodule according to the following five systems: American Association of
Clinical Endocrinologists/American College of Endocrinology/Associazione Medici Endocrinologi
(AACE/ACE/AME); the TIRADS system developed by the American College of Radiologists
(ACR); the 2015 ATA Guidelines; the EU-TIRADS system proposed by the European Thyroid Association; and the Korean Society of Thyroid Radiology’s K-TIRADS system.
Two weeks after their independent reviews and classification of set 1 images, the two
readers jointly reviewed the results and the images of all 501 nodules. Discrepancies between their
ratings were discussed and a consensus decision reached for each nodule feature. Four weeks after
completion of the training session, the two readers were asked to independently review US images
of the 554 nodules of set 2, repeating the above procedure.
For each set of nodules, inter-reader agreement was calculated for single features of the
nodule, risk-class assignment based on each of the five US classification system, and the indication
of FNAB biopsy based on the risk-class assignments. Agreement on ordinal ratings was assessed with the Krippendorff α statistic (Hayes and Krippendorff 2007). Values close to 1 indicate high
inter-reader agreement, and values above 0.65 are considered an acceptable basis for tentative
conclusions. Interobserver agreement on nominal, dichotomic ratings was evaluated using Cohen’s
21
agreement; 0.41 to 0.60, moderate agreement; 0.61 to 0.80, substantial agreement; and 0.81 to 1.00,
near-perfect agreement (Landis and Koch 1977).
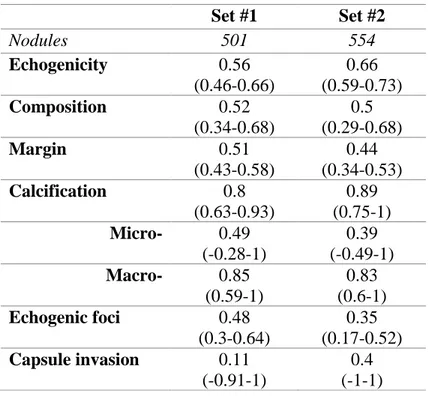
Table 5 shows the interobserver agreement for the recognition of single US features in Set 1
and Set 2. The agreement improved after the set 1 training and discussion session.
Table 5: Interobserver agreement for the recognition of single US features Krippendorff alpha
(95% confidence intervals) Set #1 Set #2 Nodules 501 554 Echogenicity 0.56 (0.46-0.66) 0.66 (0.59-0.73) Composition 0.52 (0.34-0.68) 0.5 (0.29-0.68) Margin 0.51 (0.43-0.58) 0.44 (0.34-0.53) Calcification 0.8 (0.63-0.93) 0.89 (0.75-1) Micro- 0.49 (-0.28-1) 0.39 (-0.49-1) Macro- 0.85 (0.59-1) 0.83 (0.6-1) Echogenic foci 0.48 (0.3-0.64) 0.35 (0.17-0.52) Capsule invasion 0.11 (-0.91-1) 0.4 (-1-1)
Table 6 summarizes the data on interobserver agreement nodule risk classification for the
five reporting systems tested, and the agreement in the identification of nodules that required FNAB
22
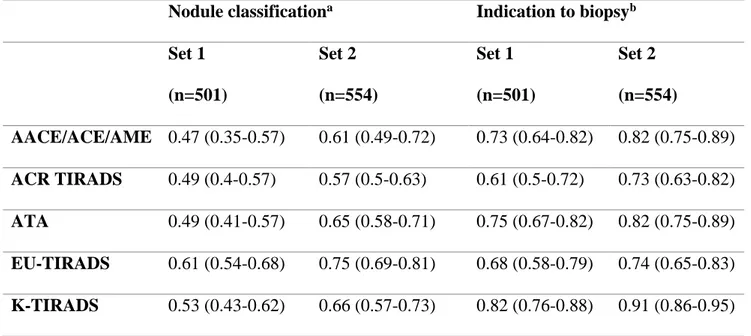
Table 6. Inter-observer agreement for nodule classification and on indications for FNAB biopsy according to five sonographic classification systems endorsed by scientific societies.
Nodule classificationa Indication to biopsyb
Set 1 (n=501) Set 2 (n=554) Set 1 (n=501) Set 2 (n=554) AACE/ACE/AME 0.47 (0.35-0.57) 0.61 (0.49-0.72) 0.73 (0.64-0.82) 0.82 (0.75-0.89) ACR TIRADS 0.49 (0.4-0.57) 0.57 (0.5-0.63) 0.61 (0.5-0.72) 0.73 (0.63-0.82) ATA 0.49 (0.41-0.57) 0.65 (0.58-0.71) 0.75 (0.67-0.82) 0.82 (0.75-0.89) EU-TIRADS 0.61 (0.54-0.68) 0.75 (0.69-0.81) 0.68 (0.58-0.79) 0.74 (0.65-0.83) K-TIRADS 0.53 (0.43-0.62) 0.66 (0.57-0.73) 0.82 (0.76-0.88) 0.91 (0.86-0.95)
a) Krippendorff alpha (95% confidence intervals)
b) Cohen kappa (95% confidence intervals)
On the whole, classification of thyroid nodules using sonographic classification systems produces
an higher inter-observer agreement than classification based on single suspicious features. More
importantly, identification of nodules that require FNAB biopsy based on these classification
systems is associated with substantial to near-perfect agreement. However, there is clearly room for
further improvement. Given these results (Grani, et al. 2018b), judgments for the prospective cohort
were made jointly in an effort to improve consistency and reliability.
Prospective cohort enrollment
All patients consecutively referred to the unit for FNAB cytology of a thyroid nodule
23
physicians included primary care physicians and secondary health-care providers (e.g.,
endocrinologists, surgeons, otolaryngologists, nuclear medicine specialists). The study was
conducted with institutional review board approval and written informed patient consent. A first
subset of the results has already been published (Grani, et al. 2018a).
Pre-FNAB ultrasound examination of the nodules
Prior to each biopsy, each nodule was carefully examined with a HI VISION Avius®
ultrasound system (Hitachi Medical Corporation, Inc., Tokyo, Japan) and a 13-MHz linear-array
transducer. During this examination, two clinicians experienced in thyroid sonography recorded
their consensus judgement on the sonographic features of each nodule on the previously described
and internally-developed standardized rating form (Box 1) (Grani, et al. 2017)
Classification of nodules using five sonographic risk-stratification systems
For each nodule, the consensus ratings of each ultrasound feature were used to classify the
risk of malignancy according to five widely used ultrasound risk-stratification systems (Table 1),
those published by the AACE/ACE/AME (Gharib et al. 2016); the American College of
Radiologists (ACR-TIRADS) (Tessler et al. 2017); the ATA (Haugen et al. 2016); the European
Thyroid Association (EU-TIRADS) (Russ, et al. 2017); and the K-TIRADS (Shin, et al. 2016).
Since none of these systems routinely recommends the FNAB of sub-centimeter thyroid nodules,
the nodules with a maximum diameter less than 1 cm were excluded. Using each system, we
identified the nodules for which FNAB was suggested based on the size threshold for the assigned
risk class. For this study, nodules that could not be classified according to the ATA Guidelines (e.g.
24
taller-than-wide shape) were considered intermediate-suspicion nodules, since their risk of
malignancy is similar (Rosario, et al. 2017; Yoon, et al. 2016).
Reference standard diagnosis
The biopsies were done under ultrasound guidance using 23-25-gauge needles. The
non-aspiration technique was used in most cases (1-4 needle passes). Direct smears of each specimen
were analyzed by experienced thyroid cytopathologists and classified according to the criteria
published in the Italian Consensus for Thyroid Cytopathology (Fadda, et al. 2010; Nardi et al. 2014)
(Table 2). If surgery had been performed, the reference standard diagnosis was based on
histological examination of the resected nodule. If the nodule had been managed non-surgically, the
reference standard was FNAB cytology: nodules were considered malignant if they had been
classified as TIR4 or TIR5 (suspected malignancy or malignancy), and benign if they had been
classified as TIR2. Nodules without histologic diagnoses that had been cytologically classified as
non-diagnostic, TIR3A, or TIR3B (indeterminate) were excluded from the final analysis, unless a
repeat FNAB had yielded conclusive results.
Statistical analysis
For each classification system, we calculated the number of nodules that did (or did not)
meet the criteria for FNAB (test positivity and test negativity, respectively). The sonographic
recommendation regarding FNAB was then compared with the reference-standard diagnosis to
estimate sensitivity, specificity, PPV, NPV, area under the receiver operating characteristics curve
(AUROC), and diagnostic odds ratios (DOR), each with 95% confidence intervals (CIs). The
proportions of biopsies that would have spared by the various systems were compared using the
25
FNR. Data were analyzed with the IBM SPSS Statistics package, version 25.0 (IBM Corp.,
Armonk, NY, US).
Results
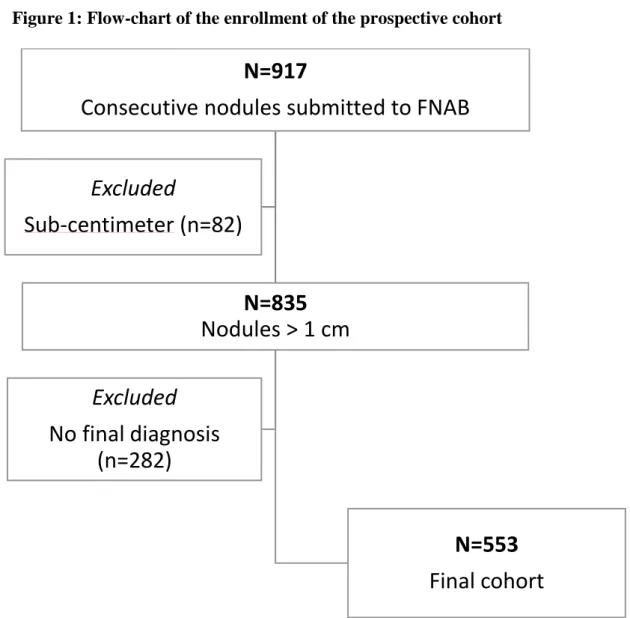
As shown in Figure 1, a total of 917 nodules were sonographically evaluated prior to
cytology. The examination identified 82 subcentimeter nodules, which were excluded from our
analysis because FNAB is not routinely indicated by international guidelines for nodules smaller
than 1 cm. Of the 835 nodules measuring at least 1 cm, 282 were also excluded because their
reference-standard diagnosis was inconclusive. The final cohort included 553 nodules, of which 42
(7.6%) were classified as malignant (Tables 7-8), from 524 patients (Table 9).
Figure 1: Flow-chart of the enrollment of the prospective cohort
N=917
Consecutive nodules submitted to FNAB
N=835
Nodules > 1 cm
N=553
Final cohort
Excluded
No final diagnosis
(n=282)
Excluded
Sub-centimeter (n=82)
26
Table 7. Sonographic features of the 553 nodules included in the final cohort mean±SD Diameters (mm) Anteroposterior 13.59±6.58 Transverse 17.32±8.33 Longitudinal 22.04±10.09 Maximum diameter 22.30±10.06 N %
Location (lobe) Right 229 41.4
Left 281 50.8 Isthmus 43 7.8 Single nodule 177 32,0 Margins Regular 188 34.0 Ill-defined 67 12.1 Irregular/lobulated 34 6.1 Infiltrating 3 0.5 Halo 261 47.2
Extrathyroidal extension Suspicion 5 0.9
Composition Mostly cystic 8 1.4
solid 185 33.5
Mixed 371 65.1
of which, spongiform 13 2.4
Echogenicity (of the solid component, if any) Anechoic 3 0.5 Hyperechoic 2 0.4 Isoechoic 407 73.6 Hypoechoic 125 22.6 Markedly hypoechoic 16 2.9
Echogenic foci Comet-tail 25 4.5
Indeterminate 105 19.0
Calcifications Macrocalcifications 80 14.5
Microcalcifications 42 7.6
Shape Taller than wide 94 17.0
Suspicious lymph nodes Yes 7 1.3
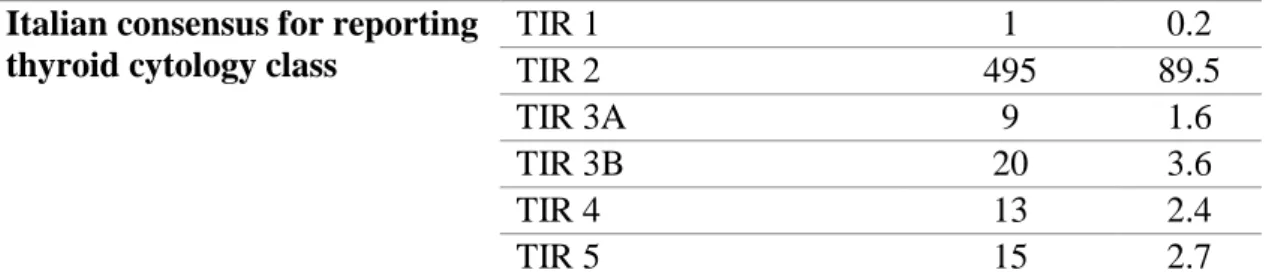
Table 8. Cytological report of the 553 nodules included in the final cohort Italian consensus for reporting
thyroid cytology class
TIR 1 1 0.2 TIR 2 495 89.5 TIR 3A 9 1.6 TIR 3B 20 3.6 TIR 4 13 2.4 TIR 5 15 2.7
27
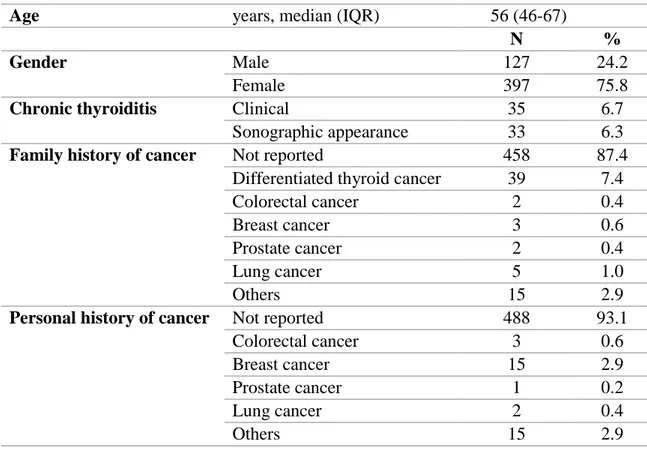
Table 9. Clinical features of the 524 patients enrolled in the final cohort
Age years, median (IQR) 56 (46-67)
N %
Gender Male 127 24.2
Female 397 75.8
Chronic thyroiditis Clinical 35 6.7
Sonographic appearance 33 6.3
Family history of cancer Not reported 458 87.4
Differentiated thyroid cancer 39 7.4
Colorectal cancer 2 0.4
Breast cancer 3 0.6
Prostate cancer 2 0.4
Lung cancer 5 1.0
Others 15 2.9
Personal history of cancer Not reported 488 93.1
Colorectal cancer 3 0.6
Breast cancer 15 2.9
Prostate cancer 1 0.2
Lung cancer 2 0.4
Others 15 2.9
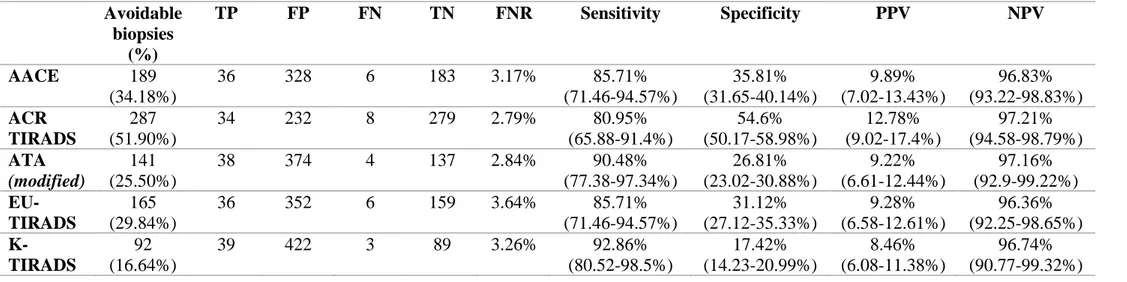
Strict application of the five ultrasound systems would have appreciably reduced the number
of FNAs performed (Table 10). The percentages of avoidable biopsies varied widely (from 16.6%
to 51.9%). The most effective system in this cohort was the ACR TIRADS, which would have
spared over half the biopsies performed (287, 51.9%), with a false-negative rate of only 2.8% (NPV
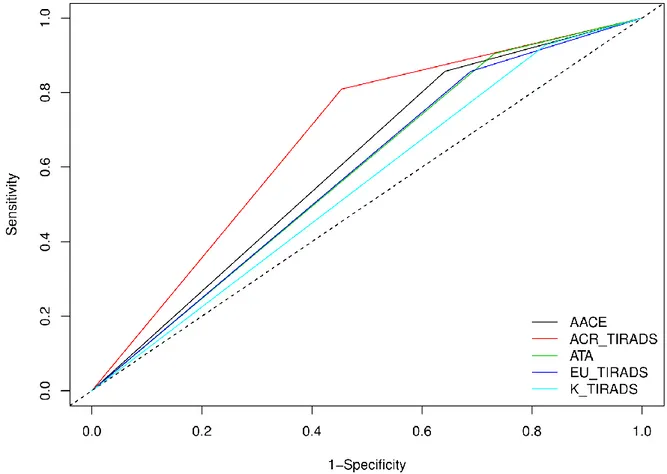
97.2%; 95% CI 94.6–98.8%). Except for K-TIRADS, the discriminatory capacities of the systems
(as reflected by their AUROC and DOR; Table 11, Figure 2) were similar to that of the ACR
28
Table 10: number of avoidable biopsies and diagnostic performance of the five sonographic classification systems. Avoidable biopsies (%) TP FP FN TN FNR Sensitivity Specificity PPV NPV AACE 189 (34.18%) 36 328 6 183 3.17% 85.71% (71.46-94.57%) 35.81% (31.65-40.14%) 9.89% (7.02-13.43%) 96.83% (93.22-98.83%) ACR TIRADS 287 (51.90%) 34 232 8 279 2.79% 80.95% (65.88-91.4%) 54.6% (50.17-58.98%) 12.78% (9.02-17.4%) 97.21% (94.58-98.79%) ATA (modified) 141 (25.50%) 38 374 4 137 2.84% 90.48% (77.38-97.34%) 26.81% (23.02-30.88%) 9.22% (6.61-12.44%) 97.16% (92.9-99.22%) EU-TIRADS 165 (29.84%) 36 352 6 159 3.64% 85.71% (71.46-94.57%) 31.12% (27.12-35.33%) 9.28% (6.58-12.61%) 96.36% (92.25-98.65%) K-TIRADS 92 (16.64%) 39 422 3 89 3.26% 92.86% (80.52-98.5%) 17.42% (14.23-20.99%) 8.46% (6.08-11.38%) 96.74% (90.77-99.32%)
The rate of avoided biopsies is significantly different between the US classification systems (McNemar test; ACR TIRADS vs. ATA, p=0.002, ATA vs. AACE/ACE/AME, p<0.001, AACE/ACE/AME vs. EU-TIRADS, p<0.001; EU-TIRADS vs. K-TIRADS, p<0.001).
29
Table 11: Diagnostic odds ratio (DOR) and area under the receiver operating curve (AUROC) of the five sonographic classification systems applied to the same cohort.
DOR (95% CI)a AUROC (95% CI)b
AACE/ACE/AME 3.348 (1.384-8.095) 0.608 (0.55-0.665)
ACR TIRADS 5.111(2.320-11.257) 0.678 (0.614-0.742)
ATA 3.480 (1.219-9.932) 0.586 (0.538-0.635)
EU-TIRADS 2.710 (1.119-6.562) 0.584 (0.527-0.641)
K-TIRADS 2.742 (0.829-9.070) 0.551 (0.509-0.594) a) the DOR measures the discriminatory power of a diagnostic test as compared with that of
the reference standard. The value ranges from 0 to infinity, with higher values indicating better performance;
b) the multiple comparisons of AUROC were performed using Bonferroni correction; K-TIRADS had a significantly lower diagnostic performance than ACR K-TIRADS (adj. p=0.01).
Figure 2: Computed ROC curves (dichotomous test result: biopsy indication) of the five systems.
30
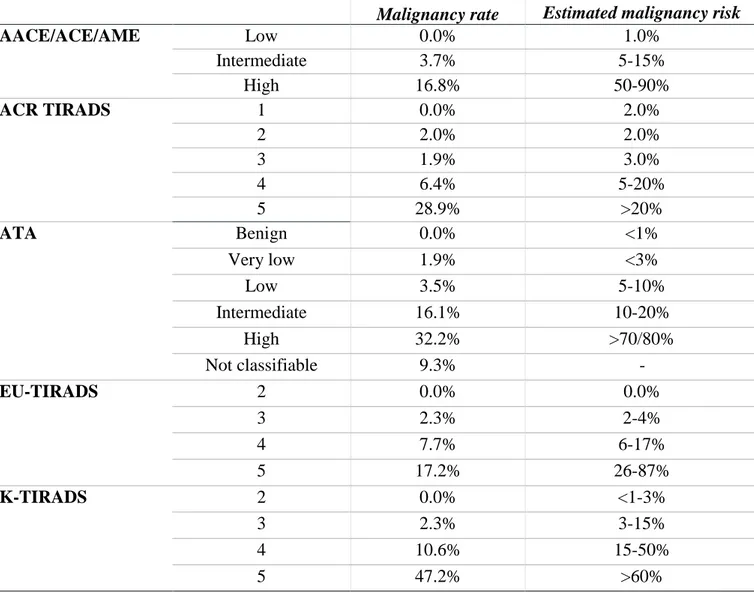
The actual malignancy rate was consistent to the predicted risk of malignancy proposed by
the systems (Table 12), except for the high-risk classes. In these cases, the estimated malignancy
risk was higher than the measured one. Furthermore, the estimates provided by the K-TIRADS
classification were higher than the actual risk of malignancy (for all classes).
Table 12: Malignancy rate and estimated malignancy risk of the various risk classes proposed by five sonographic classification systems.
Malignancy rate Estimated malignancy risk
AACE/ACE/AME Low 0.0% 1.0% Intermediate 3.7% 5-15% High 16.8% 50-90% ACR TIRADS 1 0.0% 2.0% 2 2.0% 2.0% 3 1.9% 3.0% 4 6.4% 5-20% 5 28.9% >20% ATA Benign 0.0% <1% Very low 1.9% <3% Low 3.5% 5-10% Intermediate 16.1% 10-20% High 32.2% >70/80% Not classifiable 9.3% - EU-TIRADS 2 0.0% 0.0% 3 2.3% 2-4% 4 7.7% 6-17% 5 17.2% 26-87% K-TIRADS 2 0.0% <1-3% 3 2.3% 3-15% 4 10.6% 15-50% 5 47.2% >60%
Eight nodules definitively diagnosed as malignant would have been misclassified as not
requiring FNAB by at least one of the TIRADS systems (Table 13): they were all low risk PTC,
31
Table 13: Ultrasound features of the malignancies missed by one or more sonographic classification systems
Missed by
Size (mm)
ACR TIRADS Modified ATA
K-TIRADS EU-TIRADS
and AACE hyperechoic solid nodule in
thyroiditis (FV-PTC)
13 X X X X
hypoechoic solid nodule (PTC) 13 X X
isoechoic mixed nodule (suspected PTC)
11 X X X X
isoechoic nodule with irregular margins (PTC)
11 X
isoechoic mixed nodule (PTC) 15 X X X
isoechoic mixed nodule (FV-PTC) 13 X X X X
hypoechoic solid nodule (MTC) 12 X X
Micro-PTC in the context of a 39-mm follicular adenoma (isoechoic mixed nodule)
- X
8 4 3 6
Abbreviations: ACR TIRADS: American College of Radiology Thyroid Imaging Reporting and Data Systems; ATA: American Thyroid Association; EU-TIRADS: European Thyroid Imaging
Reporting and Data Systems; MTC: medullary thyroid cancer; PTC: papillary thyroid cancer;
K-TIRADS: Korean Thyroid Imaging Reporting and Data Systems
Discussion
Thyroid cytology used to be the cornerstone of the diagnostic workflow of thyroid nodules.
In roughly one third of cases, cytomorphologic analysis of the aspirate yields inconclusive results
32
(Lamartina, et al. 2016). The sonographic risk-stratification tools are designed as “rule-out” tests,
aiming to identify nodules with low risks of malignancy whose cytologic assessment can safely be
deferred. The first aim of this project was to prospectively validate current sonographic
classification systems for the risk evaluation of thyroid nodules. Four of the five sonographic
stratification systems confirmed a statistically significant discriminatory capacity (all except
K-TIRADS): the number of biopsies performed would have been reduced applying the
internationally-endorsed classification systems. However, the safest and most substantial reduction would have
been achieved with the ACR TIRADS: the number of deferred biopsies and its ability to
discriminate between benign and malignant nodules were greater than those of the competitors.
The study has some limitations. First, this was a selected cohort of thyroid nodules, all of
which had already been flagged for FNAB, and the clinical criteria supporting these indications
were not known. The malignancy rate, however, was similar to those reported for unselected nodule
series (Durante et al. 2018), and all sonographic risk classes were represented, including low-risk
categories. Second, we used a composite reference standard: a benign cytology report was
considered sufficient for classification. However, cytology can yield false-negative results, even if
uncommonly, with estimated frequencies of 3.7% (Bongiovanni et al. 2012) and even lower (<1%)
in prospective series of cytologically benign nodules with no high-suspicion ultrasound features
(Durante, et al. 2015). Furthermore, the exclusion of nodules with non-diagnostic or indeterminate
cytology reports (and no final histology) may have caused a selection bias: however, the proportion
of nodules with these cytological reports is consistent with those reported in other cytological series
(Bongiovanni et al. 2012). The major strength of our study is its prospective nature: the US features
of each nodule were evaluated during real-time examinations carried out before aspirates were
collected. Our results support the use of sonographic classification systems to reduce the number of
needed thyroid nodule biopsies. The best overall performance was that of the ACR TIRADS, which
33
Molecular evaluation
A new molecular platform for the refinement of cytologic diagnoses was designed and tested
on a retrospective surgical cohort of resected thyroid nodules, for which a cytological examination
was previously performed, and the relative material was available for molecular testing.
Methods
Sample collection
A retrospective series of FNAB samples with cytological diagnosis performed from June
2016 to December 2017 and subsequently submitted to thyroid surgery were enrolled. For this
reason, the indeterminate, suspicious or malignant reports were more prevalent (Figure 3).
At the time of ultrasound-guided FNAB procedure, a liquid-based cytology sample was prepared, to
be processed with ThinPrep5000™ system (Hologic Co.). The material remaining after cytological
analysis was used for molecular profiling.
Nucleic acids were isolated from each sample using the AllPrep DNA/RNA Micro Kit
(QIAGEN) which allows the simultaneous purification of genomic DNA and total RNA from the
same biological sample. Samples will be accurately measured using the highly sensitive
fluorescence-based Qubit® dsDNA/RNA High Sensitivity quantification assays (Thermo Fisher
Scientific).
Molecular Analysis through targeted Next-Generation Sequencing
Genetic analysis was performed on the Ion S5 system (Thermo Fisher Scientific) using two
custom NGS multi-gene panels, which tested for single-nucleotide variants/small indels/copy
number amplification (DNA panel) and gene fusions/gene expression (RNA panel) involving
34
PPARG fusion) and others from our in-house database. Genes for the custom panel were selected based on literature data (Cancer Genome Atlas Research Network 2014; Landa et al. 2016;
Nikiforov, et al. 2014) and our in-house database, and custom primers for their targeted
amplification were designed with the Ion AmpliSeq™ Designer (Thermo Fisher Scientific). Two
libraries were created from 20 ng of DNA and 20 ng of RNA. The targeted amplification products
were partially digested, phosphorylated, and ligated to Ion P1 adapter and Ion Xpress™ barcodes
(Thermo Fisher Scientific). Libraries were pooled and clonally amplified on the Ion One Touch2
System. Sequencing was performed using Ion S5 sequencing solution on an Ion 530 chip (Thermo
Fisher Scientific).
Data analysis
Data were analyzed with Variant Caller v5.4, annotated with Ion Reporter 5.6 and
wANNOVAR software and prioritized on the basis of their population frequency (Minor allele
frequency <0.005). Predicted variant deleteriousness was assessed with wANNOVAR
(http://wannovar.wglab.org/).
SNVs and Indels were called when the position was covered by over 500 reads. The lower
detection limits were set at 5% for SNVs and 15% for small indels. CNA will be called when
variant will have a confidence level more than 15. The presence of at least 50 high-quality reads
crossing the fusion point of the transcript will be required to consider the test positive.
Digital PCR quantification of microRNA
Dysregulated miRNA expression has been documented and characterized at the tissue level
in many malignancies, including thyroid cancer. We decided to evaluate the expression of a single
35
malignant thyroid neoplasms, based on results previously published by our group (Rosignolo, et al.
2017a; Rosignolo, et al. 2017b).
Expression analysis of miR-146b-5p was performed by digital PCR, using a QuantStudio 3D
Digital PCR equipment (Thermo Fisher Scientific), using 1.25 ng of RNA, with standard
procedures. Expression suite software v 1.0.3 (Thermo Fisher Scientific) was used to determine
relative miRNA expression, using U6 as an endogenous control. The optimal cutoff level was
selected using receiver-operating characteristic (ROC) curve analysis (p-ROC package in R
software, version 3.1.1, Figure 3).
Figure 3: ROC curve analysis of mIR-146b-5p quantification, performed to select the optimal cut-off point (0.1503). R O C o f m iR -1 4 6 b - 5 p 1 0 0 % - S p e c if ic i t y % S e n s it iv it y % 0 2 0 4 0 6 0 8 0 1 0 0 0 2 0 4 0 6 0 8 0 1 0 0
36
Figure 4: Diagnostic performance of mIR-146b-5p/U6 ratio using the cut-off point derived by the ROC curve analysis (specificity 96%, sensitivity 71%).
ta r g e t/ U 6 B e n ig n ( n = 5 4 ) M a lig n a n t ( n = 6 5 ) 0 .0 0 .5 1 2 3
****
h s a - m iR - 1 4 6 b - 5 p Reference standardSurgical histology was used as the reference standard. Noninvasive follicular thyroid
neoplasm with papillary-like nuclear features (NIFTP), a recently defined entity (Nikiforov, et al.
2016), previously considered an encapsulated noninvasive follicular-variant papillary thyroid
cancer, is to date variably considered as nonmalignant, premalignant, or possibly carcinoma in situ.
For the purposes of this study, it was considered a lesion with extremely low malignant potential,
according to the statement of the ATA expert panel (Haugen, et al. 2017). Furthermore, it cannot be
grouped with benign nodules, as it requires surgical management (Nikiforov 2017).
Statistical analysis
The NGS test was considered positive if a known driver mutation was found (with any allele
37
digital PCR test was considered positive if the ratio miR-146b-5p/U6 was > 0.1503 (Figure 4). The
combined test was considered positive if one of the two components (NGS or miR-146b-5p) was
positive, and negative if both components were negatives.
The test result was then compared with the reference-standard diagnosis to estimate its
sensitivity, specificity, positive and negative predictive values (PPV and NPV) and areas under the
receiver operating characteristic (AUROC) curve (each with 95% confidence intervals, [CIs]). Data
were analyzed with the IBM SPSS Statistics package, version 25.0 (IBM Corp., Armonk, NY, US).
Results
From the original cohort of 157 samples with histology, from 140 patients, 38 inadequate
samples (23%) were excluded: the molecular analysis was then performed in 119 samples from 113
patients (Figure 5; Table 14). Among them, 54 were histologically classified as benign (31 nodular
hyperplasia/goiter; 23 adenomas), and 65 as malignant (61 papillary thyroid cancers – including 2
NIFTP, 1 follicular thyroid cancer, 1 poorly differentiated thyroid cancer, 1 anaplastic thyroid
cancer, and 1 medullary thyroid cancer).
Figure 5: Flow-chart of the enrollment of the retrospective cohort
157 samples with histology
(140 Patients)
119 samples with molecular test
(113 Patients)
38 samples (23%) excluded
33 Low RNA and/or DNA 4 only NGS analysis 1 Failed Library
40 samples with indeterminate cytology
38
Table 14. Demographic features of the patients (whole cohort and indeterminate cytology cohort)
All 119 samples 40 indeterminate samples Age 48.7 (18-91) 52.9 (32-79) Male 28 (25%) 11 (28%)
Female 85 (75%) 28 (72%)
N 113 patients 39 patients
The NGS panel identified 69 nodules harboring somatic alterations involving a known
driver gene, the most common being BRAF, followed by RAS (N-, H-, and K-RAS grouped
together) (Table 15).
Table 15. Driver mutations identified by the NGS panel
N % None 50 42.0 BRAF 43 36.1 NRAS 6 5.0 EIF1AX 4 3.4 HRAS 4 3.4 RET/PTC1 4 3.4 KRAS 2 1.6 RET 2 1.7 CHEK2 1 0.8 PAX8-PPARG 1 0.8 PTEN233 1 0.8 RET/PTC3 1 0.8
The resulting diagnostic performance is reported in Table 16. The overall sensitivity is
(71.59-39
90.68%) and NPV of 84% (70.89-92.83%). Considering only cytologically indeterminate nodules,
the sensitivity is 88.89% (51.75-99.72%), specificity 80.65% (62.53-92.55%), PPV 57.14%
(28.86-82.34%), and NPV 96.15% (80.36-99.9%). Thus, 12 false positive cases were found: 5 (41.7%)
involving RAS genes, 3 (25%) EIF1AX, and BRAF, CHEK2, PTEN, and RET genes (1 case each; all
of them were carefully checked by the pathologists, and the absence of histology features of
40
Table 16: Diagnostic performance of the Next Generation Sequencing panel (overall and according to cytology classes; indeterminate cytology categories are highlighted in gray)
TP FP FN TN n Sensitivity Specificity PPV NPV NGS, overall 57 12 8 42 119 87.69% (77.18-94.53%) 77.78% (64.4-87.96%) 82.61% (71.59-90.68%) 84.0% (70.89-92.83%) According to cytology classes
TIR 2 0 4 1 16 21 0.0% (0.0-97.5%) 80.0% (56.34-94.27%) 0.0% (0.0-60.24%) 94.12% (71.31-99.85%) TIR 3A 1 1 0 7 9 100.0% (2.5-100.0%) 87.5% (47.35-99.68%) 50.0% (1.26-98.74%) 100.0% (59.04-100.0%) TIR 3B 7 5 1 18 31 87.5% (47.35-99.68%) 78.26% (56.3-92.54%) 58.33% (27.67-84.83%) 94.74% (73.97-99.87%) TIR 3A and B 8 6 1 25 40 88.89% (51.75-99.72%) 80.65% (62.53-92.55%) 57.14% (28.86-82.34%) 96.15% (80.36-99.9%) TIR 4 19 2 3 0 24 86.36% (65.09-97.09%) 0.0% (0.0-84.19%) 90.48% (69.62-98.83%) 0.0% (0.0-70.76%) TIR 5 30 0 2 0 32 93.75% (79.19-99.23%) - 100.0% (88.43-100.0%) 0.0% (0.0-84.19%)
41
The miR-146b-5p levels were considered positive in 48 cases. The diagnostic performance
is reported in Table 17. Since the cutoff level was selected in this same cohort, according to the
ROC curve analysis, overestimation of diagnostic values is possible, and the determination in an
independent cohort is needed. In the whole cohort, sensitivity was 70.77% (95% CI 58.17-81.4%),
specificity 96.3% (87.25-99.55%), PPV 95.83% (85.75-99.49%), and NPV 73.24%
(61.41-83.06%). In the subset of indeterminate nodules, sensitivity was 77.78% (39.99-97.19%),
specificity 93.55% 99.21%), PPV 77.78% (39.99-97.19%), and NPV 93.55%
(78.58-99.21%).
The combination of the two tests resulted in a sensitivity of 90.77% (80.98-96.54%),
specificity 74.07% (60.35-85.04%), PPV 80.82% (69.92-89.1%), and NPV 86.96% (73.74-95.06%)
in the entire cohort, and a sensitivity of 100.0% (66.37-100.0%), specificity 74.19%
(55.39-88.14%), PPV 52.94% (27.81-77.02%), and NPV 100.0% (85.18-100.0%) in the cytologically
indeterminate nodule subset (Table 18). Combining the two tests did not improve the diagnostic
performance (assessed according to the AUROC analysis) in the entire cohort: the AUROC for
mIR, NGS, and combined test were 0.84 (0.77-0.9), 0.83 (0.76-0.9), and 0.82 (0.76-0.89)
respectively. In the subgroup of indeterminate nodules, the AUROC slightly increases, without
statistical significance: 0.86 (0.71-1), 0.85 (0.72-0.98), 0.87 (0.79-0.95) for mIR, NGS, and
combined test, respectively (Figure 6). However, the combination of the two tests zeroed the false
negative number, allowing for a NPV of 100%. A greater sample is probably needed to clarify the
42
Table 17: Diagnostic performance of the mIR (overall and according to cytology classes; indeterminate cytology categories are highlighted in gray) TP FP FN TN n Sensitivity Specificity PPV NPV miR 46 2 19 52 119 70.77% (58.17-81.4%) 96.3% (87.25-99.55%) 95.83% (85.75-99.49%) 73.24% (61.41-83.06%) According to cytology classes
TIR 2 0 0 1 20 21 0.0% (0.0-97.5%) 100.0% (83.16-100.0%) - 95.24% (76.18-99.88%) TIR 3A 1 0 0 8 9 100.0% (2.5-100.0%) 100.0% (63.06-100.0%) 100.0% (2.5-100.0%) 100.0% (63.06-100.0%) TIR 3B 6 2 2 21 31 75.0% (34.91-96.81%) 91.3% (71.96-98.93%) 75.0% (34.91-96.81%) 91.3% (71.96-98.93%) TIR 3A and B 7 2 2 29 40 77.78% (39.99-97.19%) 93.55% (78.58-99.21%) 77.78% (39.99-97.19%) 93.55% (78.58-99.21%) TIR 4 15 0 7 2 24 68.18% (45.13-86.14%) 100.0% (15.81-100.0%) 100.0% (78.2-100.0%) 22.22% (2.81-60.01%) TIR 5 24 0 8 0 32 75.0% (56.6-88.54%) - 100.0% (85.75-100.0%) 0.0% (0.0-36.94%)
43
Table 18: Diagnostic performance of the combination of mIR and Next Generation Sequencing panel (overall and according to cytology classes; indeterminate cytology categories are highlighted in gray)
TP FP FN TN n Sensitivity Specificity PPV NPV Combination 59 14 6 40 119 90.77% (80.98-96.54%) 74.07% (60.35-85.04%) 80.82% (69.92-89.1%) 86.96% (73.74-95.06%) According to cytology classes
TIR 2 0 4 1 16 21 0.0% (0.0-97.5%) 80.0% (56.34-94.27%) 0.0% (0.0-60.24%) 94.12% (71.31-99.85%) TIR 3A 1 1 0 7 9 100.0% (2.5-100.0%) 87.5% (47.35-99.68%) 50.0% (1.26-98.74%) 100.0% (59.04-100.0%) TIR 3B 8 7 0 16 31 100.0% (63.06-100.0%) 69.57% (47.08-86.79%) 53.33% (26.59-78.73%) 100.0% (79.41-100.0%) TIR 3A and B 9 8 0 23 40 100.0% (66.37-100.0%) 74.19% (55.39-88.14%) 52.94% (27.81-77.02%) 100.0% (85.18-100.0%) TIR 4 19 2 3 0 24 86.36% (65.09-97.09%) 0.0% (0.0-84.19%) 90.48% (69.62-98.83%) 0.0% (0.0-70.76%) TIR 5 31 0 1 0 32 96.88% (83.78-99.92%) - 100.0% (88.78-100.0%) 0.0% (0.0-97.5%)
44
Figure 6: Computed ROC curves of the NGS, miR, and combined test in the subgroup of indeterminate nodules (TIR3A and TIR3B cytology reports)
Discussion
We have developed a combination test with a sensitivity of 100.0% (66.37-100.0%) and
specificity of 74.19% (55.39-88.14%) in the cytologically indeterminate nodule subset. With the
current prevalence of malignancy (22.5%), it has a PPV of 52.94% (27.81-77.02%) and NPV
100.0% (85.18-100.0%). It is so possible to use it as a “rule out” test in cytologically indeterminate
lesions. Furthermore, we have demonstrated that it is possible to have a sufficient amount of nucleic
acid from the original cytology sample in at least 77% of the cases; with liquid-based cytology
processing, it also does not require the destruction of the original slide used for morphological
45
personalized surgical planning, providing some risk estimation information before the
thyroidectomy, and may help clinicians to refine the treatment of patients. For example, the
detection of additional mutations (late genetic events) such as TERT may identify thyroid cancers
with the highest risk for tumor recurrence and disease specific mortality (Moon, et al. 2017; Song,
et al. 2016; Vuong, et al. 2017).
While in this cohort of cytologically indeterminate nodules no false negative were detected,
in the whole cohort 6 false negative were detected: all but two of them were correctly identified by
cytological examinations. In the 2 cases that resulted false negative both for cytology and for
molecular testing, a sampling error may not be excluded (the first case had a non-diagnostic
cytology; in the second case a small, 3-mm PTC was probably not the target of the biopsy). On the
contrary, some false positives were detected: the majority of them (6/8 in the indeterminate cohort)
were due to the detection of driver mutation. In these cases, at least an adenoma was identified: it is
a clonal neoplasm, therefore potentially prone to progression (Figure 7).
46
This study has several limitations. First of all, it is based on a surgical cohort: it is prone to
selection bias. Furthermore, this study was performed at a single high-volume pathology center with
established clinical expertise: the results may vary in other settings. Finally, the threshold for
positivity of miR-146b-5p was established according to the ROC curve analysis in this same cohort,
thus leading to overestimation of the diagnostic accuracy. An independent validation cohort is
needed.
The study reports a high sensitivity and high NPV of our combined test for indeterminate
cytology nodules, which together with good specificity may avoid surgeries in a good number of
patients (in our cohort 23 patients may have avoided surgery, 57.5%).
Conclusions
More than 600’000 thyroid FNABs are performed every year in the United States alone, and
the number has been increasing annually by 16% from 2006 to 2011. In the same time frame, The
number of thyroid surgeries performed increased by 31%, and total thyroidectomies increased by
12% per year (Sosa, et al. 2013). About 20% of FNAB of thyroid nodules have indeterminate
cytology (Bethesda category III and IV) (Durante et al. 2018). The number of diagnostic surgeries
can be reduced if the nodules are reliably classified as benign. Over the past decade, molecular
testing of thyroid nodules was developed to improve diagnostic accuracy of FNA cytology:
development of new test strategies is ongoing, using gene expression profiling, miRNA profiling,
broader gene panels of for mutational markers, inclusion of copy number alterations, mitochondrial
DNA, and combinations of different markers. However, the role and optimal application of
molecular testing is yet to be determined, also considering his high cost.
The final aim of this project was to propose an integrated workflow to manage thyroid
47
The first step is to better select the nodules that really need further examinations. We have
documented that the application of the ACR TIRADS systems may reduce more than a half of the
cytological examinations performed at our center, still detecting clinically significant cancers.
Figure 8: First step of management of newly detected thyroid nodules
Only nodules classified as ACR TIRADS TR3, TR4, TR5 above the defined size cutoff should be
submitted to FNAB (no more than 50% of the nodules greater than 1 cm). It is important to note,
however, that the US features being evaluated must also be clearly and unambiguously defined, and
the application of TIRADS systems requires specific training and experience (Grani et al. 2018b),
appropriate equipment and sufficient time.
About 20% of biopsied nodules are expected to have an indeterminate cytology report. In this
group, the application of the molecular test may be considered: however, its performance is heavily
dependent on pre-test probability of malignancy. Given the sensitivity and specificity of the
molecular test, Bayes theorem can predict the test NPV and PPV along the spectrum of disease
prevalence (i.e. the pre-test probability of disease) (Christenson 2007). The plot of the predicted
NPV and PPV of our molecular testing approach is reported in Figure 9: the NPV is at least 95% till