Università degli Studi di Roma “La Sapienza”
Dipartimento di Scienze Statistiche
Dottorato di Ricerca in Scienze Statistiche – XXXI ciclo
Settore scientifico disciplinare SECS-S/01
Statistica Metodologica
Tesi di Dottorato
Official Statistics 4.0
Facts for People in the 21. Century
Coordinatore: Candidato:
i Content
1 OFFICIAL STATISTICS - AN INTRODUCTION ... - 1 -
2 OFFICIAL STATISTICS – PUBLIC INFORMATIONAL INFRASTRUCTURE ... - 7 -
2.1 THE BUSINESS MODEL OF OFFICIAL STATISTICS ... -7
-2.1.1 Core aspects ... 7
-2.1.2 Knowledge generation ... 8
-2.1.3 The process model, business architecture ... 10
-2.1.4 Modes of data collection ... 13
-2.1.5 The portfolio of products (and services) ... 15
-2.2 SKILLS AND HUMAN RESOURCES ... -20
-2.3 QUALITY IN OFFICIAL STATISTICS ... -23
-2.3.1 Quality – an old objective – a young concept ... 23
-2.3.2 Quality objectives and means to reach them ... 24
-2.3.3 Code of Practice ... 26
-2.3.4 Quality management, quality assurance ... 30
-2.3.5 Evolution and continuous adaptation ... 32
-2.4 NATIONAL, INTERNATIONAL AND EUROPEAN STATISTICS ... -35
-2.5 CONFIDENTIALITY AND ACCESS TO CONFIDENTIAL DATA ... -40
-2.6 MODERNISATION ... -41
-2.7 CONCLUSION:OFFICIAL STATISTICS – MODERN, EFFICIENT, HIGH QUALITY ... -43
-3 SCIENCE AND SOCIETY: A REFLEXIVE APPROACH TO OFFICIAL STATISTICS ... - 45 -
3.1 PROFOUND KNOWLEDGE –A SYSTEM’S APPROACH TO QUALITY ... -45
-3.2 EPISTEMOLOGY – THEORY OF KNOWLEDGE ... -48
-3.2.1 The truth, reality and statistics ... 48
-3.2.2 Measurability, models, learning ... 58
-3.2.3 Complexity ... 62
-3.3 STATISTICS AND SOCIETY ... -66
-3.3.1 Coconstruction, boundary object, governance ... 67
-3.3.2 The coconstruction of statistics and society – history in fast motion ... 69
-3.4 REDUCING COMPLEXITY BY MEANS OF INDICATORS ... -81
-3.4.1 Indicators – a case study ... 81
-3.4.2 Methodology for indicators ... 83
-3.4.3 Indicators, goals, targets, monitoring ... 87
-3.4.4 Lessons learned for indicators ... 88
-3.5 SUSTAINABLE DEVELOPMENT. ... -89
-4 OFFICIAL STATISTICS 4.0: THE ERA OF DIGITISATION AND GLOBALISATION ... - 94 -
4.1 RAPID AND RADICAL CHANGES - THE NEW ENVIRONMENT FOR OFFICIAL STATISTICS ... -94
-4.1.1 Three revolutions in the digital age ... 94
-4.1.2 Globalisation: National statistics under pressure ... 97
-4.1.3 Official statistics 4.0: Answers to a dramatically changing environment ... 98
-4.1.4 Launching a new, scientific debate ... 99
-4.1.5 Principles of official statistics in the era of digitisation ... 100
-4.2 GLOBALISATION -REVIEWING THE NATIONAL STATISTICS PARADIGM ... -101
-4.3 BRIDGING THE GAP -COMMUNICATION 4.0 ... -105
-4.3.1 Objective and subjective Consumer Price Index ... 107
-4.3.2 Coproduction of Statistics – Participatory Data ... 109
-4.3.3 Participation in indicator design ... 109
-4.3.4 Market research ... 110
-4.4 GOVERNANCE 4.0–PREPARING FOR NEW OPPORTUNITIES AND RISKS ... -110
-4.4.1 What does governance mean? ... 111
-4.4.2 Achieving goals and preventing risks ... 112
-4.4.3 Tailored statistical governance ... 113
-4.4.4 Achievements of the past 20 years ... 114
-ii
4.4.6 The datainformationknowledge nexus and official statistics ... 118 -5 A CONFIDENT LOOK INTO THE FUTURE OF OFFICIAL STATISTICS ... 121 -REFERENCES ... - 122 -
iii Abbreviations
AI: Artificial Intelligence
AMStat: American Statistical Association B2G: Business to Government
CBS: Central Bureau of Statistics COs: Citizens Observatories CPI: Consumer Price Index
CSO: Central Statistical Office of Ireland
DGINS: Conference of the Directors General of the National Statistical Institutes DMC: Domestic Material Consumption
EC: European Community ECB: European Central Bank EDP: Excessive Deficit Procedure
EEA/EFTA: European Economic Area / European Free Trade Association EFQM: European Foundation for Quality Management
EGR: EuroGroups Register
ELSTAT: Hellenic Statistical Authority EMOS: European Master in Official Statistics
ES Code of Practice: European Statistics Code of Practice ESA: European System of Accounts
ESBRs: European System of interoperable Business Registers ESS: European Statistical System
EU: European Union
Eurostat: European Statistical Office
FENStatS: Federation of European National Statistical Societies G2B: Government to Business
GDP: Gross Domestic Product
GSBPM: Generic Statistical Business Process Model HICP: Harmonised Index of Consumer Prices HLEG: High-level expert group of experts ICW: Income, Consumption and Wealth IMF: International Monetary Fund
Intrastat: Statistics on the trade in goods between countries of the European Union IoT: Internet of Things
ISI: International Statistical Institute IT: Information Technology
LEG: European Statistical System Leadership Expert Group LFS: Labour Force Survey
MDGs: UN Millenium Development Goals NDP: Net Domestic Product
NGOs: Non-Governmental Organisations
NUTS: Nomenclature of Territorial Units for Statistics
OECD: Organisation for Economic Co-operation and Development PDSA: Plan-Do-Study-Act
QAF: Quality Assurance Framework RatSWD: German Data Forum SD: Sustainable Development
SDG: UN Sustainable Development Goals SDI: Sustainable Development Indicators
SEEA: System of Environmental-Economic Accounting SNA: System of National Accounts
TIVA: Trade-in-value-added TMC: Total Material Consumption TQM: Total Quality Management UK: United Kingdom
UN: United Nations
- 1 -
1 Official Statistics - an introduction
“To measure for public purposes is rarely so simple as to apply a meter stick casually to an object.”
(Porter 1995: p 28)
“In Wirtschaft und Gesellschaft bestimmt das von historischen, institutionellen und kulturellen Rahmenbedingungen abhängige, an Werten und Normen orientierte, vielfach interessengeleitete Verhalten der Menschen so weitgehend das Geschehen, dass schon eine sinnvolle Begriffsbildung und damit auch die Datenerhebung einen ganz eigenen, geradezu kulturorientierten Zugang erfordern. Das ist das Adäquationsproblem.”1
(Grohmann 2012: p 59) The term ‘statistics’ is used differently; it can refer to a science, a certain kind of information or institutions.
Essentially, statistics is the science of learning from data. Certainly, it is a modern technology that is part of the standards of today’s information age and society and is used in a wide array of fields. The history of statistics goes back a long way, accompanying historical eras, technical developments and political turning points just as the census in year zero2 (Champkin 2014).
Statistics is a method that can reduce complexity, separate signals from noise and distinguish significant from random. The statistical results of this method are used for all conceivable information and decision-making processes. Whether statistics help us better understand the world around us and whether they actually improve decisions (and therefore our lives) is not only a question of scientific methodology. The decisive factor here is whether statistics, like a language, are understood by those for whom the information is relevant.
Statistical institutions are the producers of statistics. Using scientific statistical methods, data
is collected and existing data is processed in order to calculate condensed information, which is made available to the general public in different forms, such as statistical aggregates, graphics, maps, accounts or indicators. Statistical offices usually belong to the public administration, at state, international, regional or local level.
This work will be concerned neither with statistics in general nor with the history of theoretical statistics. Rather, the goal is to describe the status quo for a particular area of application, namely ‘official statistics’, based on an analysis of its historical genesis in order then to deploy strategic lines of development for the near future of this particular domain.
Central to this work is the quality of statistical information. Statistics can only develop a positive enlightenment effect on the condition that their quality is trusted. To ensure long-term trust in statistics, it is necessary to deal with questions of knowledge, quantification and the function of facts in the social debate. How can we know that we know what we know (or do
1 “In business and society, people's behaviour, which depends on historical, institutional and cultural conditions, is oriented towards values and norms and is often guided by interests and determines what happens to such an extent that even the formation of meaningful concepts and thus the collection of data require a very individual, almost culture-oriented approach. This is the problem of adequacy.”
2 Luke 2:1: ‘In those days Caesar Augustus issued a decree that a census should be taken of the entire Roman world.’
- 2 -
not know)? The more concrete an answer that can be given to such questions, the more possible it will be to protect statistics against inappropriate expectations and to address false criticism. When one uses the term ‘official statistics’, one deals with the problem that again different meanings are possible, namely the institution (the statistical office), the results (statistical information) and, of course, the processes (the surveys). As we will see below, such a still very vague interpretation is actually not entirely wrong. To define ‘official statistics’ means to commit oneself to all three questions: who? what? and how?
But of course, one associates with the notion of official statistics first that it deals with social and economic issues, and more recently also with ecological ones. How many people live in a country, how much is produced, what about work, health and education? We encounter these and related topics daily in the media, in political discussions and decisions. From them we expect a solid quality; we must trust them.
In fact, official statistics is a representative of the Statistical Mind in Modern Society (Stamhuis,
Klep, and van Maarseveen 2008; van Maarseveen, Klep, and Stamhuis 2008), closely related
to social progress and scientific work. In this respect, it is not surprising that the interrelationships between statistics, science and society are reflected in a historical development characterised by manifold turns, by steady sections, alternating with periods of greater and more rapid change.
From the beginning of the nineteenth century, in the course of the emerging nation states and in parallel with the industrial revolution, statistics experienced a first phase of growth, methodological development and various applications. Statistics as a science, as a statistical result and as an institution fertilised each other in their development, although there were consistently disagreements between different schools of thought, especially between the representatives of empirical, comparative statistics on the one hand and of a ‘stochastic style of
reasoning’ (Desrosières 2008a: p 311) on the other.
In the twentieth century, three methodological and technical innovations have changed the world of official statistics: ‘sampling surveys, national accounts and computers’(Desrosières
2008a: p 320). After a first era of official statistics in the nineteenth century, a second phase
of the prosperity of statistics followed, mainly initiated by major scientific innovations particularly in inferential statistics, but also closely connected with the political conditions, the crises and the attempts to solve them; for example, by the development of macro-economic statistics.
In a third phase, which began in the late 1970s, the computer moved into the spaces and processes of statistics, which opened up completely new possibilities. The amount of data and the variety of its processing tools in all areas of life, commerce, administration, politics has exploded since then. In this third era, under these conditions, official statistics were fundamentally reformed by switching from tailor-made to industrial production processes. At the end of the third era, we are currently in a transition to a fourth phase in which the digitisation of all areas of life will continue at high speed. The handling of ‘big data’ will dominate the near future of official statistics as the question of register data has done in recent years. In addition, the effects of globalisation will increasingly demand political responses, which will then be directly linked to a new need for differentiated statistics.
- 3 -
- 4 -
‘Official statistics’ is one practical application of the ‘quantification as a social technology’ (Porter 1995) belonging to those with the longest history3. Since the beginning of the nineteenth
century (Schlözer 1804), official statistics – as a child of the Enlightenment – have grown and developed side by side with the different forms of the (modern) state.
Desrosières (1998) uses the term ‘mutual co-construction’ for three interlinked phenomena: a) a theory of the state (economy); b) interventions of the state (policies); and c) quantification of ‘variables’ specifically targeted by policy measures (statistics).
Generally, the question ‘what is official statistics?’ is not taken very seriously. It is only inadequately answered or often even answered with a certain irony: ‘Official statistics is statistics produced by offices.’ In any case, little importance is attributed to the question by the academic representatives of the scientific discipline of statistics since they regard official statistics as nothing other than the application of methodology in one field of practice, as well as others (for example, medicine or industry).
In this work, however, the exclusive focus is placed on what official statistics is, how it came into being, what significance it has for socio-political processes (and vice versa) and where the developments will lead in the near future. It is therefore imperative that we examine this subject of consideration more closely and outline it as well as we can with a definition.
In an approximation, official statistics can be defined by using three questions (Eurostat 2016b): • Who? Normally, official statistics are produced and provided by statistical offices, i.e.
public administrations
• What? Statistical work programmes and priorities are prepared according to public sector standards (i.e. participation of civil society) with the final decisions partly taken in legislative procedures
• How? Statistical methodologies are nowadays subject of international cooperation and manifested in statistical standards; high-level quality is assured through management systems and ethical codes.
Due to this somewhat more complicated rapprochement, it is already clear that official statistics are characterised above all by their role and function in the process of forming opinions and deciding in societies. We will first examine this question in more detail, and in doing so, we will approach the main field of inquiry itself, namely the interaction between official statistics and society.
The need for statistics has never been so obvious (Radermacher 2012b, 2016a). Data requirements cover a wide range of aspects of society, including relatively new areas such as quality of life, environmental aspects or the economy 4.0. The financial and economic crisis since 2007 has led to stronger economic governance in the European Union (EU), which in turn has led to a greater need for reliable, trustworthy statistics.
Official statistics play a fundamental role in modern societies: they are an essential basis for policies, they support business decisions and they allow citizens to evaluate the progress made. But the power of statistical knowledge also poses dangers (Fukuda-Parr 2017). From a cognitive tool that can emancipate and promote participation, it can transform itself into a true
3 For a comprehensive overview of the history of official statistics, reference is made in particular to the works of Desrosières, Porter and Klep, Stamhuis et.al. (Desrosières 2008b, 2008c; Porter 1986, 1995, 2004; Klep and Stamhuis 2002; Stamhuis, Klep, and van Maarseveen 2008; van Maarseveen, Klep, and Stamhuis 2008)
- 5 -
technocratic tyrant, to varying degrees, behind evidence-based decision-making and mainstream management ideologies4 (Davis, Kingsburry, and Merry 2012; Sangolt 2010a;
Brown 2015).
In principle, official statistics enable anyone to observe and assess social, economic and ecological phenomena. They provide evidence for the formation of opinion(s), but they are neither an end in themselves nor a substitute for decisions. They need to clarify the availability of alternatives and facilitate their selection, but without taking sides themselves. They are a political element, not a politics in themselves (Turnpenny et al. 2015). But the temptation of the power in them is strong and their attraction almost magnetic. Therefore, official statistics should not be reserved for use by technical experts. Statisticians need to engage with the public and work intensively and regularly with different users and stakeholders, whether public or private, journalists, researchers or citizens. The goal is to better understand their needs (as users of statistics) and their limitations (as sources of statistics) in order to provide them with adequate information. To do this, statisticians must actively seek to create a positive data culture by becoming more flexible and reactive to ensure that official statistics are understood well (Radermacher 2012a). With the intelligent tools available today, such as interactive graphics, the contents of the partially abstract information provided by official statistics can be communicated much better. Of course, it is very important to strike a balance between the dissemination of understandable messages and a strict focus on technical precision, between excessive simplification and unnecessary complexity, between vulgarisation and overly scientific methods and outcomes. Likewise, the boundaries between objective, quantifiable conditions and subjective impressions must be clearly demonstrated.
This short summary explains the special role and function of official statistics for policy-making.5 Against this background, it should again be emphasised that the mandate of official
statistics cannot be characterised solely by the fact that statistical methods of the social sciences are used. Rather, a wider description is needed to cope with the diversity of official statistics6
in order to cover the following core components:
Official statistics represent a public information infrastructure, a system of informational products that meets a variety of needs, including scientific quality, transparency and excellence. Another element of the ‘Markenkern’ (the brand essence) refers to the subjects of observation, and accordingly the ‘variables’ (such as GDP, employment, income or inflation) that are closely related to policy-making and society, both in concepts and in reality, reflecting highly aggregated artefacts.7 These variables are designed in a separate process (adequacy) before they
can be measured (Grohmann 1985; Radermacher 1992; Radermacher 2017). The process of design is primarily based on an optimal use of the currently available statistical methods. Nonetheless, these variables contain conventions and decisions that, to justify their ‘authority’, must be embedded in democratic and participatory processes. The set of statistical standards (including the statistical programme) is a service provided by official statistics to citizens, entrepreneurs and politicians. It is a valuable asset for official statistics.
4 See in particular Chapter 3.3
5 This role is described in detail in (Porter 1995; Desrosières 1998).
6 Desrosières explains: ‘Almost since its origin statistics has had two different but intertwined meanings: on the one hand denoting quantitative information, collected by the state ... and, on the other, mathematical techniques for treatment of and argument over facts based on large numbers…’ (Desrosières 2010: p 112)
7 ‘Variables’ uses the terminology of Desrosières, which distinguishes between “making numbers” (or “data”) and “making variables” (or statistical “constructs”) and the embedding of variables in more complex models (such as national accounts) (Desrosières 2010: p 114).
- 6 -
Official statistics have very different facets and dimensions, which are related to neighbouring fields of science, the judiciary, industry, design, civil service and the media. Above all, however, official statistics are closely tied to the political position and role of the state as an institution and in particular that of the ‘modern’ nation-state, as it emerged in the nineteenth century. Only when all these roles and dimensions are seen together and understood as a bundle of functions, does one do justice to official statistics. A focus on the scientific function alone is just as irrelevant as an isolated emphasis on the state-political position. As the history of official statistics has shown, progress is blocked (von der Lippe 2012) when the triangle of driving forces (science, statistics, society) is not understood as an ‘eternal golden braid’ (Hofstadter 1979).
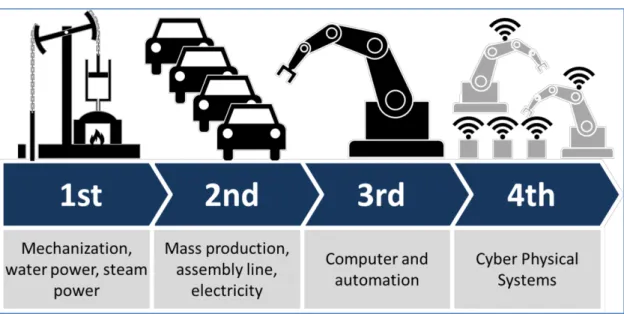
This work will begin in Chapter 2 by describing official statistics, at the current stage of development observable in Western industrial nations, and in particular the EU. The stamp ‘Official Statistics 3.0’ is intended to clarify parallels and associations with the phases of industrialisation.
Fig. 1.2 Industrial Mechanisation8
At the end of a period of automation, official statistics today are considerably more efficient, faster, and better in quality compared to the 1980s. But what has now begun with a comprehensive digitisation of our world demands in many ways a more radical and innovative strategy. In addition, globalisation calls for new answers that cannot always be achieved with continuous development, but that will be accompanied by disruptions and more radical changes. In preparation for deriving conclusions and strategies in Chapter 4, it is helpful, indeed necessary, to take in Chapter 3 a closer look at the driving forces: the scientific background of official statistics as well as episodes from the history of the past 200 years, insofar as they are relevant to the understanding of Statistics 4.0.
- 7 -
2 Official statistics – public informational infrastructure
This chapter is about the ‘making of’ official statistics. The processes, structures and actors that are crucial for the high-quality statistics of the statistics are to be presented. Official statistics are understood as industry that produces information. Consequently, in the presentation, the terms and concepts of modern management are used throughout.
The first section starts with the business model of statistics with its dimensions of the processes (‘how’), the products (‘what’) and the producers (‘who’). It then deals with important overarching topics, such as quality management, national and international statistics, and statistical confidentiality. With a look at the recent modernisation of the business model, the current status of Statistics 3.0 is summarised.
2.1 The business model of official statistics 2.1.1 Core aspects
Many of the essential definitions and foundations of official statistics can be found in the statutory provisions of Regulation 223 on European statistics.9 These represent an agreement
of the partners cooperating in the European Statistical System (EU as well as Switzerland and EEA/EFTA, currently a total of 32 states), but which also applies in other European countries (e.g. candidates for EU accession). 10
The regulation ‘establishes a legal framework for the development, production and
dissemination of European statistics. (Art 1):
The development, production and dissemination of European statistics shall be governed by the following statistical principles (Art 2):
• professional independence • impartiality • objectivity • reliability • statistical confidentiality • cost effectiveness
The statistical principles set out in this paragraph are further elaborated in the European Statistics Code of Practice. The development, production and dissemination of European statistics shall take into account international recommendations and best practice.
The following definitions shall apply (Art 3):
• ‘statistics’ means quantitative and qualitative, aggregated and representative information
characterising a collective phenomenon in a considered population;
9 See more detailed comments on the legal provisions in Radermacher/Bischoff “Article 338” (Radermacher and Bischoff 2018 forthcoming)
10 The European Free Trade Association(http://www.efta.int/about-efta/european-free-trade-association) and the European Economic Area (http://www.efta.int/eea ) and for statistics http://www.efta.int/statistics
- 8 -
• ‘development’ means the activities aiming at setting up, strengthening and improving the
statistical methods, standards and procedures used for the production and dissemination of statistics as well as at designing new statistics and indicators;
• ‘production’ means all the activities related to the collection, storage, processing, and
analysis necessary for compiling statistics;
• ‘dissemination’ means the activity of making statistics and statistical analysis accessible to
users;
• ‘data collection’ means surveys and all other methods of deriving information from different
sources, including administrative sources;
• ‘statistical unit’ means the basic observation unit, namely a natural person, a household,
an economic operator and other undertakings, referred to by the data;
• ‘confidential data’ means data which allow statistical units to be identified, either directly
or indirectly, thereby disclosing individual information. To determine whether a statistical unit is identifiable, account shall be taken of all relevant means that might reasonably be used by a third party to identify the statistical unit’(European Union 2015).
The following sections build on these foundations; they are interpreted and further elaborated.
2.1.2 Knowledge generation
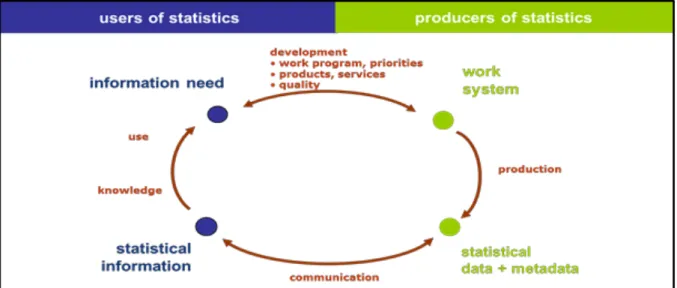
A simplified circular process chart describing the interaction between users and producers of information should help us to understand the main phases in the production and the use of statistical information:
Fig. 2.1: Knowledge generation and statistical production11
- 9 -
The key-processes within the production sphere in Figure 2.1 are12
D: development and design
• Input: Information requests and needs for statistical information expressed in qualitative form (language)
• Output: a work system that contains the necessary statistical specifications (variables, methodology, standards, sampling design, etc.) and concrete prescriptions with regard to the entire work programme and individual production lines
P: production
• Input: specifications of the work system • Output: statistical data and metadata
C: communication/dissemination
• Input: statistical data and metadata • Output: statistical information
In addition, it is essential to include explicitly the following process on the user side
U: creation of knowledge and application
• Input: statistical information
• Output: quantitative response to the qualitative information request
The ultimate goal of statistical evidence is to contribute to better informed decisions of all kind and for all types of users, which can only be achieved when all four processes are considered and integrated in a comprehensive conceptual approach. Each of them should contribute to excellent information quality. Each of them can of course also fail and contribute to errors, misunderstandings and underperformance.
The process D has an external part (dialogue with users) and an internal part (development and testing of methods). Intensive cooperation with users is crucial for the adequacy of the entire process chain that follows.
During the production process P, the methods agreed in the preceding development phase are implemented. It is relatively straightforward to measure the quality of this process and its sub-processes against these predefined norms.
Communication processes C represent the other end of the user interaction. They can also be grouped into an internal part (preparing the results from the production process for different
12 This circular flow chart corresponds to widely accepted standards on the producer’s side, such as the Generic Statistical Business Process Model (GSBPM) (UNECE 2013) or the Generic Statistical Information Model (GSIM) (UNECE 2017).
- 10 -
channels, access points, etc.) and an external part (interaction with users in all formats and through all channels). The internal part also belongs to the set of predefined methods and is in that way similar and closely linked to production.
The processes of application and use U are not under any kind of control or influence by statisticians. It is, however, obvious that users might not be sufficiently prepared or trained to interpret and use statistics in the best possible manner. Statistical literacy is therefore an area of interest also for statistical producers. Furthermore, statisticians should carefully observe cases of wrong interpretation and they must protect their information against misuse.
2.1.3 The process model, business architecture
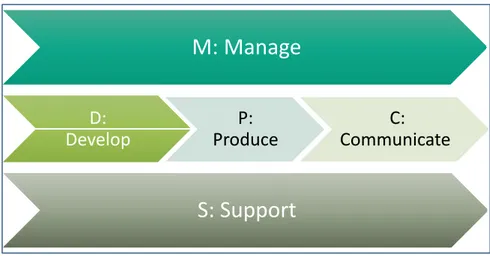
The flow-model of knowledge generation and statistical production process (section 2.1.1) can be further used and elaborated for the creation of a generic process model of official statistics, using the format of an input-output flowchart.
Fig. 2.2 Main processes in official statistics
At the centre are individual production processes of specific statistics, starting with a survey the results of which are condensed in data processing into information that is analysed and published, thus finalising the process. Close to these core processes were also the support processes and corresponding internal services (publication, IT, etc.). A highly branched organisation of these individual processes in isolated ‘silos’ was the historically grown one-to-one relationship between the producers and users of the individual statistical areas13. Thus, the
agricultural statistics produced as closely as possible what was desired by the Ministry of Agriculture; similar in economics, health, energy, etc. In total, this resulted in more than 200 parallel processes: a veritable spaghetti bowl.
Statistics in this logic was tailor made and crafted for the needs of a particular customer (or customer group). For each of these areas, therefore, more or less the entire procedure schematised in the GSBPM (UNECE 2013) has been completed separately and without feedback from similar areas. In such an understanding of the manner in which statistics are produced, there are thus primarily individual production lines which are only weakly and
13 This stovepipe approach in the organisation of work is further strengthened if the financing of statistical branches is separated in different budget lines.
M: Manage
D:Develop ProduceP: CommunicateC:
- 11 -
insignificantly connected to each other. Such strands can therefore be organised, opened, closed and financed without any major impact on other areas.
Information technology has dramatically improved the possibilities of official statistics over the past four decades. However, these new possibilities have ultimately contributed to the fact that the already fragmented organisation disintegrated even more into heterogeneous and inefficient parts. While mainframe information technology was very centralised in the 1970s and 1980s, the introduction of personal computers also resulted in a wave of decentralisation in the 1990s and 2000s.
Not least because of the reduced budgets and resources, this form of official statistics was no longer possible, at least since the beginning of the 2000s. The isolated process organisations lacked efficiency and consistency. Parallel and non-coordinated areas of production have been targeted by reforms and modernisation projects (Eurostat 2009). Generally, this modernisation aims at substituting the stove-piped way14 of working by a new form, i.e. a new business model,
which can be summarised as ‘Multiple Source – Mixed Mode Design’ at the data-input side, with a ‘Multipurpose Design’ at the information-output side and with a modularisation of exchangeable process elements15 within a standardised business architecture at the centre of the
statistical factory. This will be discussed in more detail in section 2.6.
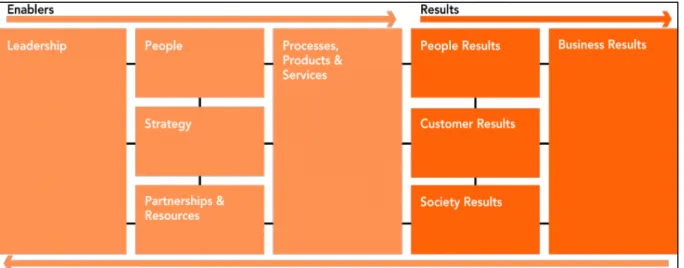
In this context, statistical offices considered ways of making production more uniform so as to be more efficient and effective. The result of these considerations led to a kind of industrialisation of the processes with the typical components, i.e. standardisation (of methods, IT applications, etc.), centralisation of common components (IT, auxiliary services, etc.) and, last but not least, the introduction of an overarching business architecture as an ordering system. The flowchart in Fig 2.3 explains this architecture in a very simplified and graphical manner.
14 This way of producing statistics in parallel but only weakly coordinated processes could be called a ‘vertical organisation’.
- 12 -
Fig. 2.3 Business architecture of official statistics16
- 13 -
Such a business model of the ‘factory’ is still relatively new and does not necessarily meet with the approval and sympathy of those who work in this institution. Centralisation and standardisation are perceived as a loss of self-responsibility, and the replacement of a craft by an industrial model is sensitive to the professional self-understanding of statisticians. Nevertheless, there is no way around this approach. Too powerful and urgent are the constraints of the general political situation and the dynamics of developments in information and communication technology.
2.1.4 Modes of data collection
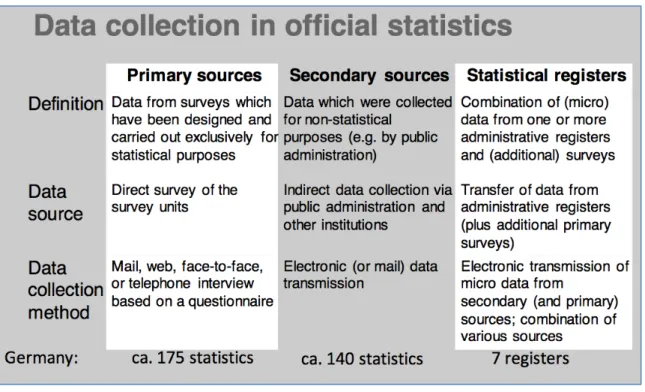
It is one of the myths about official statistics that it is exclusively based on self-collected data. While this is true for large areas of economic and social statistics, in other areas, such as demography, health care statistics or education statistics, however, existing data sources are being evaluated. This has never been different; rather, it has been a standard approach, at least in the early days, before high-quality sample surveys were methodically enabled. Primary sources of data collection under the control and responsibility of the statistical office make up not more than half of the processes, while others evaluate existing (secondary) data sources, including registers. Even if this picture refers to the situation in Germany in 2008 (see Fig. 2.4), it is representative of the fact that official statistics is by far not a data collection engine.
Fig. 2.4 Primary and secondary modes of data collection – Germany 200817
However, the data from different sources were generally not merged and used together to generate information. Rather, it was left to the users, in case of parallel running statistics with different origins, to make the right choice for themselves. Merging data from different sources requires rules (and algorithms) that allow synthesis to be transparent and not arbitrary; this would violate basic principles. For a long time, it was not considered to be the job of official
- 14 -
statistics to do this ‘blending’. Instead, more restraint was maintained, and unprocessed results were provided. Last but not least, producers and users at that time agreed in the conviction that survey data were seen as superior to administrative data sources. Only in national accounts was it considered inevitable and opportune to distil the best possible information from multiple data sources, to close data gaps with estimates in order to arrive at a complete and consistent picture. This has changed.
The primacy of survey data over existing data sources was unsustainable for many reasons. In the end, it was a mixture of increasing availability of data in (administrative as well as statistical) registers, the potential of new IT (online transfer of data), cost pressures, and dissatisfaction of respondents with statistical burdens that reversed the prioritisation to its opposite. According to a modern prioritisation, it is appropriate and legitimate to collect data if and only if these data cannot already be obtained from existing sources of satisfactory quality. This opens a door to a completely different business model with fundamental changes in the tasks of a statistical office, with new components in the methodological toolbox (e.g. record linkage), with adaptations of the statistical governance, e.g. the creation of legal-administrative conditions (access to some sensitive administrative data18) as well as changes in quality
management and in communication to users.
One might have the impression that the melange between survey and administrative data is nothing but replacing an item in a questionnaire by a similar piece of data from a register. This impression has been shown to be much too simplistic and not realistic.19 Instead, the entire
design of one statistical process has to be reviewed and (quite often) revised. It is a long way from the classical design, where a traditional (‘knock on the door’) census survey every ten years was alternating with yearly interpolations of the population from administrative registers to a modern (fully integrated) design, where a regular matching of administrative and (sample) survey data ensures the best possible capturing of high dynamics in population changes on a continuous (yearly) bases, delivering a completely different mix of quality features (improvements in timeliness, coherence at the expense of accuracy in the traditional census years). It is hardly possible to overestimate the difficulties of change management in the transition from the traditional to the new design. Not all users are winners in such a change and not all producers welcome the changed production and their products.
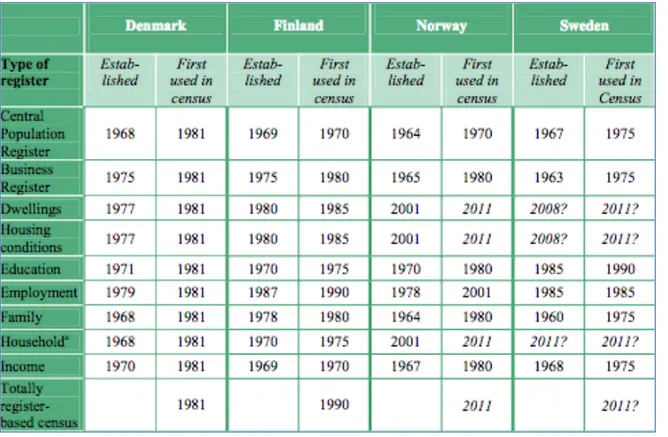
In particular, the Nordic countries have reengineered their statistical systems by shifting them entirely to the prioritised use of registers (see Fig. 2.5).
18 See for example Bundesstatistikgesetz, § 5a Nutzung von Verwaltungsdaten
(https://www.destatis.de/DE/Methoden/Rechtsgrundlagen/Statistikbereiche/Inhalte/010_BStatG.pdf?__blob=pub licationFile )
19 See for example “Good practices when combining some selected administrative sources”
- 15 -
Fig. 2.5 The year of establishing registers in population censuses20
This Nordic way cannot be followed in the same manner by every country. The legal conditions of access to individual data corresponding to administrative practices and political as well as cultural conditions (presence of high-quality registers, trust of citizens in government institutions, etc.) are too different. Nonetheless, the fundamental approach is widely used in the reality of official statistics nowadays. The trend towards population censuses, which are created entirely or partially from register data, illustrates this statement.21
In this respect, the consideration and interaction of ‘big data’ is nothing fundamentally different; the paradigm shift has already taken place. However, the task of statistics is further complicated because the possibility to influence the nature and structure of this external data continues to diminish (more precisely: no longer exists), but at the same time the general pressure and the expectation that it has to be used has increased immensely.
2.1.5 The portfolio of products (and services) 2.1.5.1 Statistical products (and services)
As a starting point for the consideration of statistical products, the definition in EU regulation 223 is used again: ‘‘statistics’ means quantitative and qualitative, aggregated and
representative information characterising a collective phenomenon in a considered population’(European Union 2015: Art 3).
20 Source: (UNECE 2007: 5)
- 16 -
For an understanding of the functioning and internal organisation of official statistics, it is necessary to arrange different levels and types of statistical information according to their degree of aggregation and their quality profile.
At European level,22 the following types of statistical products are distinguished:
• ‘Data: information collected by statistical authorities, via traditional statistical activities
(sample surveys, censuses, etc.)/data from other sources, re-used for statistical purposes. This information is tailored to serve needs in specific policy areas, e.g. the labour market, migration or agriculture. The term also includes data collected for administrative purposes but used by statistical authorities for statistical purposes (usually referred to as data from administrative sources).
• Accounting systems: coherent and integrated accounts, balance sheets and tables based on
a set of internationally agreed rules. An accounting framework ensures a high profile of consistency and comparability; statistical data can be compiled and presented in a format that is designed for the purposes of analysis and policy-making.
• Indicators: an indicator is a summary measure related to a key issue or phenomenon and
derived from a series of observed facts. Indicators can be used to reveal relative positions or show positive or negative change. Indicators are usually a direct input into EU and global policies. In strategic policy fields they are important for setting targets and monitoring their achievement.’
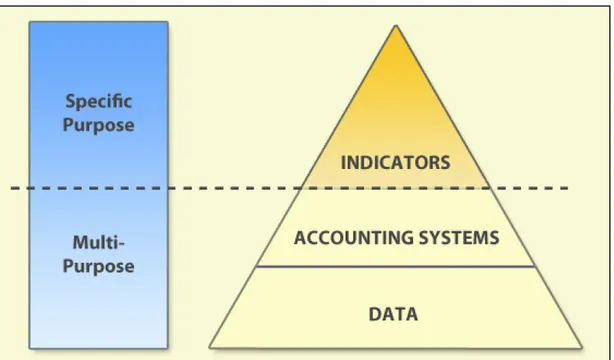
This view can be condensed to an information pyramid:
Fig. 2.6 The information pyramid of official statistics23
22 See the European statistical programme 2013–2017 (European Union 2011: p 20) 23 Source: European statistical programme 2013–2017 (European Union 2011: p 20)
- 17 -
Primarily, this presentation relies on a distinction of different aggregation levels, i.e. a level with many details (i.e., micro) for the basic statistics and a level with more abstract aggregates and models (i.e., macro) for accounts and indicators.
Furthermore, basic statistics and accounts are characterised as multipurpose,24 while indicators
are closely tied to a specific use and determination.
• ‘Multipurpose’ makes clear that such statistical information has the character of an infrastructure designed for wide and diverse use. Basically, this makes their design quite difficult because the different users and user groups have quite different ideas and priorities regarding what they need as information. What the quality label ‘fitness for purpose’ means in such statistics is therefore anything but trivial. How this problem is addressed is explained in section 2.3.
• In contrast, indicators are closely tied to a specific question and task. In particular for European policies, it is typical that they provide and promote decision-making and governance based on indicators. This has the great advantage that the information requirements are usually very well known. Whether the statistics are ‘fit for purpose’ can therefore be assessed quite precisely. On the other hand, this closeness to political decisions (sometimes linked to immediate sanctions or other consequences) also carries considerable risks, which are discussed in Chapter 3.
Although this is not a strict and non-overlapping order, the approach helps to better describe the products, the processes and different quality profiles so that they can be better planned, managed and communicated.
The business model of modern statistics includes not only the products but also statistical
services. This includes, above all, special services for individual users. For example, a statistical
office may provide tailored analysis of its data of interest to individual users (e.g. businesses or media) or user groups (industry associations or NGOs). For research and teaching, elaborate work is carried out to allow access to microdata without jeopardising the confidentiality of individual data.
2.1.5.2 The product portfolio
As one would expect from an industry, the products are grouped and managed together in one complete programme, one ‘portfolio’. With the help of such a portfolio, internal planning and decisions (priorities) are made possible and a controlling (costs, quality) can be built up. It is very important for communication with users to offer the portfolio in such a form that they can get a good overview of the available information that enables them to make their own choices. For the sake of clarity, reference is made below to European statistics as an example. In the multi-annual planning of the statistical programme, this systematic approach was used to structure the portfolio of products.
The entire portfolio of products is listed according to this logic in a ‘catalogue’ that is used for internal purposes (planning, costing, management) as well as for the structuring of the database and website and for external communication purposes. Although the result in the form of such a catalogue seems logical, even trivial, it took a remarkably long time to agree on such a standardised structure and presentation. Given the very different cultures within the
24 This consideration and distinction is only recent. It results from the modernisation process of the last 20 years, which will be presented in a later section.
- 18 -
professional communities in official statistics, practices and well-trodden ways of production and similar resistance had to be overcome in order for this standard to be introduced. However, this is not unusual; rather, it is the fate of any form of standardisation.
At this point, it is not necessary or useful to present and review this catalogue in detail. Nevertheless, it is interesting to know what information such a catalogue contains about statistical products. As can be seen from the excerpt from the European statistics catalogue in Fig. 2.7, the products are given standardised names; they are coupled with the relevant production process, the temporal and regional resolution is given, and the main users and the legal basis are mentioned.
- 19 -
Fig. 2.7 Eurostat Catalogue of Products25 (extract)
- 20 -
In the course of modernising official statistics (especially in Europe), it is becoming increasingly important to define modules and services that can be exchanged and shared within an agreed and standardised business architecture. A common product catalogue created, shared and applied by all producers in the statistical system of Europe therefore represents a decisive step forward on the path to efficient value chains and close cooperation between the partner institutions. In addition to the product catalogue, a service catalogue will increasingly play a major role.26
2.2 Skills and human resources
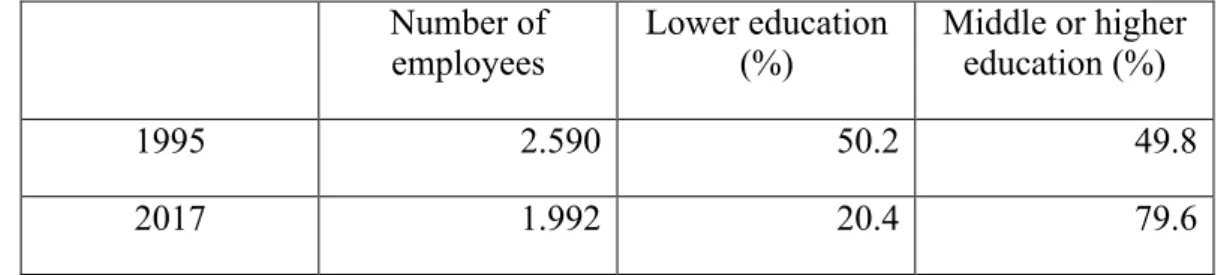
The decisive factor for the quality of statistics is the staff of the statistical institution. First and foremost, of course, this means that the statistical institution must have a sufficient number of sufficiently qualified professionals. In recent decades, there have been major changes in the amount and structure of staff. While the absolute number of employees has tended to decrease, the proportion of academically trained and qualified employees has increased.
Fig. 2.8 Staff in statistical offices – example: Statistics Netherlands27
Number of
employees Lower education (%) Middle or higher education (%)
1995 2.590 50.2 49.8
2017 1.992 20.4 79.6
Fig. 2.9 Staff in statistical offices – example: Statistics Denmark28
Number of
employees Clerks (%) Academics (%) IT (%)
1995 567 54.2 28.4 17.4
2017 567 11.1 61.2 11.4
26 See for example (Eurostat 2016d).
27 For example, the annual report 2015 of the CBS of the Netherlands expresses this in the following way: ‘The increasing complexity and further automation of statistical processes are contributing to the decline in the amount of semi-skilled and unskilled work and the increasing need for more highly educated staff. This is reflected in the composition of the workforce by job grade. In 2015, 77% of staff were in scale 9 or above. By comparison, the proportion in 1995 was only 50%’ (CBS 2016b: p 20). Other (unpublished) figures, provided by CBS.
- 21 -
Fig. 2.10 Staff in statistical offices – example: Statistics Denmark29
29 Unpublished figures, provided by Statistics Denmark.
0,0 10,0 20,0 30,0 40,0 50,0 60,0 70,0 80,0 90,0 100,0 1966 1968 1970 1972 1974 1976 1978 1980 1982 1984 1986 1988 1990 1992 1994 1996 1998 2000 2002 2004 2006 2008 2010 2012 2014 2016 2018 Academics Clerks IT
- 22 -
In this respect, the same development has taken place in official statistics as in other industries, where quantity has been substituted by the quality of the employees. This is the move from Official Statistics 2.0 to 3.0: from a manual to an industrial production of statistical products based on an all-embracing use of information technology.
Another very important consideration is the professional composition of the staff. In the previous sections, the variety of products and processes was explained. Ideally, experts and their knowledge would be available for all products and processes. Of course, that is not possible. In addition, the diversity is too large and the supply on the job market too limited. Above all, however, there is a lack of specialised training, from which graduates could be recruited for official statistics tasks. In addition, it has been shown in recent years that the dynamics of change are so great that, in any case, vocational training and internal training on the job are the more important qualification methods.
Which qualifications and professional orientations are actually needed? Which competences should be available among the team in the statistical office?
First, in the classic field of statistical production (including the development of methods, products and processes), one could falsely assume that primarily statisticians would come into play, who are familiar with survey techniques. This is true, but only in the areas in which data about surveys are originally collected, e.g. in a wide range of social statistics or business statistics.
With the increasing importance of administrative data and registers as a source of official statistics, the profile of requirements has already changed in recent years. Of course, if work processes no longer start with collecting data, and if instead existing data needs to be analysed, filtered, and aggregated to meaningful information, the job profile will change accordingly. With the omnipresence of big data the working conditions will undergo even further dramatic change, which again requires new personal skills, knowledge and experience.
This does not mean that training in survey methodology is or will become irrelevant. Rather, paths must be taken in which these competencies are embedded in methods of data sciences and the management of complex production processes.
Second, it requires expertise in the area of accounts, be it the macroeconomic, social (health, education ...) or environmental accounts. A solid education in economics with emphasis on the empirical focus on national accounts is absolutely necessary here.
Third, and this is still a relatively recent domain, knowledge in the field of indicator methodology is needed. Needless to say, this requires a mix of statistical methods, communication skills and a sensitivity for the policy dimension of the specific indicator (being aware of the respective opportunities and threats related to the closeness to policy-making). Fourth, statistical office staff are expected to have sufficient knowledge of the area of application for which they are responsible. This can be a more specific and narrow area, such as agricultural, energy or health, or a wider one, such as business cycle, labour market or sustainable development.
Fifth, it is of course of strategic importance to have the necessary expertise in the fields of information and communication technologies available. However, due to the very dynamic development, it is increasingly difficult or even impossible to maintain this expertise in-house. An outsourcing of such services and the corresponding personnel capacity is essential.
- 23 -
Sixth, today it is more important than ever to have specialists in the field of communication and media in the team.
Finally, in today’s administrations it is not only the classical administrators but also skilled professionals of modern management (quality management, controlling, cost accounting etc.) who play an important role.
However, the actual composition of the staff depends very much on external factors and framework conditions: Are appropriate training courses offered at the universities? Is the statistical office attractive and competitive on the (local) labour market? In order to improve conditions in this regard, European statistics has launched ‘EMOS’,30 a Master’s degree
programme designed to better prepare graduates for their employment in official statistics. The difficulties that official statistics face in human resources are changing over time. For example, it has become increasingly problematic to find well-trained economists for working in national accounts; apparently, the empirical dimension plays only a subordinate role in today’s economics studies. In the context of digitisation, developments will take place, which must also be reflected in the composition of personal and professional skills. Finally, in the future, more attention will have to be paid to the interplay and interactions of statistics and society, which also requires corresponding specialist capacities. This corresponds with the topic of the present work.
For the sections that follow (in particular, the section on quality), it is important to understand the interaction between the composition of the staff and the statistical culture that is emerging in different areas of work. As a rule, two communities are represented and these could hardly be more different in their views and ways of working.
On the one hand, there are the survey statisticians (especially in the field of social statistics), whose quality reliance is based on the fact that the entire production process of survey design (from data collection and processing to the generation of aggregated results) is under their control. Here, quality aspects such as reliability and punctuality are in the foreground, while a complete coverage of a topic or consistency are seen as of minor importance. Such an approach is called ‘micro’.
On the other hand, in the field of accounting, the primary concern is a complete and consistent picture of a situation or a subject matter area, while accuracy in details plays a minor role. Such approaches are called ‘macro’.
From these two approaches and cultures arise, in some cases, considerable (micro-macro) differences in the statistical results on the same topic.31 Because of this, it is difficult to subsume
the quality of statistical products under a single definition.
2.3 Quality in official statistics
2.3.1 Quality – an old objective – a young concept
In order for official statistics to function as a language, a ‘boundary object’ (Stamhuis 2008; Saetnan, Lomell, and Hammer 2011) for all kinds of societal interactions and decision-making,
30https://ec.europa.eu/eurostat/cros/content/what-emos_en
- 24 -
it is essential that the quality of statistical products and services is outstanding, an authority in itself. For Porter, ‘the language of quantification may be even more important than English in the European campaign to create a unified business and administrative environment’ (Porter
1995: p 77). This is the brand-mark and the competitive advantage of official statistics. Once this authority is undermined, be it through real quality problems or only through perception, trust in official statistics will be replaced by suspicion and statistics will become part of political fights and games. Against this background, it is important to define quality of statistics with a much wider scope, including not only the production but also the use side of statistical information and how these two sides are interacting in a dynamic relationship.
As a consequence, the approach to quality in official statistics has changed radically over the past two decades. According to today’s prevailing opinion, statistics must be suitable for a particular utilisation: this is the criterion ‘Fitness for Purpose!’ However, unlike the earlier producer-related view and definition of quality, this new objective leads to a very complex world in which simple and one-dimensional solutions are no longer possible or appropriate. Central to the remarks is to understand statistics as products, products of a larger whole (the portfolio), produced under given conditions and constraints and aimed at serving a not necessarily sharply defined group of users. For every single product as well as for the entire portfolio, it is important to find a (‘Pareto’) optimal solution, meaning to achieve the best of all possible solutions for each statistic and for the statistical program as a whole (Radermacher 1992, 1999). This may sound abstract and difficult. However, it becomes plausible and practically solvable in an evolutionary process, with year-by-year changes in planning and production.
In European statistics, the first systematic steps in the area of statistical quality were made at the end of the 1990s through cooperation in the ESS Leadership Group (LEG) on Quality Initially, the LEG was struggling with difficulties inherent in the convergence of two schools of thought: classical approaches from statistical methodology and approaches from industrial quality management. It was very much in the spirit of W.E. Deming’s32 view on ‘profound
knowledge’, quality management and learning organisations, which the LEG had finally elaborated in a synthesis report, including 21 recommendations for European statistics (Lyberg et al. 2001).
2.3.2 Quality objectives and means to reach them
Unfortunately, there is no unified glossary of quality terms in official statistics. A search on the corresponding page of the OECD gives a total of 131 hits.33
Therefore, a more general approach to the topic of quality in statistics will be made here, before going into the various aspects in detail.
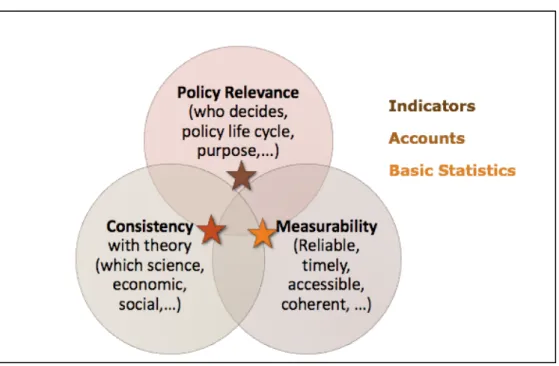
Statistical information should, as far as possible, meet three different requirements (see Fig. 2.11).
First, it should provide information about a phenomenon that is relevant to answering current questions. Statistics that interest nobody cannot be part of the tight budget of a statistical office. Here, of course, one is immediately confronted with the crucial problem that concerns the selection of topics and issues to which this relevance relates. So, who determines the statistical programme in the end?
32 See (Deming 2000a).
- 25 -
Second, the statistics should be supported by a theory, i.e. they should meet scientific standards. In this regard, it has to be clarified which theory is meant here. For the national accounts, the case is comparatively clear: they are closely linked to the macro economy. Less clear, however, is this objective in the remaining areas, even if close links exist between empirical research and official statistics. In the more recent areas (environment, sustainable development), the situation is particularly difficult because of the various disciplines involved.34
Third, of course, statistics should meet the criteria of measurability, they should be reliable, punctual, comparable and accessible, to name but a few.
Fig. 2.11 Dimensions of statistical quality
Apparently, different aspects and categories play a role in the (multidimensional) definition of statistical quality. Additionally, because it is not possible, under normally limited circumstances (costs, time, staffing, willingness to provide information), to fully meet all these objectives at the same time, priorities must be set, e.g. in the statistics programme or in the selection of statistic variables.
In this respect, it is advantageous that in the portfolio of statistics different products are included, which embody with their special quality profile, in different ways, the three objectives of relevance, consistency and measurability. While basic statistics in their great diversity are very much aligned with the goal of measurability, National Accounts focus on scientific consistency within a specific theory. In turn, indicators are closer to the goal of relevance. In this respect, the different types of statistical products are not only located at different levels of the information pyramid, but also complement each other.
In the European statistics the basic elements of such a quality approach are manifested in Regulation 223 (European Union 2015: Art 12):
- 26 -
‘European statistics shall be developed, produced and disseminated on the basis of uniform standards and of harmonised methods. In this respect, the following quality criteria shall apply: a) ‘relevance’, which refers to the degree to which statistics meet current and potential needs of the users;
(b) ‘accuracy’, which refers to the closeness of estimates to the unknown true values;
(c) ‘timeliness’, which refers to the period between the availability of the information and the event or phenomenon it describes;
(d) ‘punctuality’, which refers to the delay between the date of the release of the data and the target date (the date by which the data should have been delivered);
(e) ‘accessibility’ and ‘clarity’, which refer to the conditions and modalities by which users can obtain, use and interpret data;
(f) ‘comparability’, which refers to the measurement of the impact of differences in applied statistical concepts, measurement tools and procedures where statistics are compared between geographical areas, sectoral domains or over time;
(g) ‘coherence’, which refers to the adequacy of the data to be reliably combined in different ways and for various uses.’
2.3.3 Code of Practice
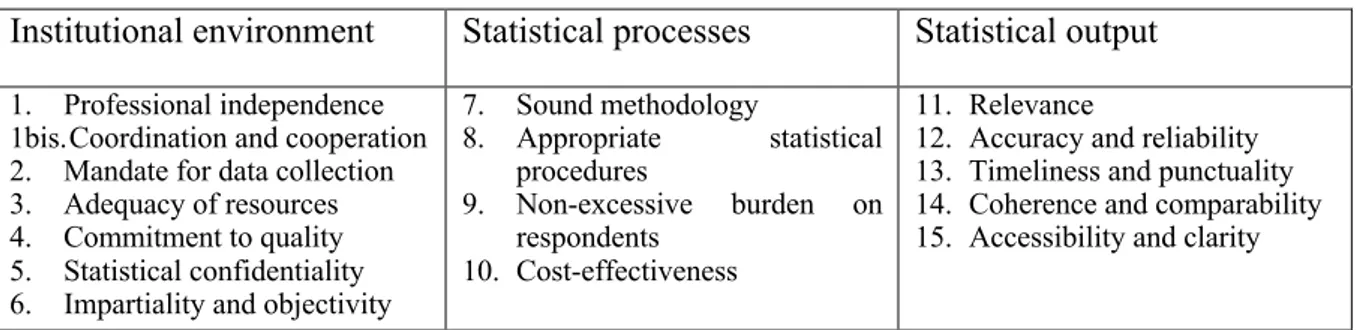
In European statistics, in this regard, one has agreed upon a structure – one could also say classification – further elaborated35 and manifested in the Code of Practice (Eurostat 2011): ‘The European Statistics Code of Practice sets out 15 key principles for the production and dissemination of European official statistics and the institutional environment under which national and Community statistical authorities operate. A set of indicators of good practice for each of the 15 principles provides a reference for reviewing the implementation of the Code’.
The European Statistics Code of Practice was adopted by the Statistical Programme Committee in 2005 and was revised by the European Statistical System Committee in September 2011 and 2017 (Eurostat 2018b).
35 EU Regulation 223: ‘The statistical principles set out in this paragraph are further elaborated in the Code of Practice’ (European Union 2015: Art 12 Para 1)
- 27 - Fig 2.12 European Statistics Code of Practice
ES Code of Practice:
• ‘Institutional environment
o Institutional and organisational factors have a significant influence on the effectiveness
and creditability of a statistical authority developing, producing and disseminating European Statistics. The relevant issues are professional independence, mandate for data collection, adequacy of resources, quality commitment, statistical confidentiality, impartiality and objectivity
• Statistical processes
o European and other international standards, guidelines and good practices are fully observed in the processes used by the statistical authorities to organise, collect, process and disseminate European Statistics. The credibility of the statistics is enhanced by a reputation for good management and efficiency. The relevant aspects are sound methodology, appropriate statistical procedures, non-excessive burden on respondents and cost effectiveness.
- 28 -
• Statistical output
o Available statistics meet users’ needs. Statistics comply with the European quality standards and serve the needs of European institutions, governments, research institutions, business concerns and the public generally. The important issues concern the extent to which the statistics are relevant, accurate and reliable, timely, coherent, comparable across regions and countries, and readily accessible by users.’
This short summary makes it clear that the quality concept follows the three dimensions that were already introduced at the beginning (see Fig. 2.13): Who? (Institutions), How? (Processes) and What? (Products). Like the Code of Practice itself, the way it is implemented is significantly inspired by the methods of Total Quality Management (TQM). This is mainly reflected in the Quality Assurance Framework QAF (Eurostat 2018d).
Fig. 2.13 Quality criteria for European statistics36
Institutional environment Statistical processes Statistical output 1. Professional independence
1bis. Coordination and cooperation 2. Mandate for data collection 3. Adequacy of resources 4. Commitment to quality 5. Statistical confidentiality 6. Impartiality and objectivity
7. Sound methodology 8. Appropriate statistical procedures 9. Non-excessive burden on respondents 10. Cost-effectiveness 11. Relevance
12. Accuracy and reliability 13. Timeliness and punctuality 14. Coherence and comparability 15. Accessibility and clarity
It is essential to the success of quality management that the governance (the ‘who?’) Is thoroughly thought through and implemented in a timely manner. With the Code of Practice, e.g. in Europe, the committees of statistics are being reformed. Among other things, a supervisory board (European Governance Advisory Board37) was established. In addition, peer
reviews38 for the producers of European statistics were carried out at longer intervals.
For the part of European statistics produced by the ECB and the national central banks a similar quality framework is in place (ECB 2018).
The existence of codes of conduct in official statistics is still comparatively new, introduced in the past three decades. First, ethical standards for the professional statistician were adopted by the International Statistical Institute (ISI) in 1985 (ISI 2018); in 2010, the declaration of professional ethics followed (ISI 2010).
36 The 2017 edition of the CoP is based on 16 principles 37 See (ESGAB 2018).