miR-139-5p-PI3K/AKT/mTORC1 network has a role in
supratentorial pediatric Low Grade Gliomas (pLGGs)
Candidata: Martina Chiacchiarini Matr. 1318814
Relatore: Prof.ssa Elisabetta Ferretti
PhD in Molecular Medicine
XXXII Cycle
Summary
1. Abstract ... 3
2. Introduction ... 4
2.1 Pediatric low-grade gliomas ... 4
2.2 MircoRNAs ... 13
2.2.1 MicroRNAs biogenesis ... 13
2.2.1 MicroRNAs and cancer... 15
2.2.3 MicroRNAs in pLGGs ... 16
3. Aim of work ... 18
4. Materials and methods ... 19
4.1 Tumour samples and controls ... 19
4.2 Patient-derived primary pLGG cell cultures ... 20
4.2.1 Culture and characterization ... 20
4.3 Histology ... 21
4.4 RNA extraction of pLGG tissues and cells ... 21
4.5 Analysis of BRAF status ... 21
4.6 MicroRNA profiling and data analysis ... 25
4.6.1 MicroRNAs clustering analysis ... 25
4.6.2 DIANA mirPath analysis ... 25
4.7 Cell treatments... 26
4.8 DNA methylation array data generation ... 26
4.9 Immunofluorescence studies ... 27
4.10 Senescence-Associated-β-galactosidase activity ... 27
4.11 Western Blotting ... 28
4.12 Statistical Analysis ... 28
5. Results ... 29
5.1 Genetic alterations of the pLGG cohort ... 29
5.2 MicroRNA profiles of pLGGs ... 29
5.3 PI3K/AKT signaling is enriched in pLGG ... 47
5.4 Patients derived pLGG cells and characterization... 48
5.6 miR-139-5p has a role in the control of PI3K/AKT/mTORC1 signaling in supratentorial pLGGs ... 53 6. Discussion ... 58 Bibliography ... 62
1. Abstract
Aim: Pediatric low-grade gliomas (pLGGs) are a heterogeneous group of brain tumours associated with a high overall survival: however, they are prone to recur and supratentorial lesions are difficult to resect, being associated with high percentage of disease recurrence. Our aim was to shed light on the biology of pLGGs.
Methods: We performed microRNA profiling on 45 fresh-frozen grade I tumour samples of various histological classes, resected from patients aged ≤16 years. We identified 93 microRNAs specifically dysregulated in tumours as compared to non-neoplastic brain tissue. Enriched pathway analysis of the microRNAs signature revealed PI3K/AKT signaling as the first enriched oncogenic signaling. Although, activation of the PI3K/AKT pathway has been previously reported in these tumours, the activation mechanisms that are involved have not been investigated yet.
Results: Among significantly down-regulated microRNAs in supratentorial pLGGs cohort the miR-139-5p was of interest since its targets include the gene encoding the PI3K’s (phosphatidylinositol 3-kinase) catalytic unit, PIK3CA. Thus, the role of miR-139-5p in regulating PI3K/AKT signaling has been investigated by the use of primary patients derived cells. In these models the overexpression of miR-139-5p inhibited pLGG cell proliferation and decreased the phosphorylation of PI3K target AKT and phosphorylated-p70 S6 kinase (p-p70 S6K), a hallmark of PI3K/AKT/mTORC1 signaling activation. The effect of miR-139-5p was mediated by PI3K inhibition, as suggested by the decrease in proliferation and phosphorylation of AKT and p70 S6K after treatment with the direct PI3K inhibitor LY294002.
Conclusions: These findings provide the first evidence that down-regulation of miR-139-5p in supratentorial pLGG drives cell proliferation by derepressing PI3K/AKT signaling.
2. Introduction
2.1 Pediatric low-grade gliomas
The most commonly diagnosed brain tumours in children are low-grade gliomas (LGGs), representing over 30% of tumours affecting the Central Nervous System (CNS) (Packer R.J. et al., 2016). Pediatric LGGs (pLGGs) include different entities, as defined by the recently revised World Health Organization (WHO) Classification of Central Nervous System (CNS) Tumours, which is based on both histological and molecular features (Louis D.N. et al., 2016).This classification identifies nine categories of CNS tumours, of which four include tumours of glial or glioneuronal origin:
- Diffuse astrocytic and oligodendroglial tumours - Other astrocytic tumours
- Other gliomas
- Glioneuronal tumours
Furthermore, the WHO classification system categorizes these tumours starting from grade I (lowest grade) to grade IV (highest grade), based upon histopathologic characteristics such as:
• similarity with normal cells (atypia); • growth rate (mitotic index);
• growth rate and death of tumour cells in the neoplastic focus (necrosis); • potential diffusion rate (widespread or focal);
• blood flow (vascularization)
Low-grade gliomas (LGGs) consist of grade I tumours, which contain none of the mentioned histologic features, and grade II tumours, characterized by the presence of cytologic atypia alone (Louis D.N. et al., 2016), and are classified in:
Table 1. Classification of diffuse gliomas.
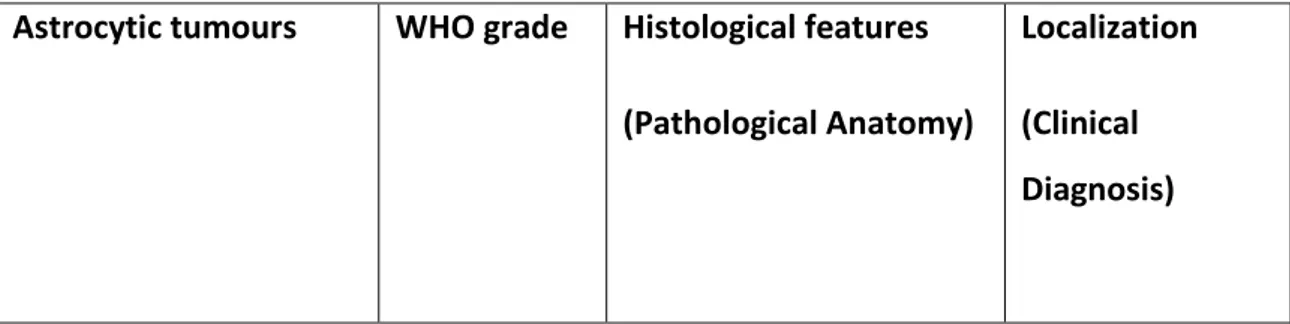
Table 2. Classification of astrocytic tumours.
Diffuse gliomas WHO grade Histological features
(Pathological Anatomy) Localization (Clinical Diagnosis) Diffuse Astrocytoma (DA)
II Irregular nucleus and
hyperchromia; low mitotic index and absence of vascular proliferation.
Brain
hemispheres. In pediatric age it can also arise in the brain stem or in the spinal cord. Oligodendroglioma
(OG)
II Regular and uniform
nucleus, clear
cytoplasm, with a definite aspect to "honeycomb".
Bark and white matter of the brain hemispheres. Oligoastrocytoma (OA) II Mixed characteristics
between the two cell types.
Brain
hemispheres.
Astrocytic tumours WHO grade Histological features
(Pathological Anatomy)
Localization (Clinical Diagnosis)
Pilocytic astrocytoma (PA)
I Biphasic architecture
with compact areas and non-homogeneous areas. The former show "piloid" processes and often multiple Rosenthal fibers. The latter show eosinophilic granular bodies. Limited mitoses.
Generally in the cerebellum, optical pathways, III ventricle. Sometimes basal ganglia or cerebral hemispheres. Astrocytoma Pilomixoid (PMA)
II Fusiform cells associated
with perivascular
dispositions on a loose fibrillar and myxoid background lacking Rosenthal fibers. At the level of the chiasmus. Gigantocellular Subependimal Astrocytoma (SEGA) I High phenotypic variability, hyalinization of the blood vessel wall, lymphocyte infiltrates and calcification. Furthermore, mitotic activity can be observed.
It originates in the wall of the lateral ventricles, near the foramen of Monro.
Pleomorphic Xanthoastrocytoma (PXA)
II Large, pleomorphic
tumour cells; often they have many eosinophilic and aggregated granular bodies of lymphocytes.
Predominantly in the cerebral hemispheres.
Table 3. Classification of other gliomas.
Table 4. Classification of glioneuronal tumours.
Other gliomas WHO grade Histological features
(Pathological Anatomy) Localization (Clinical Diagnosis) Angiocentric glioma (AG) I Tumour characterized by monomorphic, bipolar or less frequently epithelial cells with parallel or radial orientation to the vessel walls.
Brain
hemispheres.
Astroblastoma I Tumour cells with large
cytoplasm, radially oriented around blood vessels with extensive processes.
Brain
hemispheres.
Glioneuronal tumour WHO grade Histological features
(Pathological Anatomy)
Localization (Clinical Diagnosis)
The vast majority of pLGGs are pilocytic astrocytomas (PAs, Figure 1), and they are therefore the ones that have been studied most thoroughly.
Ganglioglioma (GG) I Cancer ganglion cells
generally have dysmorphic features and abnormal orientation. They often have granular eosinophilic bodies. Temporal lobe. Ganglioglioma/ Astrocytoma infantile desmoplastic (DIG/DIA) I Characterized by the presence of a
desmoplastic stroma rich in reticulina Brain hemispheres Disembrioplastic Neuroepithelial Tumour (DNET) I Specific glioneuronal component, represented by axonal extensions surrounded by oligodendrocytes immersed in patches of loose substance in which the neuronal bodies seem to "float".
The temporal lobe, the floor of the III ventricle and the
Figure 1. Distribution of histological subtypes of CNS tumours between adolescents and children. (Filbin
M.G. et al., 2018)
These tumours are driven by dysregulated signaling through the MAPK/ERK pathway, which leads to growth arrest referred to as oncogene-induced senescence (OIS) (Pfister S. et al., 2009; Packer R.J. et al., 2016). Less is known about the biological characteristics of less common pLGGs which include, among others, gangliogliomas (GGs), disembryoplastic neuroepithelial tumours (DNETs), and angiocentric gliomas (AGs). The location of pLGGs also has a major impact on the patients’ outcome since it determines the tumour’s resectability. Infratentorial pLGGs, which occur mainly in the cerebellum, can often be cured by surgery. Supratentorial tumours and those arising in the brainstem are much more difficult to resect, and residual or recurrent disease is, therefore, a common event. The latter are treated with radiotherapy or conventional chemotherapy (e.g. SIOP-LGG 2004 protocol). However, both treatments are associated with substantial long-term toxicity, and these tumours frequently evolve into chronic disease with high morbidity (Pfister S. et al., 2009; Packer R.J. et al., 2016; Zhang J. et al., 2013; Garcia M.A. et al., 2016; Sturm D. et al., 2017).
The genomic landscape of pLGGs is now being defined. The most frequent genetic alterations are the KIAA1549-BRAF fusion gene and the BRAF V600E single point mutation (Zhang J. et al., 2013). The BRAF gene is located on the long arm of chromosome 7q34 and encodes a protein involved in the MAPK signaling pathway, which is a conserved signaling cascade, which utilizes a series of protein kinases to transduce signals from the cell membrane to the nucleus, Figure 2. It plays a crucial role in mediating a range of biological functions, including cell growth, survival, and differentiation.
Figure 2. Schematic representation of the MAPK pathway. The initiating event in MAPK pathway
activation occurs when an extracellular ligand binds to one of several cell–surface receptors. The receptor-ligand complex activates an intracellular signaling cascade with the binding of RAS to GTP and its consequent activation. This process can be reversed by some GTPases, such as Neurofibromine 1 (NF-1), which catalyze the conversion of the active RAS-GTP form to the inactive RAS-GDP form. When RAS is activated it can interact with more than 20 different substrates, including members of the RAF family and PI3K (Schubbert S. et al., 2007). This interaction allows the three RAF kinases (ARAF, BRAF and RAF1) to phosphorylate MEK1 and consequently activate ERK1 and ERK2. ERK proteins can phosphorylate different effector molecules with induction of cell proliferation (Schubbert S. et al., 2007). PI3K instead catalyzes the transformation of the phosphorylation of phosphatidylinositol-4,5-bisphosphate (PIP2) and the subsequent production of phosphatidylinositol-3,4,5-trisfosfate (PIP3), a process inhibited by phosphatase homolog of the phosphatase and tensin (PTEN). The accumulation of PIP3 promotes the
recruitment of PDK1 at the membrane level, where it phosphorylates AKT, which in turn can phosphorylate a series of proteins that favor cell survival (Tatevossian R.G. et al., 2010).
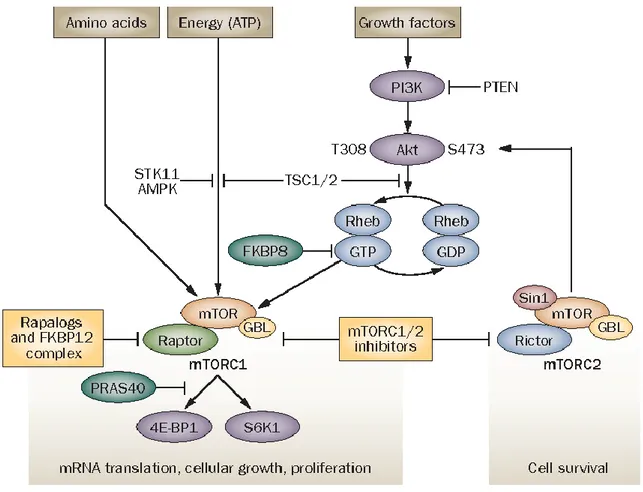
The MAPK/Erk signaling cascade is activated by a wide variety of receptors involved in growth and differentiation including receptor tyrosine kinases (RTKs), integrins, and ion channels. The specific components of the cascade vary greatly among different stimuli, but the architecture of the pathway usually includes a set of adaptors (Shc, GRB2, Crk, etc.) linking the receptor to a guanine nucleotide exchange factor (SOS, C3G, etc.) transducing the signal to small GTP-binding proteins (Ras, Rap1), which in turn activate the core unit of the cascade composed of a MAPKKK (Raf), a MAPKK (MEK1/2), and MAPK (Erk). An activated Erk dimer can regulate targets in the cytosol and also translocate to the nucleus where it phosphorylates a variety of transcription factors regulating gene expression (Schubbert S. et al., 2007). Activated RAS is also capable of interacting with members of the phosphatidylinositol 3-kinase (PI3K) family. In particular, PI3K catalyzes the accumulation of PIP3, which promotes the recruitment of PDK1 at the membrane level, where it phosphorylates AKT, which in turn can phosphorylate a series of proteins that favor cell survival (Tatevossian R.G. et al., 2010). One of the main mediators downstream of the PI3K/AKT pathway is the mammalian target of rapamycin (mTOR), in the form of 2 complexes: mTORC1 and mTORC2, as shown in Figure 3. Following its activation, the mTORC1 complex induces an increase in protein synthesis, stimulates cell growth and survival. The mTORC2 complex is less known, but appears to regulate metabolism, survival through AKT activation and cytoskeletal organization (Hütt-Cabezas M. et al., 2013).
Figure 3. Overview of the PI3K/AKT/mTOR signaling pathway. mTOR signaling pathways. mTOR forms
complexes with other proteins, including Raptor (forming mTORC1) or Rictor (forming mTORC2). ATP, amino acids and signals from the PI3K/Akt pathway modulate mTOR function. Activation of PI3K and Akt inhibits hamartin and tuberin repression of Rheb, which leads to mTORC1 activation and phosphorylation of S6K1 and 4E-BP1. Akt is pivotal in mTOR signaling, as it is both an upstream activator of mTORC1 and downstream effector of mTORC2. Negative regulators of mTOR include FKBP8, which prevents Rheb from activating mTORC1, and PRAS40, which competes with Raptor for binding to S6K1 and 4E-BP1. When intracellular ATP is depleted relative to AMP, AMPK and its upstream regulator STK11 phosphorylate tuberin, which inactivates Rheb and mTORC1 signaling. Hypoxia and low amino acid levels also negatively regulate mTOR. Rapalogs associate with FKBP12 and preferentially disrupt mTORC1 whereas small-molecule mTOR kinase inhibitors target both mTOR complexes. Abbreviations: AMPK, AMP-activated kinase; 4E-BP1, eIF4E-binding protein 1; FKBP12, FK506 binding protein 12; GBL, G protein beta subunit-like; mTORC, mammalian target of rapamycin complex; PI3K, phosphatidylinositol 3-kinase; PRAS40, proline-rich Akt1 substrate 1; PTEN, phosphatase and tensin homolog deleted on chromosome 10; S6K1, p70 S6 kinase 1; Sin1, stress activated protein kinase interaction protein 1; STK11, serine/threonine-protein kinase 11; TSC, tuberous sclerosis complex (Dancey J. 2010).
The BRAF V600E point mutation consists of the replacement of a thymine with adenine at nucleotide 1796, with consequent amino acid substitution in the codon 600 of a valine with glutamate (Nicolaides T.P. et al., 2011). This mutation occurs at the level of the kinase domain, at the activation loop (A loop) or at the loop to which ATP (P loop) binds,
causing a conformational change of the BRAF protein that becomes constitutively active. The highest frequency of the V600E mutation was found in PXAs (66%) and GGs (18%), while in PAs it represents 9% of cases (Schindler G. et al., 2011). As for the most common fusion of pLGGs, this occurs between BRAF and its centromeric gene, KIAA1549, following which transcription of different messengers is obtained after "alternative splicing". This in-frame fusion of KIAA1549-BRAF has been reported in 80% of sporadic PAs (Jones D.T. et al., 2009). Most of these KIAA1549-BRAF fusions occur between exon 16 of KIAA1549 and exon 9 of BRAF. However, there are at least six possible exon couplings for the KIAA1549-BRAF fusion (15: 9, 16:11, 16:10, 15:11, 17:10, 18:10) and in all the N-terminal of BRAF is replaced by that of KIAA1549. This results in a constitutive activation of the MAPK pathway, as the self-inhibiting N-terminal BRAF domain is lost while the C-terminal kinase domain is maintained (Jones D.T. et al., 2008; Jones D.T. et al., 2009). Other mutations, such as FGFR1 alterations, are mainly expressed only by specific pLGGs subtypes, such as DNET (Qaddoumi I. et al., 2016). Along with the abovementioned dysregulated MAPK/ERK signaling (Jacob K. et al., 2011; Raabe EH. et al., 2011; Selt F. et al., 2017), aberrant activation of the PI3K/AKT signaling pathway is also a well-documented feature of gliomas, which has also been described in pLGGs (Zhang J. et al., 2013; Mueller S. et al., 2012; Hütt-Cabezas M. et al., 2013). In some cases, its dysregulation has been linked to genetic, such as BRAF fusions, FGFR1 duplications and MYB rearrangements (Sturm D. et al., 2017), or epigenetic modifications, but in many cases the mechanism underlying PI3K/AKT pathway activation is still unknown.
2.2 MircoRNAs
2.2.1 MicroRNAs biogenesis
MicroRNAs (miRNAs) are short (20–23-nucleotide), endogenous, single-stranded RNA molecules that regulate gene expression at post-transcriptional level, by binding to sequences complementary to 3 'UTR (3' untranslated region) of the target mRNA (Winter J. et al., 2009). The microRNA processing pathway has long been viewed as linear and universal to all mammalian microRNAs. This canonical maturation includes the production of the primary microRNA transcript (pri-miRNA) by RNA polymerase II or III and cleavage of the pri-miRNA by the microprocessor complex Drosha–DGCR8 (Pasha)
in the nucleus. The resulting precursor hairpin, the pre-miRNA, is exported from the nucleus by Exportin-5–Ran-GTP. In the cytoplasm, the RNase Dicer in complex with the double-stranded RNA-binding protein TRBP cleaves the pre-miRNA hairpin to its mature length. The functional strand of the mature microRNA is loaded together with Argonaute (Ago2) proteins into the RNA-induced silencing complex (RISC), where it guides RISC to silence target mRNAs through mRNA cleavage, translational repression or deadenylation, whereas the passenger strand is degraded, Figure 4 (Lin S. et al., 2015).
Figure 4. MicroRNA (miRNA) genes are transcribed as primary miRNAs (pri-miRNAs) by RNA polymerase
II (Pol II) in the nucleus. The long pri-miRNAs are cleaved by Microprocessor, which includes DROSHA and DiGeorge syndrome critical region 8 (DGCR8), to produce the 60–70-nucleotide precursor miRNAs (pre-miRNAs). The pre-miRNAs are then exported from the nucleus to the cytoplasm by exportin 5 (XPO5) and further processed by DICER1, a ribonuclease III (RIII) enzyme that produces the mature miRNAs. One strand of the mature miRNA (the guide strand) is loaded into the miRNA-induced silencing complex (miRISC), which contains DICER1 and Argonaute (AGO) proteins, directs the miRISC to target mRNAs by sequence complementary binding and mediates gene suppression by targeted mRNA degradation and translational repression in processing bodies (P-bodies). TRBP, transactivation-responsive RNA-binding protein (Lin S. et al., 2015).
MicroRNAs and their targets constitute remarkably complex regulatory networks as a single microRNA can bind and regulate many different mRNAs and, conversely, different
microRNAs can cooperatively bind to and control a single target mRNA (Lewis et al, 2003).
2.2.1 MicroRNAs and cancer
Many cellular pathways are affected by the regulatory function of microRNAs; the most prominent of these pathways control developmental and oncogenic processes. The first evidence of the involvement of microRNAs in human cancer derived from studies on chronic lymphocitic leukemia (CLL), particularly in an attempt to identify tumour suppressors at chromosome 13q14, frequently deleted in CLL. Dr. Croce’s group reported that rather than along with containing a protein coding tumour suppressor gene, this critical region contains in fact two microRNA genes, miR-15a and miR-16-1, expressed in the same polycistronic RNA. This result provided the first evidence that microRNAs could be involved in the pathogenesis of human cancer as the deletion of chromosome 13q14 caused the loss of these two microRNAs (Calin G.A. et al, 2002). Later, many groups of researchers identified the role of different microRNAs in human neoplasms, for example the amplification of the miR-17-92 cluster, strongly stimulated by c-Myc in B-cell lymphomas and lung tumours, hinders the expression of tumour suppressors and therefore promotes cancer progression. During tumour development, microRNAs can be subject to "gain of function" mutations, when mutations cause an aberrant over-expression of microRNA, or "loss of function" if, on the other hand, the expression or normal function physiological microRNA fails. For this reason some microRNAs are identified as oncogenes or oncosuppressors, depending on how their expression varies in human neoplasms and their function in cellular processes linked to the gene targets they regulate (Iorio MV. et al., 2005). The aberrant biogenesis of microRNAs in cancer can occur at different stages:
• At the transcriptional level, through specific transcription factors;
• Genetic alterations, such as amplification or loss of heterozygosity (LOH) affecting gene loci of microRNAs;
• Epigenetic modifications, for example methylation of CpG islands in tumour suppressor promoter regions.
2.2.3 MicroRNAs in pLGGs
The first microarray analysis on the expression profile of microRNAs in pLGGs was performed by the Birks group in 2011 on frozen tumour tissue samples. This analysis had identified three microRNAs (miR-129, miR-142-5p and miR-25) differentially expressed in tumours compared to healthy controls (Birks D.K. et al., 2011). In 2013, Ho et al. analysed 43 PAs and from microarray analysis detected several downregulated microRNAs, including miR-124, miR-129, miR-138, miR-490, miR-7 and miR-873, and others upregulated, including 10b, 1260, 1274, 1288, 142, miR-143, miR-21, miR-92b, compared to controls (Ho C.Y. et al. 2013). Subsequently, Liu et al. analysed the expression pattern of microRNAs from eight astrocytoma samples, divided according to malignancy. Through microarray and qRT-PCR they reported several upregulated microRNAs, such as miR-21, miR-181, miR-1321, miR-1259, miR-24, miR-222; and downregulated, such as miR-128, miR-885, miR-99b, miR-204, miR-218, miR-26a. In addition to the analysis of microRNAs, they also proceeded to investigate possible gene targets and reported genes involved in the MAPK, Wnt/β-catenin and migration promoting receptor (EphB2) signaling pathway (Liu F. et al., 2013). Later, Eguía et al. evaluated microRNA expression levels in 57 PAs samples of Mexican children, which included tumours from I to IV grade of malignancy. MiR-124-3p and miR-128-1 were downregulated in all astrocytomas compared to healthy brain tissues and this reduction was much more evident in grade IV astrocytomas. Furthermore, miR-128-1 levels were higher in infratentorial tumours than in supratentorial cases and miR-221-3p expression was higher in tumours without relapses and surviving patients (Eguía A.P. et al. 2014). Jones et al. in 2015 focused on the differential expression of microRNAs in a cohort of 57 pLGGs samples. In PAs, compared to controls, they found a significant upregulation of miR-542-5p, miR-542-3p, miR-503, mir-450, miR-224, miR-146a and miR-34a. Target analysis of these upregulated microRNAs revealed regulators of the MAPK signaling pathway, such as KRAS, MEK1 or ERK1. MicroRNAs such as miR-21 and miR-146a presented instead gene targets belonging to NF-KB signaling (Jones T.A. et al., 2015). In 2016 Braoudaki et al. analysed the expression profile of microRNAs in a DNET cohort. 120 differentially expressed microRNAs were identified between these tumours and healthy brain tissue and two of these microRNAs (miR-1909 * and miR-3138) have been proposed as biomarkers capable of distinguishing DNETs from healthy subjects
(Braoudaki M. et al., 2016). More recently, Bongaarts et al. demonstrated the role of two microRNAs (miR-519d and miR-4758) in the regulation of the intracellular PI3K/AKT/p21 signaling pathway in low-grade pediatric brain tumours associated with epilepsy, which include GGs and DNETs, and proposed these two microRNAs as biomarkers able to distinguish GGs from DNETs (Bongaarts A. et al., 2018). The abovementioned studies highlight the fact that microRNAs in pLGGs play an important role in the regulation of a great variety of genes and, consequently, of multiple signaling pathways. This can be exploited in the early detection of diseases, in risk assessment and in innovative therapeutic strategies.
3. Aim of work
Pediatric low grade gliomas (pLGGs) are the most frequent brain tumours and with heterogeneous clinical and histological aspects. About 40% of patients with pLGGs can be surgically treated by complete resection of the tumour. For tumours that occur at the supratentorial level, however, total surgical resection is difficult to obtain and, following partial tumour resection, patients often experience disease recurrence as well as suffering from important co-morbidities due to the late effects of treatment. In the field of oncology, microRNAs have assumed considerable importance both for their function as regulators of gene expression, acting as oncogenes and/or onco-suppressors, and as biomarkers of disease.
Thus, aim of this project has been to analyse a series of pLGGs samples to determine their microRNA profile and subsequently to focalize the study on deregulated microRNAs in supratentorial pLGGs subgroup, which have the poorest clinical outcomes, to find molecular aspects of pathogenic interest.
4. Materials and methods
Unless otherwise stated, commercially available products were used according to the manufacturer’s instructions/protocols.
4.1 Tumour samples and controls
MicroRNA profiling was performed with quantitative PCR (qPCR) (as described below) on RNA extracted from snap-frozen tumour tissue samples from 45 patients (aged 1–16 years) with pLGGs. All underwent surgery at the Bambino Gesù Children’s Hospital in Rome or the Gaslini Institute in Genoa between 2014 and 2016. The clinical and pathological features of each case are summarized in Table 5. The study was approved by the ethical committees of the competent structures and the families of the patients signed the informed consent for participation in the study. RNA and DNA used for the analyses were extracted from tumour samples with pathologist-confirmed tumour cell contents of 80% or more. For control purposes, we profiled eight samples (three + a pool of five) of non-neoplastic brain tissue purchased from Ambion-Life Technology (Thermo Scientific, Wilmington, MA, USA) (n = 1: AM7962, Human Brain Total RNA) or Biochain Institute (Newark, CA, USA) (n = 7: R1234035-50, Total RNA-Human Adult Normal Tissue-Brain; R1234035-P, Total RNA-Human Adult Normal Tissue-5 Donor Pool-Tissue-Brain; R1234035-50, Total RNA-Human Adult Normal Tissue-Brain) and 28 samples (four + a pool of 24) of non-neoplastic brain cerebellum purchased from Biochain Institute (n = 4: R1234039-50, Total RNA-Human Brain cerebellum) or Clontech Laboratories (Takara Bio USA Inc., Shiga, Japan) (n = 1: 636535, Total RNA-Human Brain cerebellum-24 Donor Pool-Brain). MicroRNA profiles for the pLGGs were also compared with profiles previously reported by our group for 13 pHGGs, which had been collected between 2005 and 2010 from patients aged from 3 to 17 years (Miele E. et al., 2013). To ensure the comparability of these two cohorts, we reanalysed the microRNA profiles originally reported for the pHGGs using the same normalization procedure and statistical methods employed for comparing the pLGGs with healthy brain tissues, as reported below. For functional studies, we established short-term cultures of pLGG cells isolated from four primary tumours resected at Bambino Gesù Children’s Hospital (Rome) in 2016 (Table 6). We deliberately selected tumours with non-PA histology, since the biology of these
pLGGs has been much less thoroughly explored than that of PAs. We also limited our analysis to supratentorial pLGGs, which are associated with lower miR-139-5p levels, lower resectability rates and worse outcomes than their infratentorial counterparts (Mueller S. et al., 2012).
4.2 Patient-derived primary pLGG cell cultures
4.2.1 Culture and characterization
Human pLGG samples, were collected immediately after resection and placed in Hank’s Balanced Salt Solution (HBSS) supplemented with 0.5% glucose and penicillin-streptomycin. The tissues were triturated with a serological pipette. DNAse I was added (final concentration 0.04%) and left for 20 min. Cell aggregates were then mechanically disrupted with pipettes of decreasing bore size. The single-cell suspension thus obtained was then centrifuged, and the cells suspended in NHA complete medium (Lonza, Basel, CH), counted and plated at a density of 160,000/mL, Figure 5.
Figure 5. Protocol for Patient-derived primary pLGG cell cultures.
Prior to use in experiments, isolated primary pLGG cells underwent quality control assays to ensure they were reliable pLGG models. To this end, we verified that the BRAF status of each cell line was identical to that of the parent tumour (as described below in Analysis of BRAF status). For the three primary pLGG cells whose primary tumour did not show any genetic alteration on the BRAF gene, we compared methylation profiles to verify similarity between the primary cell line and the parental tumour. Immunofluorescence staining (described below) was used to confirm that the cells’ histotype-specific glial/neuronal cell biomarker profile was consistent with those described in the literature (Louis D.N. et al., 2007, Luyken C. et al., 2004). The percentage of senescent cells was also evaluated by staining for Senescence-associated
b-galactosidase (SA-b-gal, described below). Cultures with SA-b-gal-positivity rates of 60% or more were excluded from experimentation. During the study, cells were discarded after a maximum of eight passages (about 30 days of culture) or when SA-b-gal-positivity rates reached 60%.
4.3 Histology
Formalin-fixed paraffin-embedded (FFPE) samples of each of the 45 pLGGs used in the study were sectioned (3m) and stained with haematoxylin and eosin for histology. All tumour diagnoses were then confirmed by consensus decision of three neuropathologists (F.G., M.A. and F.D.C.) using the WHO classification criteria (Louis D.N. et al., 2016).
4.4 RNA extraction of pLGG tissues and cells
Trizol Reagent (Invitrogen, Thermo Scientific, CA, USA) was used to isolate total RNA from fresh-frozen pLGG tissue samples and patient-derived pLGG cell lines. To increase the RNA yield of the tissue samples, we added 250 μg glycogen (Invitrogen, Thermo Scientific, CA, USA) for each milliliter of Trizol. Total RNA quantity and quality were evaluated with a Nanodrop ND-100 spectrophotometer (Thermo Scientific). For each sample, we reverse-transcribed total RNA (500 ng to 1μg) using a high-capacity cDNA reverse transcription kit (Applied Biosystems,Thermo Scientific).
4.5 Analysis of BRAF status
Each of the 45 pLGGs and the three patient-derived pLGG cell lines were analysed for the two most common genetic alterations found in these tumours – namely, the BRAF V600E point mutation (V600E) and the KIAA1549:BRAF fusion gene [including the three most frequent variants: KIAA1549-BRAF exon 16-exon 9 (K16B9), KIAA1549-BRAF exon 16-exon 11 (K16B11), and KIAA1549-BRAF exon 15-exon 9 (K15B9)].
BRAF fusion analysis. BRAF fusion analysis was performed on tumour cDNAs with the Applied Biosystems Viia7 real-time qPCR (RT-qPCR) System, as described by Tian et al. (Tian Y. et al., 2011) and validated by PCR based Sanger sequencing through amplification with specific pairs of primers flanking the fusion point between the KIAA1549 (in exon 15 or 16) and BRAF (in exon 9 or 11) genes, as described by Jones et al. (Jones D.T. et al., 2008). The purified PCR products were sequenced on an ABI 3130
XL DNA analyser (Applied Biosystems) using the BigDye Terminator v1.1 cycle sequencing kit (Applied Biosystems) and the forward or reverse primer used to perform the PCR. The primer sequences were as follows: KIAA1549 exon 15: 5’-CGG AAA CAC CAG GTC AAC GG-3’; KIAA1549 exon 16: 5’-AAA CAG CAC CCC TTC CCA GG-3’; BRAF exon 9: 5’-CTC CAT CAC CAC GAA ATC CTT G-3’; BRAF exon 11: 5’-GTT CCA AAT GAT CCA GAT CCA TTC-3’.
BRAF V600E mutation. DNA was extracted from fresh frozen samples and patient-derived pLGG cell lines using the QIamp DNA mini kit (Qiagen Inc., Valencia, CA, USA). Quantity and quality were evaluated with a Nanodrop ND-1000 spectrophotometer (Thermo Scientific). RT-qPCR was performed, as described by Diniz et al. (Diniz M.G. et al., 2015), using TaqMan probes (Life Technologies, Waltham, MA, USA): BRAF_476_mu, which detects T>A transversion at position c.1799, and the reference-gene probe BRAF_rf. Threshold cycle (Ct) values were analysed using Mutation DetectorTM Software (Life Technologies). Genomic DNA extracted from BRAF V600E and BRAF wild-type colon cancer cell lines, kindly provided by Prof. Matilde Todaro (University of Palermo), were used as positive and negative controls, respectively.
Table 5. Clinical-pathological features of the 45 pLGG cases subjected to microRNA expression profiling. Sample Age at diagnosis (y) Sex Histology WHO
grade Location BRAF alterationsa P5 3 M AG II Supra WT P38b 12.3 M AG I Supra WT P3b 9 F DNET I Supra WT P11 10 F DNET I Supra WT P16b 5.8 M DNET I Supra WT P32 8.4 F DNET I Supra WT P8 7.6 F GG I Supra WT P18b 14.7 F GG I Supra V600E
P19 4.5 M GG I Infra V600E P22 8 F GG I Infra K16B9 P26 7 F GG I Supra WT P29 11.3 M GG I Infra WT P36 5.5 M GG I Infra K15B9 P41 1.6 M GG I BS WT P33 9.1 F GNT I Infra K15B9 P1 15 F PA I Infra WT P2 1 F PA I Infra K16B9 P4 12 M PA I Infra WT P6 9 M PA I Supra K16B9 P7 6.1 F PA I Infra K16B9 P9 1.9 F PA I Infra K15B9 P10 16.2 M PA I Infra WT P12 3.8 M PA I Infra K16B9 P13 5.7 M PA I Infra WT P14 1.3 F PA I Infra WT P15 10 F PA I Infra WT P17 12 M PA I Infra WT P20 4.4 F PA I Infra K16B9 P21 10 M PA I Supra WT P23 11 F PA I Infra WT P24 3 M PA I Supra K16B9 P25 9.4 F PA I BS K16B9 P27 10 M PA I Infra K16B9 P28 7 F PA I BS WT P30 6.8 F PA I Supra K16B11 P31 10.2 M PA I Infra K16B9
P34 5 M PA I Supra WT P35 7.5 M PA I Infra K16B9 P37 3.2 M PA I Supra K15B9 P39 6.6 M PA I Supra WT P40 1.4 M PA I Infra K16B9 P42 3.3 M PA I Infra WT P43 1.8 F PA I Infra WT P44 3.6 M PA I Supra K15B9 P45 3.1 M PA I Infra V600E
Abbreviations: AG, angiocentric glioma; BS, brain stem; DNET, disembryoplastic neuroepithelial tumour;
GG, ganglioglioma; GNT, glioneruonal tumour; Infra, infratentorial; PA, pilocytic astrocytoma; pLGG, pediatric low-grade glioma; Supra, supratentorial; WT, Wild Type for BRAF screening.
a BRAF screening was limited to the V600E point mutation and three gene fusions (KIAA1549-BRAF exon
16-exon 9 [K16B9], KIAA1549-BRAF exon 16-exon 11 [K16B11], KIAA1549-BRAF exon 15-exon 9 [K15B9]).
b Primary pLGG cell lines were derived from these tumours (see Table 6)
Table 6. Clinical-pathological features of patient-derived primary pLGG cell lines.
Sample Parental Tumour
Age at
diagnosis Sex Histology Location
BRAF alterationsa Tumour tissue Isolated cells pLGG1 P38 12.3 M AG Supra WT WT pLGG2 P3 9 F DNET Supra WT WT pLGG3 P16 5.8 M DNET Supra WT WT
pLGG4 P18 14.7 F GG Supra V600E V600E
Abbreviations: AG, angiocentric glioma; DNET, disembryoplastic neuroepithelial tumour; GG,
ganglioglioma; NS, not screened; pLGG, pediatric low-grade glioma; Supra, supratentorial; WT, Wild Type for BRAF screening.
a BRAF screening was limited to the V600E point mutation and three gene fusions (KIAA1549-BRAF exon
4.6 MicroRNA profiling and data analysis
MicroRNA expression profiling was performed on the pLGG tumours using RT-qPCR with Taqman Low Density Array (TLDA) microfluidic cards (Human miR v3.0, Applied Biosystems), which detect the 754 best characterized members of the human microRNA genome. Each reverse transcriptase reaction was performed with specific primers according to Applied Biosystems protocols. The same method had been used to profile the pHGGs in (Miele E. et al., 2013). Statistical analysis was performed with StatMinerTM software, v. 5.0 (Integromics TM, Granada, Spain). MicroRNA expression levels were normalized by using the global expression normalization method and the comparative threshold cycle method was used to calculate the relative microRNA expression. MicroRNAs with Ct values > 33 were excluded. Differential expression between groups was assessed with the Limma test, and p values < 0.05 were considered to be statistically significant. A single-assay qPCR for assessment of miR-139-5p expression (Code:002289) was carried out in triplicate using the TaqMan Individual microRNA assays (Applied Biosystems), as previously described (Miele E. et al., 2013). Information regarding microRNA clusters was obtained from miRBase v.21 (http://www.mirbase.org/) (Griffiths-Jones S. et al., 2007)
Validated targets of hsa-miR-139-5p were identified by interrogation of the miRTarBase (http://mirtarbase.mbc.nctu.edu.tw/; (Chou C-H. et al., 2015)) and literature reports (Dai S. et al., 2015; Yue S. et al., 2015).
4.6.1 MicroRNAs clustering analysis
Dendrograms and heat maps were generated with the use of R (http://www.r-project.org/) using differentially expressed microRNAs as input. The Bray-Curtis method and the average linkage were used in hclust to cluster the samples and heatmap.2 to generate the heat maps (Suzuki R. et al.,2006).
4.6.2 DIANA mirPath analysis
The microRNAs that were differentially expressed in pLGGs (vs. non-neoplastic brain tissue controls) were loaded into the DIANA mirPath tool (http://snf-515788.vm.okeanos.grnet.gr/) Vlachos IS. Et al., 2015) for microRNA pathway analysis. MicroRNAs that were significantly dysregulated in the tumours were then analysed to identify their putative targets.
4.7 Cell treatments
Synthetic miR-139-5p (miRIDIAN microRNA code: C-310568-07; Dharmacon, Cornaredo, Milan, Italy) or negative control (miRIDIAN microRNA negative control code: CN-001000-01; Dharmacon) were transfected into pLGG primary cells at 20 nM using HiPerFect transfection reagent (Qiagen Inc.) for 48h. miR-139-5p overexpression was confirmed by single assay qRT-PCR. For pharmacological inhibition of PI3K, LY294002 was purchased from Sellekchem, dissolved in DMSO, and stored until used in aliquots at -80°C as 50 mM stock solutions. LY294002 and controls (CTRL) (0.1% DMSO) were diluted in culture medium just before use. After 30 min of treatment with 50 M LY294002, cells were shifted in normal culture medium for a recovery period of 48h. Cell growth was evaluated after 48h by trypan blue exclusion assay. Specifically, the number of cells that did not take up trypan blue (viable cells) was counted both after transfection of synthetic miR-139-5p or negative control. The number of cells that took up trypan blue (nonviable cells) was counted. Each sample was measured in triplicate and repeated at least three times.
4.8 DNA methylation array data generation
DNA methylation profiling using the Illumina Infinium HumanMethylation EPIC BeadChip array was performed according to the manufacturer’s instructions in collaboration with the Genetics and Rare Diseases Research Division, Bambino Gesù Children’s Hospital, Rome, Italy. In detail 250 ng of DNA was used as input material for fresh frozen tissue and primary cell line samples (after about 15 days of culture). t-Distributed stochastic neighbor embedding (TSNE) analysis was conducted as previously described (Sturm D. et al., 2016). Basic array processing and clustering analysis were performed using Illumina GenomeStudio V2011.1 (Methylation Module version 1.9.0,
content descriptor version 1.2)
(https://www.illumina.com/techniques/microarrays/array-data-analysisexperimental-design/genomestudio.html) (Illumina, Inc., San Diego, CA, USA). Signal intensities were obtained without background subtraction and normalized to internal controls. Beta-values were used for downstream methylation analyses.
4.9 Immunofluorescence studies
Immunofluorescence studies were performed according to standard procedures, as reported elsewhere (Ronci M. et al., 2015). Primary pLGG cells were plated on glass coverslips and fixed with 4% paraformaldehyde (PFA) for 10 min at room temperature (RT). Fixed cultures were permeabilized and blocked for 30 min with 5% donkey serum (DS) and 0.1% Triton X-100 (Sigma-Aldrich, St. Louis, MO) in phosphate buffered saline (PBS). Cells were then incubated overnight with the following primary antibodies: glial fibrillary acidic protein (GFAP, 1:200, Cell Signaling Technology, Danvers, MA), anti-vimentin (1:100, Abcam, Cambridge, UK), anti-S100 (1:100, Sigma-Aldrich, St. Louis, MO), anti-NeuN (1:100, Merck Millipore, Darmstadt, GE), anti-synaptophysin (1:100, Merck Millipore, Darmstadt, GE) diluted in PBS with 5% DS. Secondary antibodies conjugated with Alexa Fluor 488 or 594 (Thermo Fisher Scientific, MA, USA) were diluted 1:400 and 1:200, respectively, in PBS with 5% DS and incubated with the specimens for 1h at RT. Nuclei were counterstained with Hoechst reagent. After washing, slides were mounted using anti-fade reagent (Prolong Gold, Thermo Fisher Scientific, MA, USA). Images were acquired using a FV1200 MPE laser scanning confocal microscope (Olympus) with a UPlanSAPO 40x/0.95 NA objective. Imaris 8.1 software (Bitplane, Zürich, CH) was used for image-processing. For image analysis, 200 cells resulted from five fields from three independent experiments were examined and the percentage of positive cells for each marker was evaluated by dividing the number of positive cells on the total number of cells in each field.
4.10 Senescence-Associated-β-galactosidase activity
SA-β-gal activity was assessed as described in Debacq-Chainiaux (Debacq-Chainiaux F. et al., 2009) with minor modifications. Briefly, cells were fixed with 3.6% of formaldehyde in PBS for 4 min at RT. Fixed cells were washed and incubated overnight with freshly prepared staining solution at 37°C in the absence of CO2. The cells were washed, and coverslips were mounted in antifade medium (Dako Fluorescence mounting medium, Agilent Technologies, Santa Clara, CA). Images were acquired using a Leica DM2500 microscope (Leica Microsystems, Wetzlar, Germany) with a 20x/0.40 NA objective. Pictures were taken using the ISCapture software and processed with Adobe Photoshop (Mountain View, CA) to adjust brightness and contrast. The percentage of positive cells
was evaluated by dividing the number of blue cells on the total number of cells in the field (Jacob K. et al., 2011).
4.11 Western Blotting
Western blotting analysis was performed according to standard procedures, as reported elsewhere (Po A. et al., 2017). Blots were incubated with primary antibodies: rabbit anti-phospho-Akt (Ser473), rabbit anti-Akt, rabbit anti-phospho-p70 S6 kinase (Thr389), rabbit p70 S6 kinase (Cell Signaling Technology, Danvers, MA), and mouse anti-GAPDH (Abcam, Cambridge, UK). HRP-conjugated secondary antisera (Santa Cruz, Biotechnology) were added, and binding was visualized by enhanced chemiluminescence (Perkin Elmer, MA, USA). Images were acquired with the BioRad ChemiDoc MP Imaging System (BioRad, Hercules, CA). BioRad associated Image Lab Software was used to perform densitometric analysis. Values are expressed as fold changes relative to GAPDH, used as internal control.
4.12 Statistical Analysis
Data reported in this paper are the means ± SD of at least three independent experiments each performed in triplicate. Unpaired t-test and Paired t-test were performed wherever appropriate using GraphPad Prism Software version 6.0 (La Jolla, CA, USA), P values < 0.05 were considered to be statistically significant.
5. Results
5.1 Genetic alterations of the pLGG cohort
The evaluation of the BRAF V600E point mutation (V600E) and the KIAA1549:BRAF fusion gene in tumour samples and in cells showed KIAA1549:BRAF fusion genes common, in accordance to literature (Zhang J. et al., 2013). Specifically, the K16B9 variant – the one most frequently encountered – was present in 18 (27%) pLGGs, most of which (13, 52%) were infratentorial. BRAF fusions were less common in the supratentorial tumours [5/18 (29%)]. Three pLGGs harboured the BRAF V600E point mutation (two infratentorial and one supratentorial).
These results together with other clinical and pathological features of the 45 primary pLGGs analysed are summarized in Table 5. Thirty (67%) of the tumours were PAs, eight (18%) were gangliogliomas (GGs), four (9%) were DNETs, two (4%) were AGs and one (2%) was a glioneuronal tumour. Patients’ age at diagnosis ranged from 1 to 16 years (median 7 years; mean 7.1 years). Three were located in the brain stem (two PAs, one GG). The other 42 included comparable numbers of infratentorial (n = 25) and supratentorial (n = 17) tumours.
5.2 MicroRNA profiles of pLGGs
We measured the expression levels of 754 microRNAs in the 45 pLGGs described above and compared them with non-neoplastic brain (CTRL). The results were also compared with profiles previously reported by our group for 13 pHGGs (glioblastoma multiforme, n = 8; anaplastic astrocytoma, n = 5) (Miele E. et al., 2013). The TLDA analysis reported similar high detection rates in all the three tissue groups [474 (63%) of the 754 microRNAs were identified in pLGGs, 436 (58%) in pHGGs and 368 (49%) in CTRL]. The differentially expressed microRNAs (Tables 7 and 8) were plotted using hierarchical clustering, as reported in Figure 6.
Table 7. MicroRNAs displaying significantly upregulated expression in pLGG tissues relative to non-neoplastic brain (CTRL). Abbreviations: LFC, Linear Fold Change; Chr, Chromosome
hsa-miR-193a-3p 34.32 6.84E-03 hsa-miR-378 30.16 1.26E-02 hsa-miR-1275 19.21 5.39E-04 hsa-miR-18a-5p 14.20 2.36E-05 17~92 13 hsa-miR-576-3p 13.90 2.22E-02 hsa-miR-483-5p 10.28 3.13E-03 hsa-miR-720 8.65 1.32E-04
hsa-miR-550a-3p 8.61 9.25E-04 550a~550b 7
hsa-miR-636 8.15 4.08E-02 hsa-miR-296-5p 7.08 3.38E-05 298~296 20 hsa-miR-337-5p 7.00 2.17E-02 493~136 14 hsa-miR-21-5p 6.83 3.09E-03 hsa-miR-455-5p 5.14 1.14E-03 hsa-miR-301a-3p 5.01 2.78E-05 hsa-miR-661 5.00 1.85E-02 hsa-miR-9-3p 4.80 2.92E-04 hsa-miR-497-5p 4.66 9.14E-06 497~195 17 hsa-miR-1260a 4.17 1.23E-02 hsa-miR-34a-3p 3.86 3.35E-03 hsa-miR-571 3.75 4.75E-02 hsa-miR-142-3p 3.61 8.50E-03 4736~142 17 hsa-miR-320b 3.60 4.56E-02
hsa-miR-27a-3p 3.42 5.49E-04 23a~24-2 19
hsa-miR-99a-3p 3.19 1.53E-02 99a~let-7c 21
hsa-miR-34a-5p 2.97 9.34E-03
hsa-miR-181c-5p 2.93 2.42E-02 181c~181d 19
hsa-miR-193a-5p 2.52 0.02
hsa-miR-362-5p 2.36 9.19E-03 532~502 X
hsa-miR-374a-5p 2.31 1.31E-02 374a~545 X
hsa-miR-20a-5p 2.09 2.12E-02 17~92 13
hsa-miR-195-5p 2.04 3.86E-02 497~195 17
hsa-miR-20b-5p 1.94 3.38E-02 106a~363 X
hsa-miR-106b-5p 1.75 3.63E-02 106b~25 7
Table 8. MicroRNAs displaying significantly downregulated expression in pLGG tissues relative to non-neoplastic brain (CTRL). Abbreviations: LFC, Linear Fold Change; Chr, Chromosome
microRNA LFC P-value Part of cluster Chr
hsa-miR-129-1-3p 0.01 3.65E-03
hsa-miR-485-5p 0.01 1.13E-02 379~656 14
hsa-miR-129-2-3p 0.01 1.27E-02
hsa-miR-147b 0.01 2.05E-02
hsa-miR-523-3p 0.03 4.69E-02 512-1~519a-2 19
hsa-miR-187-3p 0.04 3.82E-02
hsa-miR-203a 0.04 7.74E-03 203a~203b 14
hsa-miR-522-3p 0.04 1.94E-02 512-1~519a-2 19
hsa-miR-582-5p 0.04 3.39E-02
hsa-miR-153-3p 0.04 3.47E-02
hsa-miR-184 0.05 2.04E-02
hsa-miR-770-5p 0.05 5.82E-03
hsa-miR-139-5p 0.06 3.27E-04
hsa-miR-133a-3p 0.06 3.12E-03
hsa-miR-139-3p 0.06 6.83E-03
hsa-miR-577 0.06 5.82E-03
hsa-miR-517a-3p 0.06 2.17E-02 512-1~519a-2 19
hsa-miR-889-3p 0.06 1.16E-02 379~656 14 hsa-miR-584-5p 0.07 3.11E-02 hsa-miR-425-3p 0.08 1.38E-02 191~425 3 hsa-miR-383-5p 0.08 4.15E-02 hsa-miR-124-3p 0.08 1.15E-02 hsa-miR-423-5p 0.09 3.16E-02 423~3184 17 hsa-miR-128-3p 0.10 1.53E-03 hsa-miR-149-5p 0.11 8.06E-04 hsa-miR-7-1-3p 0.11 5.30E-03 hsa-miR-433-3p 0.12 0.02 493~136 14 hsa-miR-885-5p 0.14 3.23E-03 hsa-miR-539-5p 0.14 4.44E-04 379~656 14 hsa-miR-487b-3p 0.14 7.05E-04 379~656 14 hsa-miR-218-5p 0.14 6.46E-03 hsa-miR-874-3p 0.15 4.28E-02 hsa-miR-628-3p 0.16 1.74E-02 hsa-miR-628-5p 0.16 3.63E-03 hsa-miR-495-3p 0.17 2.18E-02 379~656 14 hsa-miR-31-5p 0.18 4.70E-02
hsa-miR-323a-3p 0.18 8.69E-04 379~656 14 hsa-miR-132-3p 0.18 2.99E-04 212~132 17 hsa-miR-138-5p 0.19 1.10E-02 hsa-miR-330-3p 0.19 4.79E-05 hsa-miR-95-3p 0.20 2.72E-03 hsa-miR-491-5p 0.23 4.00E-05 hsa-miR-410-3p 0.23 1.18E-03 379~656 14 hsa-miR-625-5p 0.24 1.25E-02 hsa-miR-342-3p 0.26 5.29E-04 342~151b 14 hsa-miR-200c-3p 0.26 0.05 200c~141 12 hsa-miR-221-3p 0.28 4.44E-02 222~221 X hsa-miR-625-3p 0.35 0.05 hsa-miR-191-5p 0.38 4.25E-03 191~425 3 hsa-miR-126-3p 0.39 0.01 hsa-miR-411-5p 0.39 1.36E-02 379~656 14 hsa-miR-655-3p 0.41 4.46E-02 379~656 14
hsa-miR-103a-3p 0.42 4.69E-03 103a~103b 20
hsa-miR-145-5p 0.43 3.25E-02 143~145 5
hsa-miR-339-3p 0.43 1.85E-02
hsa-miR-125a-5p 0.43 1.01E-02 99b~125a 19
hsa-miR-324-5p 0.47 3.05E-02
Figure 6. Hierarchical clustering of microRNAs displaying differential expression in pediatric low-grade
gliomas (pLGGs) vs. nonneoplastic brain tissues (controls, CTRL). Hierarchical clustering of the 93 microRNAs differentially expressed in pLGGs vs. CTRL (grey) (P < 0.05) was performed and the Euclidean method was used to generate clusters on the basis of delta Ct values. Tissue: PA, pilocytic astrocytoma (blue); GG, ganglioglioma (red); GNT, glioneuronal tumour (purple); DNET, dysembryoplastic neuroepithelial tumour (orange); AG, angiocentric glioma (light blue). BRAF status was defined exclusively by the presence/absence of the V600E point mutation (green) and KIAA1549-BRAF fusion variants (yellow) (KIAA1549-BRAF exon 16-exon 9, KIAA1549-BRAF exon 16-exon 11, or KIAA1549-BRAF exon 15-exon 9). NEG, negative for all analysed mutations (black).
Some of the most striking alterations involved upregulation of microRNAs with documented oncogenic effects in many tumours (e.g. 21 and members of the miR-17-92 cluster) (Miele E. et al., 2013; Ho C-Y. et al., 2012;) down-regulation of microRNAs with reported oncosuppressive effects in various settings. The latter included miR-218 (Liu F. et al., 2013), miR-124 (Ho C-Y. et al., 2012), miR-487b (Ames HM. et al., 2017) and
Location
Tissue BRAF status Location
miR-139-5p (Bao W. et al., 2011; Guo H. 2012; Wong C.C.L. et al., 2011; Mao R. et al., 2015; Qiu G. et al., 2015).
We further evaluated the microRNAs profiles of supratentorial and infratentorial tumours with respect to non-neoplastic brain or normal cerebellum as CTRL, respectively. Among supratentorial tumours, 69 micro-RNAs displayed significant tumour-related upregulation (n = 28) or down-regulation (n = 41) (P < 0.05) (Tables 9 and 10).
Table 9. MicroRNAs displaying significantly upregulated expression in supratentorial pLGGs with respect to non-neoplastic brain tissues (CTRL). Abbreviations: LFC, Linear Fold Change; Chr, Chromosome
microRNA LFC P-value Part of cluster Chr
hsa-miR-663b 46.20 3.99E-03 hsa-miR-193a-3p 45.40 4.06E-02 hsa-miR-378 31.89 1.60E-02 hsa-miR-576-3p 17.65 2.46E-02 hsa-miR-1275 17.02 2.57E-02 hsa-miR-1225-3p 15.70 1.84E-02 hsa-miR-337-5p 11.84 4.34E-02 493~136 chr14
hsa-miR-550a-3p 11.32 2.16E-03 550a~550b chr7
hsa-miR-483-5p 10.93 1.05E-02
hsa-miR-18a-5p 10.34 1.20E-02 17~92a-1 chr13
hsa-miR-720 9.61 3.38E-04
hsa-miR-1233-3p 9.47 2.63E-02
hsa-miR-106b-3p 6.43 3.29E-03 106b~25 chr7
hsa-miR-296-5p 6.05 4.68E-03 298~296 chr20
hsa-miR-29a-5p 5.96 4.09E-02 29b-1~29a chr7
hsa-miR-9-3p 5.53 9.78E-04
hsa-miR-1260a 5.21 5.65E-04
hsa-miR-301a-3p 5.15 8.52E-04
hsa-miR-497-5p 4.69 9.94E-05 497~195 chr17
hsa-miR-99a-3p 3.88 3.27E-03 99a~let-7c chr21
hsa-miR-455-5p 3.85 2.14E-02
hsa-miR-34a-3p 3.42 2.33E-02
hsa-miR-27a-3p 2.97 1.98E-02 23a~24-2 chr19
hsa-miR-19a-3p 2.81 0.042344329 17~92a-1 chr13
hsa-miR-362-5p 2.34 3.19E-02 532~502 chrX
hsa-miR-193a-5p 2.32 4.57E-02
hsa-miR-181a-2-3p 2.14 3.68E-02 181a-2~181b-2 chr9
Table 10. MicroRNAs displaying significantly downregulated expression in supratentorial pLGGs with respect to non-neoplastic brain tissues (CTRL). Abbreviations: LFC, Linear Fold Change; Chr, Chromosome
microRNA LFC P-value Part of cluster Chr
hsa-miR-147b 0.006 7.85E-03
hsa-miR-512-3p 0.007 1.93E-02 512-1~519a-2 chr19
hsa-miR-657 0.009 4.90E-02 1250~657 chr17
hsa-miR-523-3p 0.016 4.90E-02 512-1~519a-2 chr19
hsa-miR-485-5p 0.017 2.82E-03 379~656 chr14
hsa-miR-138-2-3p 0.017 8.82E-03
hsa-miR-187-3p 0.024 2.58E-02
hsa-miR-522-3p 0.044 3.44E-02 512-1~519a-2 chr19
hsa-miR-423-5p 0.048 3.08E-03 423~3184 chr17
hsa-miR-577 0.083 2.72E-02
hsa-miR-889-3p 0.100 4.60E-02 379~656 chr14
hsa-miR-184 0.108 3.24E-02
hsa-miR-128-3p 0.114 2.69E-02
hsa-miR-133a-3p 0.144 9.51E-03 1-2~133a-1 chr18
hsa-miR-139-5p 0.147 3.68E-02
hsa-miR-203a 0.153 2.05E-02 203a~203b chr14
hsa-miR-31-5p 0.156 3.28E-02 hsa-miR-23b-3p 0.168 4.04E-02 23b~24-1 chr9 hsa-miR-654-5p 0.172 2.18E-02 hsa-miR-495-3p 0.184 1.07E-02 379~656 chr14 hsa-miR-539-5p 0.198 5.34E-03 379~656 chr14 hsa-miR-149-5p 0.200 3.98E-02 hsa-miR-138-5p 0.205 2.60E-02 hsa-miR-7-1-3p 0.215 3.27E-02 hsa-miR-487b-3p 0.215 1.56E-02 379~656 chr14 hsa-miR-625-5p 0.226 3.35E-02 hsa-miR-132-3p 0.252 1.18E-02 212~132 chr17 hsa-miR-330-3p 0.266 0.011063144 hsa-miR-628-5p 0.270 8.66E-03 hsa-miR-323a-3p 0.270 3.29E-02 379~656 chr14 hsa-miR-410-3p 0.276 2.29E-02 379~656 chr14 hsa-miR-491-5p 0.277 7.67E-03 hsa-miR-95-3p 0.332 3.67E-02
hsa-miR-379-5p 0.345 1.59E-02 379~656 chr14 hsa-miR-342-3p 0.350 2.66E-02 342~151b chr14 hsa-miR-200c-3p 0.362 3.55E-02 200c-141 chr12 hsa-miR-411-5p 0.412 0.024012639 379~656 chr14 hsa-miR-126-3p 0.418 3.91E-02 hsa-miR-103a-3p 0.450 3.53E-02 hsa-miR-191-5p 0.493 3.44E-02 191~425 chr3
Whereas in the analysis between infratentorial tumours and normal cerebellum 109 microRNAs displayed significant tumour-related up (n = 52) or down- regulation (n = 57) (P < 0.05) (Tables 11 and 12).
Table 11. MicroRNAs displaying significantly upregulated expression in infratentorial pLGGs with respect to normal cerebellum (CTRL). Abbreviations: LFC, Linear Fold Change; Chr, Chromosome
microRNA LFC P-value Part of cluster Chr
hsa-miR-875-5p 321.75 2.96E-02 875~599 chr8
hsa-miR-22-5p 123.85 8.14E-03
hsa-miR-21-5p 112.16 5.83E-06
hsa-miR-618 37.94 5.17E-03
hsa-miR-24-2-5p 36.68 1.57E-03 23a~24-2 chr19
hsa-miR-34a-3p 32.05 5.74E-06
hsa-miR-374b-5p 29.17 4.63E-03 374c~421 chrX
hsa-miR-335-5p 28.26 2.04E-04
hsa-miR-137 25.38 2.73E-02 137~2682 chr1
hsa-miR-451a 23.21 2.99E-03 4732~451a chr17
hsa-miR-18a-5p 19.80 3.89E-06 17~92a-1 chr13
hsa-miR-18b-5p 18.93 2.91E-02 17~92a-1 chr13
hsa-miR-221-3p 16.66 1.67E-03 222-221 chrX
hsa-miR-1183 14.26 3.87E-02
hsa-miR-708-5p 13.78 7.78E-08
hsa-miR-9-3p 11.04 2.96E-04
hsa-miR-19b-3p 9.88 2.09E-03
hsa-miR-144-5p 9.24 4.81E-02 4732~451a chr17
hsa-miR-650 9.01 7.92E-03 hsa-miR-488-3p 8.57 5.12E-03 hsa-miR-592 7.99 1.95E-02 hsa-miR-223-3p 7.72 2.73E-04 hsa-miR-193a-3p 7.32 4.56E-02 hsa-miR-942-5p 7.29 2.36E-02 hsa-miR-886-5p 5.99 3.41E-02 hsa-miR-146b-5p 5.51 9.65E-03 hsa-miR-720 5.35 1.18E-02
hsa-miR-27a-3p 5.26 7.91E-05 23a~24-2 chr19
hsa-miR-638 5.19 1.55E-02 hsa-miR-335-3p 5.01 2.67E-02 hsa-miR-146a-5p 4.80 8.42E-03 hsa-miR-140-5p 4.65 1.09E-02 hsa-miR-199b-3p 4.54 3.08E-02 3154~199b chr9 hsa-miR-886-3p 4.51 2.07E-02 hsa-miR-301a-3p 4.51 1.08E-02
hsa-miR-1274A 4.42 1.60E-02
hsa-miR-30d-3p 4.35 3.95E-02 30b~30d chr8
hsa-miR-222-3p 4.28 4.31E-02 222-221 chrX
hsa-miR-16-5p 3.84 4.01E-03
hsa-miR-374a-5p 3.75 3.27E-02 374a~545 chrX
hsa-miR-126-5p 3.27 2.57E-02
hsa-miR-106b-5p 3.27 7.43E-03 106b~25 chr7
hsa-miR-34a-5p 3.14 1.71E-02
hsa-miR-106a-5p 3.13 1.55E-03 106a~363 chrX
hsa-miR-20b-5p 3.07 9.59E-03 106a~363 chrX
hsa-miR-17-5p 3.00 1.89E-03 17~92a-1 chr13
hsa-miR-28-5p 2.95 9.09E-03
hsa-miR-9-5p 2.89 4.81E-02
hsa-miR-100-5p 2.80 0.023391658 100~let7a-2 chr11
hsa-miR-152-3p 2.56 0.047124119
hsa-miR-20a-5p 2.44 2.45E-02 17~92a-1 chr13
Table 12. MicroRNAs displaying significantly downregulated expression in infratentorial pLGGs with respect to normal cerebellum (CTRL). Abbreviations: LFC, Linear Fold Change; Chr, Chromosome
microRNA LFC P-value Part of cluster Chr
hsa-miR-129-2-3p 0.001 1.55E-04
hsa-miR-302a-5p 0.002 1.27E-02 302b~367 chr4
hsa-miR-206 0.009 4.93E-03 206~133b chr6
hsa-miR-124-3p 0.012 1.87E-04
hsa-miR-522-3p 0.015 1.13E-02 512-1~519a-2 chr19
hsa-miR-383-5p 0.021 1.17E-02
hsa-miR-1296-5p 0.022 9.70E-04
hsa-miR-519e-3p 0.024 2.11E-02 512-1~519a-2 chr19
hsa-miR-411-3p 0.032 1.27E-02 379~656 chr14
hsa-miR-874-3p 0.033 1.12E-03
hsa-miR-326 0.035 3.69E-02
hsa-miR-642a-5p 0.045 3.62E-02 642a~742b chr19
hsa-miR-589-5p 0.060 4.42E-02 hsa-miR-885-5p 0.062 8.37E-05 hsa-miR-668-3p 0.063 2.64E-02 379~656 chr14 hsa-miR-770-5p 0.065 6.11E-03 hsa-miR-433-3p 0.066 1.44E-02 493~136 chr14 hsa-miR-204-5p 0.074 8.44E-03 hsa-miR-1227-3p 0.075 1.09E-02 6789~1227 chr19 hsa-miR-149-5p 0.087 8.73E-05 hsa-miR-485-3p 0.087 3.12E-02 379~656 chr14 hsa-miR-543 0.090 1.25E-02 379~656 chr14 hsa-miR-29b-2-5p 0.108 0.04487562 29b-2~29c chr1 hsa-miR-7-1-3p 0.135 4.20E-02 hsa-miR-487b-3p 0.141 1.06E-03 379~656 chr14 hsa-miR-29c-5p 0.164 2.18E-02 29b-2~29c chr1 hsa-miR-539-5p 0.169 4.81E-03 379~656 chr14
hsa-miR-99b-3p 0.180 1.37E-02 99b~125a chr19
hsa-miR-127-3p 0.202 1.36E-03 493~136 chr14 hsa-miR-324-5p 0.209 9.31E-04 hsa-miR-330-3p 0.210 6.91E-04 hsa-miR-323a-3p 0.210 1.29E-03 379~656 chr14 hsa-miR-532-3p 0.216 1.57E-03 532~502 chrX hsa-miR-625-5p 0.218 1.84E-02
hsa-miR-125a-5p 0.222 3.31E-04 99b~125a chr19
hsa-miR-486-3p 0.222 3.27E-02 hsa-miR-320b 0.225 2.43E-02 hsa-miR-484 0.225 2.82E-03 hsa-miR-491-5p 0.238 4.30E-04 hsa-miR-370-3p 0.241 1.73E-02 hsa-miR-361-5p 0.245 1.23E-03 hsa-miR-134-5p 0.247 4.22E-02 379~656 chr14 hsa-miR-486-5p 0.267 4.14E-02 hsa-miR-376a-3p 0.277 2.19E-02 hsa-miR-193a-5p 0.297 3.90E-02 hsa-miR-422a 0.310 9.63E-03 hsa-miR-103a-3p 0.316 2.21E-03 hsa-miR-766-3p 0.328 1.62E-02 hsa-miR-655-3p 0.330 3.88E-02 379~656 chr14 hsa-miR-95-3p 0.330 4.20E-02 hsa-miR-181a-5p 0.348 1.43E-02
hsa-miR-99b-5p 0.385 7.34E-03 99b~125a chr19
hsa-miR-26a-5p 0.432 2.00E-02
hsa-miR-345-5p 0.443 9.25E-03
Among dysregulated microRNAs, miR-139-5p was noteworthy since it was significantly down-regulated only in supratentorial pLGGs (Table 10) and its downregulated expression has been documented in high-grade gliomas (adult and pediatric) (Dai S. et al., 2015; Yue S. et al., 2015; Miele E. et al., 2013), but still unexplored in pLGGs. Interestingly, the number of differentially expressed microRNAs in pLGGs and pHGGs was lower than that observed when pLGGs were compared with non-neoplastic brain tissues (Tables 13 and 14).
Table 13. MicroRNAs expressed at significantly higher levels in pLGG tissues than in pHGG. Abbreviations: LFC, Linear Fold Change; Chr, Chromosome
microRNA LFC vs.
pHGG
P-value Part of cluster Chr
hsa-miR-875-5p 42.272 1.17E-02 875~599 8 hsa-miR-378 22.129 9.49E-05 hsa-miR-22-5p 18.397 5.23E-04 hsa-miR-7-1-3p 3.815 1.01E-02 hsa-miR-769-5p 3.334 1.20E-03 hsa-miR-409-3p 1.853 3.87E-02 379~656 14 hsa-miR-30a-3p 1.755 4.22E-02
hsa-miR-30e-3p 1.748 2.06E-02 30e~30c-1 1
hsa-miR-625-3p 1.732 4.81E-02
Table 14. MicroRNAs expressed at significantly lower levels in pLGG tissues than in pHGG. Abbreviations: LFC, Linear Fold Change; Chr, Chromosome
microRNA LFC vs. pHGG P-value Part of cluster Chr hsa-miR-29c-5p 0.449 3.44E-02 29b-2~29c 1 hsa-miR-720 0.355 6.30E-04 hsa-miR-181c-3p 0.346 1.07E-02 hsa-miR-1227-3p 0.308 3.95E-03 hsa-miR-1275 0.287 1.79E-03 hsa-miR-744-3p 0.226 1.39E-02
hsa-miR-20a-3p 0.220 3.10E-03 17~92a-1 13
hsa-miR-424-3p 0.215 2.16E-02 424~450b X hsa-miR-638 0.214 1.39E-04 hsa-miR-939-5p 0.208 7.91E-07 6849~939 8 hsa-miR-1290 0.207 6.79E-04 hsa-miR-661 0.206 1.10E-04 hsa-let-7g-3p 0.204 1.24E-02 hsa-miR-656-3p 0.203 3.83E-02 379~656 14
hsa-miR-144-3p 0.196 3.17E-02 4732~451a 17
hsa-miR-27b-5p 0.195 6.34E-03 23b~24-1 9 hsa-miR-571 0.172 1.12E-03 hsa-miR-1291 0.171 1.38E-02 hsa-miR-941 0.169 1.41E-03 941-1~941-5 20 hsa-miR-21-3p 0.155 6.27E-03 hsa-miR-1183 0.155 2.26E-02 hsa-miR-361-3p 0.155 5.69E-05
hsa-miR-650 0.152 1.37E-05
hsa-miR-488-5p 0.151 7.39E-03
hsa-miR-214-5p 0.145 2.98E-03 199a-2~214 1
hsa-miR-596 0.144 2.16E-03 hsa-miR-1208 0.144 1.75E-06 hsa-miR-33a-5p 0.143 5.58E-04 hsa-miR-380-5p 0.124 4.62E-03 379~656 14 hsa-miR-892b 0.121 4.61E-02 891b~892c X hsa-miR-663b 0.105 1.30E-02 hsa-miR-1262 0.104 3.70E-03
hsa-miR-193b-5p 0.103 1.37E-03 193b~365a 16
hsa-miR-1201 0.100 1.11E-03 hsa-miR-566 0.100 7.16E-03 hsa-miR-1303 0.099 1.70E-03 hsa-miR-338-5p 0.093 4.31E-03 1250~657 17 hsa-miR-376a-5p 0.091 1.19E-02 379~656 14 hsa-miR-1300 0.084 4.81E-04 hsa-miR-1255b-5p 0.082 7.56E-04 hsa-miR-1238-3p 0.072 1.37E-02 hsa-miR-1285-3p 0.070 6.13E-04 hsa-miR-639 0.061 3.78E-03 hsa-miR-149-3p 0.052 3.61E-07 hsa-miR-1825 0.046 1.15E-09 hsa-miR-1253 0.043 3.65E-07 hsa-miR-659-3p 0.031 3.03E-09 659~658 22 hsa-miR-1228-5p 0.026 9.98E-04
hsa-miR-675-5p 0.023 1.43E-04
hsa-miR-483-3p 0.013 1.30E-04
The pLGG and pHGG samples segregated into two main clusters, Figure 7.
Figure 7. Hierarchical clustering of microRNAs displaying differential expression in pLGGs vs. pHGGs.
Hierarchical clustering of the 60 microRNAs differentially expressed in pLGGs vs. pHGGs. The Euclidean method was used to generate clusters based on delta Ct values. Tissue: PA, pilocytic astrocytoma (blue); GG, ganglioglioma (red); GNT, glioneuronal tumour (purple); DNET, disembryoplastic neuroepithelial tumour (orange); AG, angiocentric glioma (light blue); pHGG, pediatric high-grade gliomas (brown).
The first (left side of Figure 7) comprised 19 of the 45 pLGGs. The second (right side of Figure 7) was more heterogeneous and contained two subclusters: one contained 21 pLGGs, the second included both pLGGs and pHGGs. This finding highlighted the existence of a gradient of microRNA expression reflecting internal variation within the pLGGs cohort. Notably, the expression levels of miR-139-5p in pLGGs resembled those found in pHGGs. PA GG GlioNeuronal N DNT AG GBM ColSideColors D C t. O P B G 4 5 C D C t. P is .G a b D C t. X 2 4 2 .1 2 B D C t. X 2 4 8 B .1 3 D C t. S a l. C la D C t. O P B G 3 4 S D C t. O P B G 5 0 D D C t. O P B G 3 5 B D C t. O P B G 1 7 D D C t. O P B G 4 4 B D C t. O P B G 4 0 C D C t. O P B G 4 8 F D C t. O P B G 5 5 G D C t. O P B G 5 3 A D C t. X 2 5 6 .1 3 D C t. O P B G 5 4 M D C t. D e l. P e r D C t. O P B G 5 1 S D C t. X 2 5 2 .1 3 D C t. G B M .P e d .F F P E .3 0 D C t. G B M .P e d .F F P E .3 9 D C t. M E D 1 5 7 D C t. O P B G 1 6 C D C t. O P B G 2 3 D D C t. O P B G 5 8 S P D C t. O P B G 7 1 C D C t. G B M .P e d .F .1 2 D C t. G B M .P e d .F .8 D C t. G B M .P e d .F F P E .4 5 D C t. G B M .P e d .F F P E .4 7 D C t. G B M .P e d .F .5 D C t. G B M .P e d .F .9 D C t. G B M .P e d .F .1 1 D C t. G B M .P e d .F F P E .4 0 D C t. G B M .P e d .F .1 0 D C t. G B M .P e d .F .1 D C t. G B M .P e d .F .3 D C t. O P B G 2 5 C D C t. C A T T 2 G D C t. O P B G 1 4 W D C t. O P B G 3 1 O D C t. O P B G 3 3 K D C t. O P B G 1 5 R D C t. O P B G 5 F D C t. O P B G 1 1 T D C t. O P B G 1 8 R D C t. C A T T 3 F D C t. C A T T 4 S D C t. C A T T 5 N D C t. X 2 5 8 .1 3 D C t. O P B G 4 3 D D C t. O P B G 4 9 V D C t. F o r. A le D C t. C o l. A n d D C t. O P B G 1 3 P D C t. C A T T 1 A D C t. O P B G 6 8 C D C t. O P B G 6 9 Z 6 7 14 12 9 10 8 28 1 5 3 4 34 89 29 35 17 43 67 106 25 23 26 11 55 21 72 18 48 22 107 58 108 111 66 95 87 102 103 39 30 15 20 16 59 19 44 74 13 100 63 42 49 27 41 68 53 54 45 73 47 31 79 24 60 94 62 71 46 57 92 50 32 56 83 36 75 51 78 93 101 77 84 99 37 2 64 40 33 90 38 61 65 85 88 80 81 82 96 52 105 91 86 98 104 69 109 70 97 76 110 Tissue Tissue
5.3 PI3K/AKT signaling is enriched in pLGG
To explore the functional implications of the microRNA profile of our pLGGs cohort, we used the DIANA miRPath tool to identify signaling pathways likely to be vulnerable to the altered microRNA expression levels found in these tumours. As summarized in Table 15, after the broader category pathways in cancer, the PI3K/AKT pathway contained the highest number of components putatively targeted by the microRNAs dysregulated in our pLGG cohort.
Table 15. Enriched biological processes using up- or down- regulated microRNAs in pLGGs. Processes were identified and ranked according to p-value, as assigned in KEGG pathway analysis using DIANA-miRPath (v. 3.0).
KEGG pathway p-value #genes #microRNAs
Up regulated
microRNAs in pLGG vs CTRLs
PI3K-Akt signaling pathway 4.91E-04 223 66 Signaling pathways regulating
pluripotency of stem cells 1.19E-07 104 65
Focal adhesion 4.91E-04 141 64
Pathways in cancer 8.43E-06 263 63
Rap1 signaling pathway 1.50E-04 144 63
MAPK signaling pathway 9.55E-03 163 62
Proteoglycans in cancer 3.31E-10 144 62
Ras signaling pathway 3.51E-04 151 62
Regulation of actin cytoskeleton 3.10E-03 142 62
Wnt signaling pathway 1.68E-05 100 61