DOCUMENT DE TREBALL 2007/8
A COMPARISON OF THE ECONOMIC AND
ENVIRONMENTAL PERFORMANCES OF CONVENTIONAL AND
ORGANIC FARMING: EVIDENCE FROM FINANCIAL STATEMENTS
A COMPARISON OF THE ECONOMIC AND
ENVIRONMENTAL PERFORMANCES OF CONVENTIONAL AND
ORGANIC FARMING: EVIDENCE FROM FINANCIAL STATEMENTS
a,bJosep Mª Argilés, Néstor Duch Brownc
ABSTRACT: While conventional farming systems face serious problems of sustainability, organic agriculture is seen as a more environmentally friendly system as it favours renewable resources, recycles nutrients, uses the environment’s own systems for controlling pests and diseases, sustains ecosystems, protects soils, and reduces pollution. At the same time organic farming promotes animal welfare, the use of natural foodstuffs, product diversity and the avoidance of waste, among other practices. However, the future of organic agriculture will depend on its economic viability and on the determination shown by governments to protect these practices. This paper performs panel regressions with a sample of Catalan farms (Spain) to test the influence of organic farming on farm output, costs and incomes. It analyses the cost structures of both types of farming and comments on their social and environmental performance.
Keywords: Organic agriculture, conventional agriculture, organic farming, conventional farming, social and environmental performance, financial performance, social and environmental accounting.
JEL Codes: Q01, Q12, Q51
RESUMEN: Mientras los sistemas de cultivo convencionales se enfrentan a serios problemas de sostenibilidad, la agricultura orgánica se ve como un sistema más amigable con el medio ambiente ya que favorece los recursos renovables, recicla los nutrientes, utiliza los propios sistemas medioambientales para controlar pestes y enfermedades, preserva los ecosistemas, protege las tierras y reduce la contaminación. Al mismo tiempo, el cultivo orgánico promueve el bienestar animal, el uso de comestibles naturales, la diversidad del producto y evita el desperdicio, entre otras prácticas. Sin embargo, el futuro de la agricultura orgánica dependerá de su viabilidad económica y de la determinación mostrada por los gobiernos proteger estas prácticas. En este artículo se llevan a cabo regresiones de panel con una muestra de granjas catalanas para analizar la influencia de los cultivos orgánicos en el rendimiento de la granja, así como en sus costes y en sus ingresos. Se analiza, también, la estructura de costes de ambos tipos de agricultura y se comenta su papel social y medioambiental.
Palabras clave: Agricultura orgánica, agricultura convencional, cultivo orgánico, cultivo convencional, contabilidad social y medioambiental.
Clasificación JEL: Q01, Q12, Q51
a
Comments are welcome. The opinions expressed in the paper do not necessarily reflect the IEB's opinions.
b
The authors would like to thank the Xarxa Comptable Agrària de Catalunya for providing the data that made this paper possible, and the Spanish Ministerio de Educación y Ciencia (SEJ2005-04037/ECON) and the Generalitat de Catalunya Research Group 2005SGR00285 for funding this research.
c
Josep Mª. Argilés University of Barcelona; Néstor Duch Brown University of Barcelona & IEB Address for correspondence: Josep Mª. Argilés ([email protected])
Department of Accounting
Universitat de Barcelona - Facultat d’Econòmiques Av. Diagonal, 690. 08034 Barcelona. (Spain)
1.
IntroductionOver the last few decades world agriculture has introduced increasing levels of modernization and productivity. Key factors in this evolution of modern, or conventional, farming have been intensive capital endowments, farming specialization, the wide-scale application of chemical fertilizers and nutrients and the selection of high-yield crops and livestock, including genetically modified organisms in some countries.
In spite of these recent advances, intensive farming systems face a number of serious problems: the declining effectiveness of land, pesticides and chemical fertilizers, the ongoing loss of biodiversity, environmental and health risks, economic and social costs, as well as various kinds of unpredictable future risks (Matson et al., 1997; Altieri, 1998; Boschma et al., 2001; Tilman, 1998; Drinkwater et al., 1998). In particular, Dupraz (1997), Mishra et al., (1999), Hornbaker et al., (1989), Kurosaki (1997), Popp and Rudstrom (2000) and Omamo (1998) have highlighted the economic problems that arise from specialization and monoculture. More specifically, Melfou and Papanagioutou (2003) measured the effect of nitrate pollution on the growth rate of total factor productivity in Greek agriculture, while Pretty et al. (2000, 2001) assessed a wide array of externalities of modern agriculture in the UK, USA and Germany with aggregated data.
A growing interest in environmentally friendly goods and services has been expressed together with concerns for the risks, and broader environmental problems, associated with intensive agriculture. These issues were all central concerns at the World Summit on Sustainable Development held in Johannesburg in September 2002. In a recent survey (European Commission, 2005), citizens of the European Union (EU) claimed that their main priorities for agricultural policy were, in order of importance: ensuring stable and adequate incomes for farmers (36%), ensuring that agricultural products are healthy and safe (30%), promoting respect for the environment (28%), favouring and improving life in the countryside (26%) and favouring organic production (20%).
Organic agriculture is seen as the most environmentally friendly farming system. It favours renewable resources, recycles nutrients, uses the environment’s own systems for controlling pests and diseases, sustains ecosystems, protects soil, reduces pollution, while at the same time it promotes animal welfare, the use of natural foodstuffs, product diversity, avoidance of waste, etc. (European Commission, 2002). Within the European Union, environmental concerns form a major part of the Common Agricultural Policy (CAP), which actively promotes organic agriculture.
Darnhofer et al. (2005) identified a cluster of committed organic farmers to whom economic considerations were secondary. However, an increasing number of organic, or potentially organic, farmers are tending to emphasize economic concerns (Lund et al., 2002). Rigby et al. (2001) suggest that the development of organic agriculture will depend on its economic viability and the determination shown by the CAP to protect this type of farming.
It is assumed that organic farming provides lower crop yields than intensive farming (Trewavas, 1999, 2001), that it is economically disadvantageous and that it requires government financial support, because the premiums consumers are prepared to pay for organic food (Gil et al. 2000) are insufficient to ensure that organic farming practices become more widespread (Rigby et al., 2001).
However, virtually no studies have been undertaken examining the economic viability of organic farming. Tzouvelekas et al. (2001) found lower technical efficiency scores in Greek organic cotton farms vis-à-vis their conventional counterparts, while Lansink et al. (2001) found that Finnish organic farms are, on average, more efficient in relation to their own technology, but that they use lower production technology than conventional farms, thus resulting in approximately 40 per cent less productivity. Lansink and Jensma (2003) found larger variable profit in organic than in conventional Dutch farms, as well as interesting conclusions regarding the trends in organic farming practises. Unfortunately, they do not offer information about bottom line profits. Dima and Odero (1997) studied a sample of Kenyan farms and found that maximum yields can be obtained from a combination of organic manure and chemical fertilizers. Descriptive statistics presented by Offermann and Nieberg (2000), typically drawn from small samples, do not offer tests and inferences applicable to the population of farms. Dobbs and Smolik (1996) found that a conventional corn and soybean farm was more profitable than a corresponding organic farm during most years in an 8-year time period. Kerselaers et al. (2007) reported the economic potential of converting to organic farming, but due to a lack of available data their estimations had to be based on simulations. Pretty et al. (in press) assessed the financial and environmental costs of conventional and organic agriculture in the UK with aggregated data.
Our study constitutes an empirical analysis of the respective economic performances of organic and conventional farming. Its main contribution to the literature lies in its integration of five elements. Thus, first, the study operates at the individual farm level rather than at the aggregated or average farm level and, secondly, it uses real data rather than normative and simulation approaches. Third, unlike previous studies in the field, it draws statistical inferences about the influence of organic and transitional farming on financial costs, output and bottom line profit.
Fourth, the study covers a broad spectrum of farm productions and, finally, it analyses environmental and social issues on the basis of available financial data.
The following section deals with the model specification and a description of our sample, the third section presents and explains our results, while our concluding remarks are outlined in the final section.
2. Research design
2.1. Model specification.
Our analysis emphasises the ability of farms to generate net revenue, in accordance with their specific characteristics, from the range of activities that they practise. First, a revenue function is defined, so that a farm’s output can be approximated and analysed. Second, we define a cost function to study the respective efficiencies of organic and conventional farming. Finally, we combine these two functions in a net revenue (or profit) function to analyse jointly the characteristics generating profitability in the different types of farming.
Algebraically, gross revenue from agricultural production activity can be represented in terms of variable inputs (x):
{
(
);
0
}
(
1
)
max
)
,
(
p
x
=
pq
q
∈
Y
x
p
>
R
qwhere p is a m-dimensional vector of positive output prices and Y(x) refers to the producible output set with q being physical output. Provided that certain conditions are satisfied, this revenue function allows us to analyse whether different farm characteristics have a differentiated impact on farm revenues.
Similarly, given the respective nature of conventional and organic farming, it seems logical to assume that a further source of differences between them should be derived from their different costs of production. Formally, the cost function can be defined as:
{
( ); 0}
(2) min ) , ( 0 ∈ > = ≥ wxx V q w q w C xwhere w is a n-dimensional vector of positive input prices, wx is the inner product (
∑
iw
ix
i ) and V(q) the input requirement set. Again, given the assumptions that underlie the existence of costs functions and the fulfilment of their properties, it is possible to study the set of characteristics that have most influence on costs of production for conventional and organic farms.Finally, the difference between revenues and costs gives some measure of profitability. Profit maximization can be separated into two stages. The first stage, which can be considered as the short run, involves maximizing profit for a given output. In the long run (second stage), output has to be chosen to maximize profits. When output is fixed, revenue is also fixed and profits are maximized by minimizing costs. Hence, fixed output profit maximization yields the same input configuration as cost minimization. In a multi-output setting such as this, it is possible to use the properties of the revenue function or the cost function to infer the properties of the profit function, but it is better to link the properties of the profit function directly from the production possibility frontier (T). Thus, from (1) and (2) we have:
{
(
,
)
;
,
0
}
(
3
)
max
)
,
(
,−
∈
>
=
Π
p
w
pq
wx
x
q
T
w
p
x qThese three equations form the basis of our empirical analysis. There are several characteristics that should be controlled for, besides the fact that production units practise conventional or organic farming. These include unit size, type of crop, location, the existence of irrigation systems, etcetera. In order not to impose more restrictions by means of certain ad-hoc functional forms, our main interest is in detecting the characteristics that lead to production, cost and profit differences between conventional and organic farms. Assuming further that farms are price takers in the product markets, that factor markets are perfectly competitive and that farms are identical in all respects except regarding whether they adopt organic or conventional farming practices, then the gross revenue function we estimate below can be described by:
)
4
(
)
,
,
,
,
(
)
,
(
p
x
R
O
S
I
F
L
R
=
where R represents gross revenues from the farming operation, which depends on the fact that farms perform organic production systems (O), their size (S), irrigation of land (I), the type of farming they perform (F) and, finally, their location (L). In the same vein, assuming perfect competition in both factor and product markets, as well as identical input requirement sets for all firms, the cost function can be defined as:
)
5
(
)
,
,
,
,
(
)
,
(
w
q
C
O
S
I
F
L
C
=
Similarly, the profit function derived directly from the revenue and cost functions can be expressed as:
)
6
(
)
,
,
,
,
(
)
,
(
)
,
(
)
,
(
p
x
R
p
x
C
w
q
P
O
S
I
F
L
P
=
−
=
Thus, the following reduced-form multiple regression model can be used to estimate the influence of organic farming on farm output1, costs and profits:
The dependent variable Y represents the performance of farm i. The model seeks to study the influence of organic farming on farm performance, controlling also for farm characteristics, such as size, irrigated area, type of production farming and geographical location, which are all likely to affect empirical results when using a heterogeneous sample of farm data.
Two dummy variables indicate whether a farm i performs, on the one hand, organic farming (ORGANIC) or, on the other, partly organic or in transition to organic farming (ORGTRANS), when their value is equal to one (or zero otherwise), while the default variable corresponds to conventional farms.
As conventional farming is more intensive and not concerned with crop rotation and land rest, it is expected to be more productive in terms of physical production. However, organic farming tends to compensate for this through higher quality and the subsequently higher prices it can command. Consequently, no prior hypothesis can be formulated with respect to the relation between organic farming and monetary output. In the specific case of ORGTRANS, lower output is expected for farms in transition to organic farming, because, in line with European regulations, farms must cease production for two to three years before they can label their produce as organic. However, the fact that this category includes transitional and partly organic farming does not allow us to formulate a definitive prior hypothesis.
1
The Farm Accountancy Data Network (FADN) recognises revenue with production valued at market price, and labels it as output. Consequently with the data used in this study, hereinafter, we employ this term.
)
7
(
ln
ln
ln
1 1 1 0 i m m mi Lm j j j Fji Ii k k S ki Ok iO
S
I
F
L
Y
=
β
+
∑
β
⋅
+
β
⋅
+
β
⋅
+
∑
β
⋅
+
∑
β
⋅
+
ε
= = =Organic farming tends to avoid input waste and saturation, saving on chemicals, fertilizers, medicines for livestock, etc. Indeed, it employs its own farm resources more frequently than conventional farming. However, as it does not use resources intensively, with the effect that yields are lower than in conventional farming, we would expect the ratio of input-to-output to be higher. Additionally, higher costs would correspond to higher product quality. Finally, organic farming usually requires more work than conventional farming. Controlling for other variables, and specifically size, no clear hypothesis can be formulated with respect to the influence of organic farming on costs. Consequently, no prior hypothesis for profits can be proffered, though assumptions and existing research seem to suggest that organic farms will record lower incomes or profits than those reported by conventional farms. Farms in transition to organic farming are required by existing EU regulations to implement 2-3 years of land rest. However, the fact that our data base does not distinguish between transitional and partly performing organic farming, no conclusive hypothesis can be made with respect to ORGTRANS and their costs and profits.
Size is an obvious control variable in the model, as we would expect bigger farms to have a higher output. The European size unit (ESU) is the accepted, and widely used, measure of size in EU agricultural statistics. ESU defines the economic size of an agricultural holding on the basis of its potential gross added value. It is calculated by assigning predetermined values of gross added value to the different lines of farm production. Since 1995 one ESU has been fixed at 1,200 ECU of standard gross margin. This standardized measure of size is homogeneous for different types of farming.
Dry weather and water shortages handicap farming, especially in Mediterranean countries, as they tend to limit farms to just a few types of farming and to reduce farm productivity. Irrigation yields more productive crops and is usually devoted to more intensive, productive crops. Thus, the percentage of irrigated utilized agricultural area (PERCIRRIGUAA) is hypothesized as being associated with greater output and higher costs - because such land is typically used for more intensive farming and higher profits - because it allows most profitable farming opportunities to be chosen. The variable cannot be transformed into logarithms because of zero values.
According to the methodology of the Farm Accountancy Data Network (FADN), seven dummy variables can be employed to indicate that a farm operates the corresponding type of production farming when these variables are equal to one, and zero otherwise: FIELD for farms predominantly specialized in cereals, general field extensive or mixed crops, HORTICULTURE for farms specialized in horticulture, PERMANENT for farms predominantly specialized in fruits, citrus, olives, wine or combined permanent crops, MILK for farms specialized in
dairying, GRAZING for farms specialized in rearing or fattening cattle, sheep, goats and other grazing livestock, GRANIVORE for farms predominantly specialized in pigs and poultry, while mixed livestock and/or crop type of farming (sometimes combining with various livestock and crops) is the default category. In the geographical context of our sample, where water shortages and dry weather are frequent, agricultural land is very scarce and livestock is usually reared on capital-intensive farms. Mixed livestock farms are expected to face higher costs (and production) than farms with predominantly field and permanent crops and those with extensive grazing livestock, while mixed farms should face lower costs (and production) than those specialized in more intensive agriculture, such as horticulture, dairy and granivores. No conclusive hypothesis could be formulated with respect to profits by production type.
Two dummy variables indicate whether a farm is located in less-favoured (LESSFAZONE) or mountain zones (MOUNTZONE) when their values equal one (and zero otherwise), while the default category applies to farms located in what are labelled “usual zones”. The former are usually located at some distance from consumer and purchasing markets and have lower technological, infrastructure and service endowments. Farming in such locations is usually handicapped by climate conditions and location opportunities. Higher outputs are expected from farms located in “usual zones” than from those in mountain or less-favoured zones. No conclusive hypothesis can be formulated with respect to costs because, on the one hand, less-favoured and mountain-located farms enjoy lower prices for some inputs (work, land rent, etc.), whereas, on the other, they have more restricted access to services and technological facilities. Equation (7) is expressed in the following full equation that tests the influence of organic farming on farm output (OUTPUT):
[
]
[
]
)
8
(
ln
ln
12 11 10 9 8 7 6 5 4 3 2 1 0 i i i i i i i i i i i i i iLESSFAZONE
MOUNTZONE
GRANIVOR
GRAZING
MILK
PERMANENT
RE
HORTICULTU
FIELD
AA
PERCIRRIGU
ESU
ORGTRANS
ORGANIC
OUTPUT
ε
β
β
β
β
β
β
β
β
β
β
β
β
β
+
+
+
+
+
+
+
+
+
+
+
+
+
=
In order to test the influence of organic farming on costs we took data for registered costs (REGCOST) from the FADN for farm i. PROFITREG indicates the difference between output and registered costs for farm i. However, Schmitt (1991) recognised that agriculture is still predominantly centred around family farms in advanced western economies, and consequently family work constitutes an important share of total work on farms. Various authors (e.g. Hopkins and Heady, 1982; Bublot, 1990) have discussed the need, therefore, to include family work in farm costs, and have suggested a number of valuation methods. FADN provides data about the amount of work expended on the farm (expressed in annual work units),
distinguishing that proportion which corresponds to the work put in by the members of the family, but it considers only those costs that correspond to non-family work. Thus, although the need to include family work in cost valuation is widely recognized, FADN usually fails to do so. Each year the Spanish Ministry for Agriculture publishes the reference income that a farmer would earn in an alternative job. In this way, we calculated the opportunity cost of the work put in by the family and added it to the registered costs so as to obtain the total costs of the farm (TOTALCOST) and the subsequent income in absolute (PROFITTOTALCOST).
In the traditional model, cost behaviour is dependent on activity. As output is the most common measure for activity, costs can be expected to be positively influenced by output. Costs are described as being either fixed or variable with respect to changes in activity. It is widely assumed that variable costs change in proportion to changes in activity, while fixed costs, which remain invariable in the short term, are also related to changes in activity in the long term. Thus, we can expect costs, and profits, to be positively influenced by output.
When the dependent variable is costs or profits, the full model of equation (7) can be expressed as:
[
]
) 9 ( ln ln 12 11 10 9 8 7 6 5 4 3 2 1 0 i i i i i i i i i i i i i i LESSFAZONE MOUNTZONE GRANIVOR GRAZING MILK PERMANENT RE HORTICULTU FIELD AA PERCIRRIGU OUTPUT ORGTRANS ORGANIC ε β β β β β β β β β β β β β ϕ + + + + + + + + + + + + + =where the dependent variable φ symbolises performance with respect to costs and profits.
Here, we also perform an analysis of the cost structure of organic and conventional farms, drawing conclusions about their respective social and environmental performances. FADN classifies costs as: specific, farming overheads, depreciation, external factors and taxes. The European Commission (1997, 1998) provides a detailed classification of these costs. Specific costs include seeds and seedlings, fertilizers, crop protection products, feed and feedstuffs for livestock, medicines, veterinary fees and other specific crop, livestock and forestry costs. Farming overheads correspond to supply costs linked to productive activity but not linked to specific lines of production. They include energy, machinery and building current costs, as well as costs linked to work carried out by contractors and to the hire of machinery, water, insurance, accountants’ fees, telephone charges, etc. However, because of their impact on the environment we decided to separate energy costs from other overhead costs. Depreciation is determined on the basis of the replacement value and is concerned with plantations of permanent crops, farm buildings and fixed equipment, land improvements, machinery and equipment and forest
plantations. External factors represent the remuneration of inputs (work, land and capital) that are not the property of the holder. Here, we chose to analyse wages separately from rent and interest. “Taxes” refers to the value added tax (VAT) balance on current operations, when the special agricultural VAT system applies, as well as farm taxes and other charges on land and buildings. It does not include taxes on farm profits.
2.2. Data collection and sample.
The farm accountancy data network (FADN) was created in 1965 by Regulation (EEC) 79/65 of the Council under the Common Agricultural Policy (CAP). Today, FADN collects accounting information at the level of individual farms, and every year it gathers data from a rotating sample of professional farms across all member states. FADN data is collected through a questionnaire, called the “Farm Return”, which is filled out by the farms with the assistance of specialised local accounting offices. The information obtained through the Farm Return is coded and transmitted to the European Commission. The information is summarised in reports similar to balance sheets and income statements and published by the European Commission in aggregated terms.
The European Commission (1997, 1998) provides detailed information about its procedures and methodology.
FADN was conceived as a complementary source of statistical information about farm income for policy makers, and the sample of farms from which the data is obtained should be representative of a range of characteristics and types of farming in European agriculture. Since 2000 data on organic farming in the European Union have been collected. Every participating farm must present information according to one of three possible codes: partly organic or in transition to organic farming (code 3), exclusively organic farming (code 2) and non-organic farming (code 1). As can be seen, no distinction is drawn between farms in transition to organic and farms performing partly organic and conventional farming.
The Catalan Government provided data from its Xarxa Comptable Agrària de Catalunya (XCAC), the Catalan subsidiary of the FADN, for the year 2000, the first year in which data on organic farming was available, to 2003. From the overall unbalanced records of 1,556 farm-years, 1,414 practised non-organic farming, 97 were partly organic or in transition to organic farming and only 45 farms were exclusively engaged in organic farming. This proportion of
organic farms, however, is even larger than that found in Spanish agriculture2. We deflated these data to 2000 values using a gross domestic product deflator.
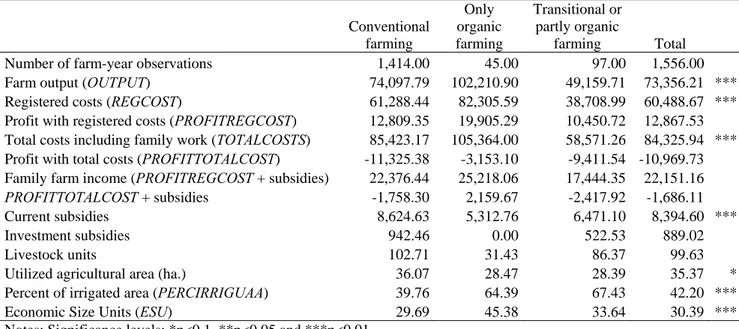
Table 1 shows our descriptive data sample. As can be seen from the univariate analysis, organic farms obtain a higher output, generate more costs and are larger. At the same time they were found to use a smaller agricultural area, but recorded a higher percentage of irrigated area. The significantly lower amount of subsidies available for organic farming indicates that Spanish authorities are not fully committed to organic agriculture, and that there are more important targets than organic agriculture for subsidies.
Table 2 shows a low Pearson’s correlation between the continuous independent variables, giving an initial indication that collinearity does probably not affect estimations.
Table 1. Descriptive statistics: mean values (monetary values in €) Conventional farming Only organic farming Transitional or partly organic farming Total Number of farm-year observations 1,414.00 45.00 97.00 1,556.00 Farm output (OUTPUT) 74,097.79 102,210.90 49,159.71 73,356.21 *** Registered costs (REGCOST) 61,288.44 82,305.59 38,708.99 60,488.67 *** Profit with registered costs (PROFITREGCOST) 12,809.35 19,905.29 10,450.72 12,867.53 Total costs including family work (TOTALCOSTS) 85,423.17 105,364.00 58,571.26 84,325.94 *** Profit with total costs (PROFITTOTALCOST) -11,325.38 -3,153.10 -9,411.54 -10,969.73 Family farm income (PROFITREGCOST + subsidies) 22,376.44 25,218.06 17,444.35 22,151.16
PROFITTOTALCOST + subsidies -1,758.30 2,159.67 -2,417.92 -1,686.11
Current subsidies 8,624.63 5,312.76 6,471.10 8,394.60 *** Investment subsidies 942.46 0.00 522.53 889.02
Livestock units 102.71 31.43 86.37 99.63
Utilized agricultural area (ha.) 36.07 28.47 28.39 35.37 * Percent of irrigated area (PERCIRRIGUAA) 39.76 64.39 67.43 42.20 *** Economic Size Units (ESU) 29.69 45.38 33.64 30.39 *** Notes: Significance levels: *p<0.1, **p<0.05 and ***p<0.01
Table 2. Pearson correlations between continuous independent variables
PERCIRRIGUAA ln[ESU] 0.1738 ESU 0.1476 OUTPUT -0.0487 ln[OUTPUT] 0.0077
2
According to data from the Spanish Ministry for Agriculture, 1.19% of Spanish farms practised organic farming exclusively in 1999 (similar to the 1.39% of Catalan farms), while in our sample they account for 2.9%.
3. Empirical results
Variance inflation factors, condition indexes and variance proportions of variables suggest that multicollinearity is unlikely to affect estimations. As our sample presents the typical autocorrelation pattern for independent variables throughout the period studied, we performed various panel regression estimations correcting for autocorrelation disturbances. Thus, the estimation method assumes disturbances to be heteroscedastic and contemporaneously correlated across panels. The commonly used Hausman test (Hsiao, 2005) rejected the null hypothesis ofno correlation between individual effects and explanatory variables. As individual effects are correlated with the regressors in all estimations, the random effects estimator is inconsistent, while the fixed effects estimator is consistent and efficient. We therefore performed panel data estimations with fixed effects to test the influence of organic farming on performance.
Table 3 displays these results. Estimations in column A, corresponding to farm output, show significant expected coefficients for farm size and field crops with p<0.01, and for horticulture and permanent crops with p<0.1. A significant positive sign for organic farming suggests that farmers obtain a premium price from the market which fully exceeds the lower amounts of physical output. The negative sign for farms in transition or partly performing organic farming is not significant with p<0.1.
Table 3.
Estimations relati
ng organic far
m
ing to output,
costs and income (t-stati
stics in parentheses). Varia b les (A) ln[ OUTPUT ] (B) ln[ REGCOS T ] (C) 1 PROFIT REGCO ST (D) ln[ TOTALCOSTS ] (E) 1 PRO FITT OTALC O ST C onst ant 9. 16 4 68 6 (4 8. 9 0) ** * 6. 89 9 93 3 (2 5. 0 6) * ** -218 91 .61 (-5. 21 ) ** * 8. 52 5 88 6 (5 0. 3 7) * ** -461 12 .85 (-1 0 .90) ** * ORGANIC .30 869 83 (2 .1 9) * * .07 205 51 (0 .6 1) -120 1.013 (-0. 21 ) -.0 023 101 (-0. 03 ) 2 643 .5 3 (0 .4 5) ORGTRAN S -. 0 053 656 (-0. 11 ) .00 131 93 (0 .0 3) 1 240 .5 64 (0 .6 2) -.0 128 886 (-0. 52 ) 1 925 .8 85 (0 .9 5) Contr o l vari a bles: ln [ES U ] .47 347 19 (9 .6 7) ** * ln [OUTP U T] .33 765 85 (1 3. 7 5) ** * .4 11 4 77 4 (2 8. 2 1) ** * .2 41 7 88 4 (1 6. 0 1) ** * .4 07 9 84 6 (2 7. 7 5) ** * PERCIRR IGUAA .00 182 93 (1 .2 6) -.0 005 486 (-0. 46 ) 9 .2 949 89 (0 .1 6) -.0 002 824 (-0. 38 ) 8 .8 803 31 (0 .1 5) FIEL D -. 1 781 938 (-2. 81 ) * ** -.2 218 203 (-4. 28 ) ** * 61 3 5. 57 2 (2 .4 0) * * -.1 553 832 (-4. 87 ) ** * 68 8 6. 17 (2 .6 7) ** * HOR TIC U LT URE -. 3 745 642 (-1. 78 ) * -.2 253 169 (-1. 32 ) 1 133 5.47 (1 .3 4) -.1 240 358 (-1. 18 ) 9 535 .0 14 (1 .1 2) PERMANENT -. 1 620 507 (-1. 91 ) * -.2 629 831 (-3. 72 ) ** * 65 9 0. 05 3 (1 .8 9) * -.1 444 926 (-3. 33 ) ** * 65 1 3. 57 5 (1 .8 6) * MILK -. 0 654 425 (-0. 46 ) .10 995 18 (0 .9 4) 6 213 .6 46 (1 .0 7) .06 945 91 (0 .9 6) 5 062 .9 94 (0 .8 7) GRAZ ING -. 1 052 164 (-0. 86 ) .04 838 61 (0 .4 8) -485 2.8 (-0. 97 ) .05 004 69 (0 .8 0) -544 8.338 (-1. 08 ) GRANIVOR .05 334 78 (0 .6 6) -.0 586 958 (-0. 89 ) -174 9.237 (-0. 53 ) -.0 084 159 (-0. 21 ) -169 5.235 (-0. 51 ) MOUN TZ ONE .27 042 25 (1 .3 0) -.1 135 267 (-0. 66 ) 1 064 8.65 (1 .2 5) -.1 214 467 (-1. 15 ) 1 186 1.25 (1 .3 8) LESSFA ZONE .03 144 35 (0 .2 8) .09 617 6 (1 .0 3) -352 6.773 (-0. 77 ) .03 509 32 (0 .6 1) -307 5.574 (-0. 66 ) R-s quare (ove rall): 0. 57 5 3 0. 74 9 9 0. 31 6 6 0. 76 5 6 0. 16 8 3 F 12 .2 0 * * * 20 .5 7 * * * 68 .6 6 * * * 27 .3 5 * * * 66 .6 3 * * * N o tes: Sign if ican ce levels: *p<0 .1 , ** p < 0 .05 and * **p <0.01 1. Unt rans form ed de pen d en t an d i nde pe nde nt v ari abl e OU TP UT , beca use l o gari th m s can no t be cal cu la te d fo r negat iv e v al u es of INCOME .
Columns (B) and (D) display estimations for farm costs, while columns (C) and (E) do the same for profits. These coefficients indicate that organic and transitional farming do not significantly influence farm costs or profits. Estimations suggest that the higher charges associated with organic farming, compared to those associated with conventional farming, are balanced by input savings. OUTPUT, the most influential variable, and dummies for farms specialised in field and permanent crops present the expected significant signs with p<0.01 for costs. As expected, OUTPUT influences profits positively and significantly with p<0.01. Farms specialized in permanent crops have a significant influence on higher profits with p<0.1, as do those specialised in field crops, with p<0.05 and p<0.01 with respect to profits with registered costs and total costs respectively. The remaining dummies for farm specialization and location, as well as the variable for the percentage of irrigated land, do not present significant signs with p<0.1.
The fact that no significant sign was found in the case of output, costs, or profits for transitional farms suggests that farmers attempt to make a gradual conversion to organic farming, and initially combine organic practices with conventional farming.
We also performed regressions for profits including subsidies, calculated both with registered costs, and including opportunity costs. These results (not shown here) were similar to those included in columns (C) and (D) of Table 3. While output is the most influential variable, organic and transitional and partly organic farming do not significantly influence farm incomes (subsidies included). Subsidies are mainly influenced by geographical location and the type of farming production. In terms of support for organic agriculture, European policies should complement those initiated by national governments. Though the CAP seeks to promote organic agriculture, unlike other European governments, Spain does not emphasize measures that protect sustainable agriculture. The only remaining significant (with p<0.05) control variable was the dummy for farms specialised in field crops.
It might be argued that the sample of conventional farms includes a number of small, backward farms with ageing farmers and/or farmers with no expectations of continuing operations in the near future. We would expect these farms to be poor performers, and so any comparisons between organic and conventional farms should not include these farms. Regressions performed excluding the 5th and the 10th percentiles of the smallest farms yielded very similar results (not shown here) to those in Table 3, thereby demonstrating that our results are not biased by the small, backward non-viable farms.
The cost structure of farms is shown in Table 4. Although Table 3 does not display any significant influence of organic farming on farm costs, there are significant differences in cost structure between conventional, organic and transitional or partly organic farming. When the three farming types are considered, significant differences are found for energy, other overheads, depreciation, salaries and rent and interests. Overlooking the special circumstances of transitional farming, it is interesting to note that organic farming has significantly higher wage costs than those reported for conventional farming, but significantly lower specific and energy costs. Organic farming relies less on chemical and mechanical procedures than conventional farming but, by contrast, it uses more labour and generates more employment. Likewise as its operations are less dependent on machines, it consumes less diesel oil. As it recycles nutrients and uses the environment’s own systems for controlling pests and diseases, it spends less on fungicides, insecticides, chemical-based fertilizers and crop protectors, purchased feedstuff and medicines for livestock. Consequently, specific costs and energy consumption are lower in organic farming, while wages paid are higher.
Table 4.
Cost structure of registered costs for conventi
onal, organic and transitional or partl y or ganic fa rm ing t y pe (in percent of tot al re gistered costs )
Cost structu
re
Conventional
far
m
ing
Only organic
far
m
ing
Transitional or
partly organic
fa
rm
ing Total
Significant
di
fferences
between the
three farm
ing
types
Significant
di
fferences
between
conventional and
organic farm
ing
Specific
cost
37.18 30.52 35.80
36.90
**
Energy 7.91
5.11
10.97
8.02
***
***
Other overhead costs
20.94
19.11
24.56
21.11
***
Depreciation
23.83 23.52 17.47
23.42
***
Wages paid
4.80
17.76
4.13
5.13
***
***
Rent and interests
6.77
4.60
9.09
6.85
***
VAT balance and taxes
-1.43
-0.63
-2.02
-1.44
Total registered costs
100.00
100.00
100.00
100.00
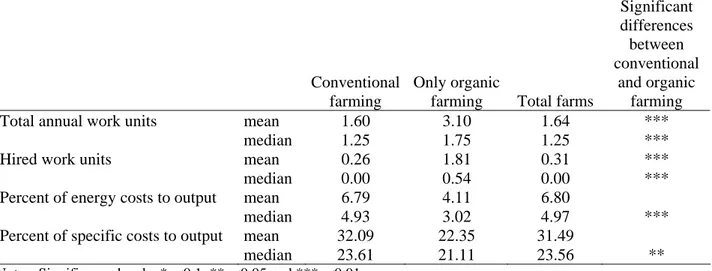
N o tes: Sign if ican ce levels: *p<0 .1 , ** p < 0 .05 and * **p <0.01Table 5 displays more detailed information about specific costs, work use and energy consumption. In order to avoid any misleading information caused by extreme values, we also performed tests with median values. In this instance, organic farming almost doubled its mean value of annual work with respect to that of conventional farming. The difference was even more marked for hired work. Although no significant differences were found for the mean values of the percentage of energy and specific costs to output between organic and conventional farming, significant differences with p<0.01 and p<0.05 were found for median values.
Table 5. Mean and median values of work units, specific and energy costs.
Conventional farming
Only organic
farming Total farms
Significant differences between conventional and organic farming
Total annual work units mean 1.60 3.10 1.64 ***
median 1.25 1.75 1.25 ***
Hired work units mean 0.26 1.81 0.31 ***
median 0.00 0.54 0.00 ***
Percent of energy costs to output mean 6.79 4.11 6.80
median 4.93 3.02 4.97 ***
Percent of specific costs to output mean 32.09 22.35 31.49
median 23.61 21.11 23.56 **
Notes: Significance levels: *p<0.1, **p<0.05 and ***p<0.01
Wackernagel and Rees (1996) proposed a method for measuring the human impact on the earth by calculating the ecological footprint (EF). The EF appraises the total bioproductive area needed to sustain society’s activities, accounting for resource supply, waste absorption and the space occupied by human infrastructure (Haberl et al., 2004). In spite of its limitations (Ayres, 2000; Opschoor, 2000; van Kooten and Bulte, 2000), it provides meaningful comparisons between nations as to the demands they place on nature to sustain human activities and their respective biocapacity (Monfreda et al., 2004; Deutsch et al., 2000). Human consumption of energy is an important component of the EF (Stöglehner, 2003). Specific data on energy consumption from our sample allow us to assess the incremental environmental impact of conventional farming with respect to organic farming in terms of EF. From the three EF calculations available for converting energy consumption into its corresponding land area, the forest area needed to sequester the CO2 emitted from burning fossil fuel is the most commonly used and accepted, even though it gives the smallest EF measurement (Wackernagel and Rees, 1996, p. 72-74). However, all three approaches have been found to give similar results
(Wackernagel and Rees, 1996, p. 72; Stöglehner, 2003), albeit that they tend to underestimate the real spatial impact on the biosphere (Wackernagel and Silverstein, 2000). The XCAC provided us with detailed data about the fuel and electricity consumption for each farm. On average, the conventional farms in our sample spent 6.10% of total output on fuel and 0.69% on electricity over the period studied, while organic farms spent 3.74% and 0.37% respectively. According to these data, the EF of the energy spent by conventional farms is on average 5.32 hectares, 14.75% of their mean utilized agricultural area, which means an incremental EF of 2.08 hectares with respect to organic farming, or 5.77% of their mean utilized agricultural area3, thus providing additional evidence of the lower environmental impact of organic farming.
4. Discussion and Conclusions
This paper conducts an empirical analysis of output, costs and income in organic farming.
Organic farming is the most environmentally friendly farming system available today and the citizens of the European Union have identified it as one of the main priorities within the region’s agricultural policy. Likewise, a small group of organic farmers are highly committed to safeguarding the environment. However, its future will depend on the economic viability of its practices and the support it receives from the CAP.
Our results indicate that organic agriculture has a significant influence on raising financial output, suggesting that organic farmers obtain a market premium that reflects the consumer’s willingness to pay for healthier and environmentally friendly food. Yet, no significant influence was found in farm costs and bottom line profits when calculating the two with registered financial costs and adding the opportunity costs of the work put in by the family. No influence was found either when subsidies were included as part of farm profits. Our results suggest that subsidies are mainly driven by factors other than organic farming.
3
Calculations were performed based on the following data:
Energy conversion factors: 28.38095 litres of gas oil/diesel per Gigajoule and 277.77 kWh per Gigajoule (British Petroleum, 2007).
Specific energy footprint global average in Gigajoules/hectare per year: 55 for coal, 71 for liquid fossil fuel, 93 for fossil gas, 71 for nuclear energy and 1000 for hydro-electric energy (Wackernagel et al., 1999).
Prices for electricity and agricultural gas oil in 2000 in Spain: 12.96 pts./kWh (Spanish Ministry of Economics, 2001) and 74.7075 pts./litre (COAG, 2004) respectively.
Sources of electricity in 2000 in Spain: 15.73% from hydraulic, 35.19% from nuclear, 43.27% from coal and 5.81% from fuel-gas (Spanish Ministry of Economics, 2001).
Surprisingly, estimations for farms in transition to, or partly performing, organic farming did not show any significant influence on output, costs and profits. It seems probable that farms convert gradually to organic farming, combining both conventional and organic farming with a tiny proportion of their business in transition.
Although we found no significant differences in total costs between the two types of farming, their composition did differ. Wages accounted for a greater share of costs in organic than in conventional farming, while energy and specific costs accounted for smaller shares.
Total costs or the bottom line profits provide biased information about the economic and social performance of organic farming with respect to that of conventional farming. Detailed information about costs showed that organic farming generates more employment and consumes less energy, insecticides, fungicides, chemical-based fertilizers and crop protectors, as well as less purchased feedstuff and medicines for livestock, thus contributing to alleviate the environmental impact of agriculture.
The financial data available provide homogenous values that allowed us to compare various situations. However, they also hide inherently different facts and can be misleading. While the impact on the profit and loss statement of 1€ of energy was the same as that of 1€ of wages, both expenses differ markedly in terms of their social and environmental impact. There are crucial transactions that are not marketed, registered and valued, but yet yield social and environmental profits and costs. In the specific case of agriculture, conventional farming is reaching a point of saturation that heralds many present and future environmental risks and problems. The issue is too important to be solved purely in terms of financial viability. Rather there is a need to examine nitrate pollution, biodiversity, food safety, soil protection, etc. when assessing agricultural decisions. Financial accounting values cannot be considered reliable when disclosing the social and environmental costs of individual farms. The recently introduced International Accounting Standard 41 did not attempt to include social and environmental data, although their inclusion is essential if they are to be given adequate weight in the decision-making process.
Few studies in economics have considered non-marketed outputs and costs. Constanza et al. (1997) estimated the current economic value of the world’s ecological systems and its natural capital. In the specific case of agriculture, Pretty et al. (2000) assessed a wide array of external costs of agriculture, none of which are available from either agricultural financial statements or from the FADN, one of the cornerstones of the CAP. From within accounting circles demands are being made concerning the necessity of broadening the field covered by accounting in order
to include social and environmental data (e.g. Mathews, 1997, Bebbington, 1997). A worthy and fruitful result of such calls can be found in the Global Reporting Initiative, but this remains a voluntary initiative and is not at all suited to the agricultural sector.
This paper has performed an empirical analysis comparing organic and conventional farming practices and has sought to draw environmental and social conclusions from the limited financial accounting information available for our sample of individual farms. We found no significant differences in financial performance between organic and conventional farms, although the former recorded a significantly lower environmental impact and created more employment opportunities.
Future research is needed to analyse broader aspects of the environmental and social impacts of the two types of farming. The inclusion of social and environmental issues in agricultural accounting and/or the FADN should make this easier. Future research is also needed in order to identify the kind of data that can provide a more appropriate assessment of sustainability (Edwards-Jones and Howells, 2001, Rigby and Cáceres, 2001). In our opinion, the EF analysis provides an interesting and comprehensive framework in which to build these studies.
References
Altieri, M.A., 1998. Ecological impacts of industrial agriculture and the possibilities for truly sustainable farming. Mothly Labor Review 50 (3), 60-72.
Ayres, R.U., 2000. Commentary on the utility of the ecological footprint concept. Ecol. Econ. 32 (3), 347-349.
Bebbington, J., 1997. Engagement, education and sustainability: a review of environmental accounting. Accounting, Auditing and Accountability Journal 10(3), 365-381.
Boschma, M., Joaris, A. and Vidal, C., 2001. Agriculture and Environment. Concentration of livestock production. European Commission, Brussels.
Britis Petroleum, 2007. Statistical review of rorld energy 2007
(http://www.bp.com/productlanding.do?categoryId=6848&contentId=7033471)
Bublot, G., 1990. Économie et Gestion de l'Exploitation Agricole. Volumes I et II. Université Cathólique de Louvain, Louvain.
COAG, 2004. Informe gasóleo agrícola: situación económica y propuestas de COAG (http://www.portalbesana.es/estaticas/servicios/documentacion/gasoleo_agricola.html).
Darnhofer, I., Schneeberger, W. and Freyer, B., 2005. Converting or not converting to organic farming in Austria: farmer types and their rationale. Agriculture and Human Values 22, 39-52.
Deutsch, L., Janson, A., Troell, M., Rönnbäck, P., Folke, C. and Kautsky, N., 2000. The ecological footprint communicating human dependence on nature’s work. Ecol. Econ. 32 (3), 351-355.
Dima, S.J. and Odero, A.N., 1997. Organic farming for sustainable agricultural production. A brief theoretical review and preliminary empirical evidence. Environmental and Resource Economics 10, 177-188.
Dobbs, Th.L. and Smolik, J.D., 1996. Productivity and profitability of conventional and alternative farming systems: a long-term on-farm paired comparison. Journal of Sustainable Agriculture 91(1), 63-79.
Drinkwater, L.E., Wagoner, P. and Sarrantonio, M., 1998. Legume-based cropping systems have reduced carbon and nitrogen losses. Nature 396, 262-265.
Dupraz, P., 1997. La spécialisation des exploitations agricoles: changements techniques et prix des facteurs. Cahiers d’Économie et Sociologie Rurales 45, 93-122.
Edwards-Jones, G. and Howells, O., 2001. The origin of inputs to crop protection in organic farming systems: are they sustainable?. Agricultural Systems 67, 31-47.
European Commission, 1997. Data Definitions and Instructions for the FADN Farm Return. Community Committee for the Accountancy data Network, RI/CC 1256 Prov.
European Commission, 1998. Definition of Variables Used in FADN Standard Results. Community Committee for the Accountancy data Network, RI/CC 882 Rev. 6.
European Commission, 2002. Analysis of the possibilities of a European Action plan for organic food and farming. Commission Staff Working Paper, SEC1368.
European Commission, 2005. Europeans and the Common Agricultural Policy. Special Eurobarometer, 221/Wave 622 – TNS Opinion and Social.
Gil, J.M., Gracia, A. and Sánchez, M., 2000. Market segmentation and willingness to pay for organic products in Spain. International Food and Agribusiness Management Review 3, 207-226.
Haberl, H., Wackernagel, M., Krausmann, F., Erb, K. and Monfreda, Ch., 2004. Ecological footprints and human appropriation of net primary production: a comparison. Land Use and Policy 21, 279-288.
Hopkins, J.A. and Heady, E.O., 1982. Contabilidad y Control de Explotaciones Agrícolas. Reverté, Barcelona.
Hornbaker, R.H. Dixon, B.L. and Sonka, S.T., 1989. Estimating production activity costs for multioutput firms with a random coefficient regression model. American Journal of Agricultural Economics, 71 (1), 167-177.
Hsiao, Ch., 2005. Analysis of panel data. Cambridge University Press, Cambridge.
Kerselaers. E., De Cock, L., Lauwers, L. Van Huylenbroeck, G., 2007. Modelling farm-level economic potential for conversion to organic farming. Agricultural Systems 94, 671-682. Kurosaki, T., 1997. Production risk and advantages of mixed farming in the Pakistan Punjab.
The Developing Economics. XXXV (1), 28-47.
Lansink, A. O. and Jensma, K., 2003. Analysing profits and economic behaviour of organic and conventional Dutch arable farms. Agricultural Economics Review 4(2), 19-31.
Lansink, A.O., Pietola, K. and Bäckman, S., 2002. Efficiency and productivity of conventional and organic farms in Finland 1994-1997. European Review of Agricultural Economics, 29(1), 51-65.
Lund, V., Hemlin, S. and Lockeretz, W., 2002. Organic livestock production as viewed by Swedish farmers and organic initiators. Agriculture and Human Values 19, 255-268. Mathews, M.R., 1997. Twenty-five years of social and environmental accounting research. Is
there a silver jubilee to celebrate?. Accounting, Auditing & Accountability Journal 10 (4), 481-531.
Matson, P.A., Parton, W.J., Power, A.G. and Swift, M.J., 1997. Agricultural intensification and ecosystems properties. Science 277, 504-509.
Melfou, K. and Papanagioutou, E., 2003. Total factor productivity adjusted for a detrimental input. Agricultural Economics Review 4(2), 5-18.
Mishra, A.K, El-Osta, H.S. and Steele, Ch.J., 1999. Factors affecting the profitability of limited resource and other small farms. Agricultural Finance Review 59 (0), 77-91.
Monfreda, C., Wackernagel, M. and Deumling, D., 2004. Establishing national natural capital accounts based on detailed Ecological Footprint and biological capacity assessments. Land and Use Policy 21, 231-246.
Offermann, F. and Nieberg, H., 2000. Economic perfromance of organic farms in Europe. University of Hohenheim, Stuttgart.
Omamo, S.W., 1998. Farm-to-market transaction costs and specialisation in small-scale agriculture: explorations with a non-separable household model. Journal of Development Studies 35 (2), 152-163.
Opschoor, H., 2000. The ecological footprint: measuring rod or metaphor?. Ecol. Econ. 32 (3), 363-365.
Popp, M. and Rudstrom, M., 2000. Crop enterprise diversification and specialty crops. Agricultural Finance Review 60 (0), 85-98.
Pretty, J.N., Brett, C., Gee, D., Hine, R.E., Mason, C.F., Morison, J.I.L., Raven, H., Rayment, M.D. and van der Bijl. G., 2000. An assessment of the total external costs of UK agriculture. Agricultural Systems 65, 113-136.
Pretty, J.N., Brett, C., Gee, D., Hine, R.E., Mason, C.F., Morison, J.I.L., Rayment, M.D. van der Bijl. G. and Dobbs, T., 2001. Policy challenges and priorities for internalizing the externalities of modern agriculture. Journal of Environmental Planning and Management 44(2), 263-283.
Pretty, J.N., Ball, A.S., Lang, T. and Morison, J.I.L., in press. Farm costs and food miles: an assessment of the full cost of the UK weekly food basket. Food Policy.
Rigby, D., and Cáceres, D., 2001. Organic farming and the sustainability of agricultural systems. Agricultural Systems 68, 21-40.
Rigby, D., Young, T. and Burton, M., 2001. The development of and prospects for organic farming in the UK. Food Policy 26, 599-613.
Schmitt, G., 1991. Why is the agriculture of advanced western economies still organized by family farms? Will this continue to be so in the future?. European Review of Agricultural Economics. 18, 443-458.
Spanish Ministry of Economics, 2001. Boletín Estadístico de Energía Eléctrica 34
(http://www.ree.es/apps/index_dinamico.asp?menu=/cap07/menu_sis.htm&principal=/cap 07/estadistico.htm)
Stöglehner, G., 2001. Ecological footprint – a tool for assessing sustainable energy supplies. Journal of Cleaner Production 11, 267-277.
Tilman, D., 1998. The greening of the green revolution. Nature 396 (19th november), 211-212. Trewavas, A., 1999. Much food, many problems. Nature 402 (18), 231-232.
Trewavas, A., 2001. Urban miths of organic farming. Nature 410 (22), 409-410.
Tzouvelekas, V. and Pantzios C. J., 2001. Economic Efficiency in Organic Farming: Evidence From Cotton Farms in Viotia, Greece. Journal of Agricultural & Applied Economics 33 (1), 35-48.
Van Kooten, G.C. and Bulte, E.H., 2000. The ecological footprint: useful science or politics?. Ecol. Econ. 32 (3), 385-389.
Wackernagel, M. and Rees, W., 1996. Our ecological footprint, reducing human impact on the Earth. New Society, Gabriola Island.
Wackernagel, M. and Silverstein, J., 2000. Big things first: focusing on the scale imperative with the ecological footprint. Ecol. Econ. 32 (3), 391-394.
Wackernagel, M., Onisto, L., Bello, P., Callejas, A., López, I.S., Méndez, J., Suárez, A.I. and Suárez Mª.G., 1999. National natural capital accounting with the ecological footprint concept. Ecol. Econ. 29 (3), 375-390.
SÈRIE DE DOCUMENTS DE TREBALL DE L'IEB
2000
2000/1 - Esteller, A.; Solé, A., "Vertical Income Tax Externalities and Fiscal Interdependence: Evidence
from the US"
2000/2 - Castells, A., "The role of intergovernmental finance in achieving diversity and cohesion: the
case of Spain"
2000/3 - Costa, M.T.; Segarra, A. (U. Rovira i Virgili); Viladecans, E., "Pautas de localización de las
nuevas empresas y flexibilidad territorial"
2000/4 - Costa, M.T.; Duch, N.; Lladós, J. (U. Autònoma de Barcelona), "Determinantes de la
innovación y efectos sobre la competitividad: el caso de las empresas textiles"
2000/5 - Solé, A., "Determinantes del gasto público local: necesidades de gasto vs. capacidad fiscal" 2000/6 - Barberán, R. (U. de Zaragoza); Bosch, N.; Castells, A.; Espasa, M., "The redistributive power
of the Central Government Budget"
2001
2001/1 - Espasa, M., "The territorial redistribution of the EU budget. Empirical evidence at national and
regional level"
2001/2 - Viladecans, E., "La concentración territorial de las empresas industriales: un estudio sobre la
unidad geográfica de análisis mediante técnicas de econometría espacial"
2001/3 - Castells, A., "La descentralización de las políticas sociales en el Estado del Bienestar"
2001/4 - Bosch, N.; Pedraja, F. (U. de Extremadura); Suárez-Pandiello, J. (U. de Oviedo), "The
influence of Environmental Variables in Measuring the Efficiency of Refuse Collection Services: An Application to the Spanish Municipalities"
2001/5 - Solé, A., "Budget spillovers in a metropolitan area: typology and empirical evidence"
2001/6 - Sanromà, E.; Ramos, R. (U de Barcelona i AQR), "Local human capital and external
economies: evidence for Spain"
2001/7 - Leonida, L. (U. della Calabria); Montolio, D., "Convergence and Inter-Distributional Dynamics
among the Spanish Provinces. A Non-parametric Density Estimation Approach"
2001/8 - García Quevedo, J., "University research and the location of patents in Spain"
2001/9 - Esteller, A.; Solé A., "Tax Setting in a Federal System: The Case of Personal Income Taxation
in Canada"
2001/10 - Durán J.M.; Gispert, C. de, "Fiscalidad medioambiental sobre la energía: propuestas para
España "
2001/11 - Álvarez, M., "España y la senda de desarrollo de la inversión directa: una aproximación"
2002
2002/1 - Bosch, N.; Espasa, M.; Sorribas, P., "La capacidad redistributiva y estabilizadora del
SÈRIE DE DOCUMENTS DE TREBALL DE L'IEB
2002/2 - García Quevedo, J., "The location of innovation. Universities and technological infrastructure
in Spain"
2002/3 - Viladecans Marsal, E., "The growth of cities: Does agglomeration matter?"
2002/4 - Pons Novell, J.; Tirado Fabregat, D.A. (U. de Barcelona), "Discontinuidades en el crecimiento
económico en el periodo 1870-1994: España en perspectiva comparada"
2002/5 - Bosch, N.; Espasa, M.; Sorribas, P., "The redistributive, stabiliser and insurance effects at
territorial level of "federal" government budgets"
2002/6 - Callejón, M. (U. de Barcelona); García Quevedo, J., "Las ayudas públicas a la I+D
empresarial. Un análisis sectorial"
2003
2003/1 - Solé Ollé, A.; Viladecans Marsal, E., "Fiscal and growth spillovers in large urban areas" 2003/2 - Gual, J. (IESE); Trillas, F., "Telecommunications Policies: Determinants and Impact"
2003/3 - Leonida, L. (U. Della Calabria); Montolio, D., “Public Capital, Growth and Convergence in
Spain. A Counterfactual Density Estimation Approach”
2003/4 - Álvarez, M., “FDI Determinant Factors: The Case of Catalan Multinational Manufacturing
Firms”
2003/5 - Álvarez, M., “Wholly-Owned Subsidiaries Versus Joint Venture: The Determinant Factors in
the Catalan Multinational Manufacturing Case”
2003/6 - Pelegrín, A., “Regional Distribution of Foreign Manufacturing Investment in Spain. Do
agglomeration economies matter?”
2004
2004/1 - Sánchez Hugalde, A., "Movilidad intergeneracional de ingresos y educativa en España
(1980-90)"
2004/2 - Esteller, A., "Tax Evasion in Interrelated Taxes"
2004/3 - Castells, A.; Esteller, A.; Vilalta, M., "Full Characterisation of the Political Economy of Fiscal
Adjustment: Evidence from Spanish Municipalities"
2004/4 - Lambert, P.J. (U. of York), "Income Taxation and Equity"
2004/5 - Bosch, N.; Solé, A., "Yardstick competition and the political costs of raising taxes: An empirical
analysis os Spanish municipalities"
2004/6 - Maggioni, M. (DISEIS i Catholic University of Milan), "The rise and fall of industrial clusters:
Technology and the life cycle of regions"
2004/7 - Frey, B.S. (Institute for Empirical Economic Research of the University of Zurich i CREMA); Torgler, B., (Yale Center for International and Area Studies i CREMA) "Taxation and Conditional
Cooperation"
2004/8 - Alonso, J. (U. de Vigo i RGEA); Freire-Serén, M.J. (U. de Vigo); Manzano, B. (U. de Vigo),
SÈRIE DE DOCUMENTS DE TREBALL DE L'IEB
2005
2005/1 - Arocena, P. (U. Pública de Navarra), "The measurement of scope, scale and diversification
economies: How (in)efficient is electricity restructuring and unbundling?"
2005/2 - Solé Ollé, A., "The effects of party competition on budget outcomes: Empirical evidence from
local governments in Spain "
2005/3 - Solé Ollé, A., "Expenditure spillovers and fiscal interactions: Empirical evidence from local
governments in Spain"
2005/4 - Jofre Monseny, J., "On the scope of agglomeration economies: Evidence from Catalan zip codes" 2005/5 - Esteller, A.; Solé, A., "Does decentralization improve the efficiency in the allocation of public
investment? Evidence from Spain"
2005/6 - Duch, N., "Vertical linkages, agglomeration and the organization of production in European
regions"
2005/7 – Simón, H.J. (Instituto de Economía Internacional i U. de Alicante); Ramos, R. (U. de Barcelona i
AQR); Sanromà, E. "Collective bargaining and regional wage differences in Spain: An empirical analysis"
2006
2006/1 - Sanromà, E.; Ramos, R. (U. de Barcelona i AQR): "Local human capital and productivity: An
analisys for the Spanish regions"
2006/2 – Pelegrín, A.; Bolancé, C. (U. de Barcelona i RFA-IREA): "Regional foreign direct investment
in manufacturing. Do agglomeration economies matter?"
2006/3 – Trillas, F.; Montolio, D.; Duch, N.: "Productive efficiency and regulatory reform: The case of
vehicle inspection services"
2006/4 – Garrido Torres, A.; Arqué Castells, P.: "La elección de entidad bancaria: Factores
determinantes"
2006/5 – Arauzo-Carod, J.M. (U. Rovira i Virgili I Grup de Recerca d’Indústria i territori); Viladecans-Marsal, E.: "Industrial location at the intra-metropolitan level: A negative binomial approach"
2006/6 – García Quevedo, J.; Mas Verdú, F. (U. Politécnica de Valencia): "El uso de las PYMEs de
servicios intensivos de conocimiento. Factores relacionados e implicaciones de política"
2006/7 – Sorribas-Navarro, P.: "Determinants and effects of central governments bailout-grants:
Evidence for the Spanish regions"
2007
2007/1 – Durán Cabré, J.Mª.; Esteller Moré, A.: "An empirical analysis of wealth taxation: Equity vs.
tax compliance"
2007/2 – Jofre-Monseny, J.; Solé-Ollé, A.: "Tax differentials and agglomeration economies in
intraregional firm location"
2007/3 – Duch, N.; Montolio, D.; Mediavilla, M.: "Evaluating the impact of public subsidies on a firm’s
SÈRIE DE DOCUMENTS DE TREBALL DE L'IEB
2007/4 – Sánchez Hugalde, A.: "Influencia de la inmigración en la elección escolar"
2007/5 – Solé-Ollé, A.; Viladecans-Marsal, E.: "Economic and political determinants of urban
expansion: Exploring the local connection"
2007/6 – Segarra-Blasco, A.; García-Quevedo, J.; Teruel-Carrizosa, M.: "Barriers to innovation and
public policy in Catalonia"
2007/7 – Calero, J.; Escardíbul, J.O.: " Evaluación de servicios educativos: El rendimiento en los
Universitat de Barcelona
Facultat de Ciències Econòmiques i Empresarials
C/ Tinent Coronel Valenzuela, 1-11 08034 Barcelona
Tel.: +34 93 403 46 46 Fax: +34 93 403 72 42 E-mail: [email protected]