DIGITAL MODELING FOR ARCHITECTURAL KNOWLEDGE giugno 2011 ISSN 1828-5961 30 | DISEGNARECON
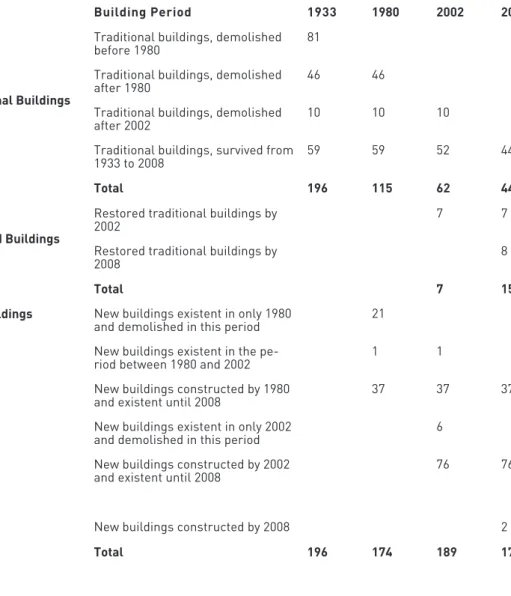
Turgay Kerem Koramaz PhD in urban and regional plan-ning; MSc. in urban design; BSc. in urban and regional planning. He is a research assistant in the Faculty of Architecture, ITU. His research interests are urban conservation and design, spatial analysis, and information systems in planning.
Indagine sull’utilizzo delle tecniche di visualizzazione 2D e 3D
che rappresentano il cambiamento del paesaggio urbano storico
Users’ Responses to 2d and 3d Visualization Techniques,
Representing the Change in The Historic Townscape
Al fine di descrivere il cambiamento del paesaggio urbano di siti riferiti alla città, gli strumenti moderni di visualizzazione possono essere utilizzati per aumentare le possibilità di rappresentazione, in misura maggiore rispetto ai metodi tradizionali. Studi recenti di conservazione ed interventi effettuati hanno indicato un cambiamento significativo nel paesaggio urbano storico di Zeyrek: questo articolo presenta le possi-bilità di rappresentazione insite nella tec-nica di mappatura bidimensionale e nella realizzazione di un modello tridimensiona-le del comparto, utilizzati nella definizio-ne del cambiamento del paesaggio urbano. Per valutare l’effettiva capacità di rappre-sentazione per mezzo di risposte da parte degli utenti dei modelli, è stato sottoposto un questionario agli studenti di laurea spe-cialistica della Facoltà di Architettura, ai
professionisti in enti di pianificazione e di conservazione ed agli studenti delle scuo-le superiori. A conclusione principascuo-le dello studio, si è compreso come il cambiamento del paesaggio urbano sia definito meglio nel modello urbano tridimensionale che nel-la tecnica di mappatura bidimensionale, in termini di rappresentazione dei dettagli ar-chitettonici e delle caratteristiche struttu-rali del luogo.
In order to represent change in the town-scape of urban sites, innovative visualiza-tion tools may enhance more capabilities than conventional ones. While recent con-servation studies and interventions indica-ted a significant change in the Zeyrek Urban Historic Site, the motivation for this paper came from the representative capability of
2D mapping techniques and 3D urban mo-dels to define the change in a townscape. A questionnaire was conducted to measure this capability by means of users’ respon-ses from graduate students in the Faculty of Architecture, professionals in planning and conservation institutions, and high school students. It was concluded that the changes in townscape was defined better than when familiar with the 2D mapping technique by the 3D urban model in terms of representa-tion of architectural details and structural characteristics of the site.
Nuran Zeren Gülersoy PhD and MSc. - Arch in urban plan-ning; BSc. - Arch in Architecture. Professor at the Faculty of Archi-tecture, ITU; she is the Head of ITU Urban and Regional Planning and Research Center; and President of the Europa Nostra - Turkey Board. Her research interests are urban planning and design, urban con-servation and physical design of open spaces.
ISSN 1828-5961
necessary to improve the tasks of 3D urban models as an active communication tool in-tegrated with definition of transformation in historic townscapes.
The number of studies concerning the inve-stigation of user groups’ responses for 3D vi-sualization techniques in urban planning and architectural design process have been incre-asing recently (Day, 2002). These investigative studies used various cognition measurement methods including how professionals and non-professionals described the virtual en-vironment. Most of the studies which aimed to systematically describe the perceived envi-ronment mostly use a semantic (meaning) me-asurement scale (Bates Brkljac, 2007; Neto, 2001; Westerdahl et al., 2006; Houtkamp and Oostendorp, 2007). In brief, 3D urban models were stated in these methodological studies, as being accurate and reliable 3D visualiza-(Bertol, 1997). As a design tool, 3D urban
mo-dels become a more powerful means to show and evaluate the change in urban pattern over time (Al-Kodmany, 2002). Computer based 3D urban models were more prevalent tools to represent the real environment, rather than the conventional visualization techniques As the fundamental function of 3D urban mo-dels, namely communication and interaction, function facilitated the participation and col-laboration processes in urban planning and conservation. Therefore these models also developed learning skills (Hamilton et al., 2001) and cognitive and perceptive abilities of users and stakeholders (Westerdahl et al., 2006). The efficiency of visualization techni-ques can be examined by the comprehension, cognition and evaluation processes of users and different interest groups in urban plan-ning and conservation. This examination is Throughout the urban conservation process,
analysis of the townscape and physical envi-ronment of urban historic sites were signifi-cantly important enough to be examined in a detailed and comprehensive framework. For that reason urban conservation studies came to require the utilization of three-dimensio-nal (3D) representation techniques. The most common planning studies were developed by familiar with two-dimensional (2D) analysis, but such techniques may not be sufficient to evaluate townscape characteristics. This pa-per was held during a case study of the Zeyrek Urban Historic Site which was accomplished with a definition of change in historic town-scape by 2D and 3D visualization techniques. Visualization and representation techniques in the case study was then compared to deter-mine the efficiency of these techniques with subjective responses from different interest groups in a questionnaire.
Townscape, as the main theme of this paper was defined as a physical environment that was perceived on the third dimension of ur-ban space. Townscape, as a term, expres-sed not only the actual composition of urban landscape, environment and sense of place but also the comprehensive definition of the changes in the built environment (Burke, 1976 and Cullen, 1971). Representing change in the townscape has become significantly important throughout the urban planning process as a means to gain better comprehension regar-ding urban change. Innovative visualization and representation tools may also facilitate a comprehension in the changes experienced by urban historic sites.
3D urban models, which were defined as one of the visualization techniques in urban plan-ning and design, have provided efficient com-munication and have allowed the visualiza-tion of more spatial content and informavisualiza-tion than the conventional 2D mapping techniques (Pietsch, 2000). CAD (computer aided design) software was conventionally utilized to gene-rate 3D models as a last visualization tool in urban planning and design. This was mostly to evaluate the spatial characteristics of ac-tual urban structure and design proposals
Users’ Responses to 2d and 3d Visualization Techniques
giugno 2011 ISSN 1828-5961
32 | DIGITAL MODELING FOR ARCHITECTURAL KNOWLEDGE
DISEGNARECON DIGITAL MODELING FOR ARCHITECTURAL KNOWLEDGE | 32
Representation & design for cultural heritage
|
Horn. As it is included on the World Herita-ge List, the Zeyrek Urban Historic Site was chosen as the case area because it reflects a variety of cultural structures in its urban space. The most important monument of the site is the Zeyrek Mosque which had been the Monastery of Christ Pantokrator during the Byzantine Period (Fig. 1). Zeyrek has a traditional organic pattern consisting of au-thentic, wooden, Turkish houses (Gülersoy et al., 2008) (Fig. 2 and 3).
The case study was mainly based on the Zeyrek Conservation Development Plan that was prepared by Gülersoy et. al. (2001). With the help of this plan, cultural monuments and the present townscape were documen-ted by gathering facade plans, photographs, drawings, and other visual materials that are vitally important. Changes in the hi-storic townscape of Zeyrek Urban Hihi-storic sented the real environment (Westerdahl
et al., 2006). In addition, the SMB scale can efficiently be used in either built environ-ments or representation tools and visualiza-tion techniques such as sketches, collages, 3D models, films or TV techniques (Küller, 1991). For all these reasons, SMB scale was chosen in this study to compare users’ re-sponses for 2D and 3D visualization techni-ques conducted as representations of the Zeyrek Urban Historic Site.
CHANGE IN HISTORIC TOWNSCAPE OF ZEYREK This paper discussed the Zeyrek Urban Hi-storic Site as the case area, with its chan-ge in historic townscape offering a means of comparing the efficiency of 2D mapping technique and the 3D urban model. Zeyrek is located north of the Historical Peninsula of Istanbul, on the slopes, viewing Golden tion techniques that could define more
at-tributes in spatial content. These models improved the user’s perception regarding the representation of physical and townsca-pe characteristics and enhanced the com-munication and interaction of spatial infor-mation among user groups to develop urban planning and conservation applications in collaborative planning approach.
In describing how users experience their en-vironment, the first semantic measurement scale study, by Osgood, Suci and Tannen-baum (1957), was titled “The Measurement of Meaning”. Osgood and his colleagues asked respondents sets from a large num-ber of adjectives to describe various context and terms. Then the seven-step scaled an-swers were factor-analysed to cluster these adjectives into seven dimensions as, eva-luation, potency, activity, stability, tautness, novelty and receptivity.
As the second study, titled “A semantic mo-del for describing perceived environment”, written by Küller (1972) aimed to measure and describe the experiences of built envi-ronments systematically. Küller criticized Osgood, Suci and Tannenbaum’s study as being limited in measuring the perception of built environments. In the semantic en-vironmental scale (SMB from Swedish ‘‘se-mantisk miljö beskrivning) Küller also used the same methodology to factor-analyze the seven-step scaled answers. However in this study, the respondents were asked to descri-be not the context or terms but the images from real environment and living spaces. To describe the experience of respondents in a built environment, Küller comprised eight dimensions or factors as pleasantness, com-plexity, unity, enclosedness, potency, social status, affection and originality.
In order to investigate the efficiency of 3D urban models, Osgood, Suci and Tannen-baum’s semantic differential scale was mo-stly used to compare these techniques with functions such as, accuracy, realism and abstraction. But Küller’s SMB scale attai-ned a more favorable comparison with re-gard to what extent these techniques
repre-Users’ Responses to 2d and 3d Visualization Techniques Turgay Koramaz, Nuran Gülersoy |
ISSN 1828-5961
Site were defined within the period betwe-en 1933 – 2008. The 1933 Pervititich Map had a special importance, because this map gave useful information related to urban patterns, built-up areas, unoccupied areas, road patterns, building materials and buil-ding heights in 1933 which was first stage in the period of change in the Zeyrek Urban Historic Site (Fig. 4).
First inventory and registration studies for conservation of the Zeyrek Urban Historic Site, which were conducted by the Istan-bul (No.1) Board of Protection for Cultural and Natural Assets, were held in the period between 1977 - 1980. These inventory stu-dies were prepared to establish a registra-tion framework for listed buildings to be included in urban conservation as civil and monumental architecture. Registration do-cuments contained maps, photographs and detailed information regarding the urban historic values of the sites and monuments
4. Zeyrek Urban Historic Site in Pervititich Map, 1933.
giugno 2011 ISSN 1828-5961
34 | DIGITAL MODELING FOR ARCHITECTURAL KNOWLEDGE
DISEGNARECON
(Istanbul No.1, Board of Protection for Cul-tural and NaCul-tural Assets, 1977) (Fig. 5). Through the change in the historic townscape of Zeyrek Urban Historic Site, the third stage was based on the data, conducted from the master thesis “Three-Dimensional Evaluation in Urban Conservation Applications Based on Computer Aided Design” (Koramaz, 2002). This study contained a number of urban survey and analyses, conducted by computer based 3D urban model. The evaluation of three-dimen-sional effects throughout this study was deve-loped in order to indicate that urban conser-vation studies could be accomplished not only with 2D mapping techniques, but also with innovative 3D visualization techniques. Town-scape analysis was generated in this study to investigate, the structural form and relation-ships, visual quality, accessibility and harmo-ny characteristics of the Zeyrek Urban Historic Site.
The last stage of the period for defining
hi-5. Inventory studies by Istanbul (No.1) Board of Protection for Cultural and Natural Assets in 1980.
Users’ Responses to 2d and 3d Visualization Techniques Turgay Koramaz, Nuran Gülersoy |
ISSN 1828-5961
Table 1. Number of traditional, restored and new buildings in the period between 1933 - 2008
storical change was 2008. The survey and analyses, conducted in 2002, were updated by the help of onsite survey in 2008 (Koramaz, 2009). The same survey and analyses were carried out with the same titles as conventio-nal aconventio-nalyses and townscape aconventio-nalyses. In the conventional analyses of the Zeyrek Urban Historic Site, parameters were described in general consideration of urban analysis. The-se analyThe-ses were conventionally generated in 2D mapping in most of the urban planning and conservation studies and projects. However, each analysis was improved by having both visualization techniques; 2D mapping tech-nique and 3D urban models such as building use, building condition, construction material, built and inbuilt-up areas, and listed buil-dings. Within the title of townscape analysis, the relationship between each component’s structural and visual characteristics, privacy and permeability levels in accordance with street pattern and appropriateness with tradi-tional architectural characteristics were also examined. Townscape analysis provided to be an effective evaluation method by developing a computer based 3D urban model, while these analyses indicated whether the buildings pre-served their traditional characteristics or not. Changes in the historic townscape of Zeyrek were then defined with numbers in accordan-ce with the documents and records from re-spectively 1933, 1980, 2002 and 2008 (Table 1). All the records, maps and photographs were overlapped with the recent up-to-date map, and buildings were investigated on the site. When we considered the changes in townsca-pe, the most important shift was observed to occur during the 1980s when 81 traditional buildings were demolished. 196 buildings were documented in the 1933 Pervititich Map, but by 2008 there were only 44 buildings which had survived. Some of these buildings are pre-sented in Figure 7. After 2000s, the site be-gan to be restored. There were 7 traditional buildings in 2002 and additional 8 restoraed buildings in 2008. Some examples of restored buildings are shown in Figure 8. The Zeyrek Mosque had become a significant example of restoration project by 2010 (Fig. 1).
Type Building Period 1933 1980 2002 2008
Traditional Buildings
Traditional buildings, demolished
before 1980 81
Traditional buildings, demolished
after 1980 46 46
Traditional buildings, demolished
after 2002 10 10 10
Traditional buildings, survived from
1933 to 2008 59 59 52 44
Total 196 115 62 44
Restored Buildings
Restored traditional buildings by
2002 7 7
Restored traditional buildings by
2008 8
Total 7 15
New Buildings New buildings existent in only 1980
and demolished in this period 21 New buildings existent in the
pe-riod between 1980 and 2002 1 1
New buildings constructed by 1980
and existent until 2008 37 37 37
New buildings existent in only 2002
and demolished in this period 6
New buildings constructed by 2002
and existent until 2008 76 76
New buildings constructed by 2008 2
Total 196 174 189 174
giugno 2011 ISSN 1828-5961
36 | DIGITAL MODELING FOR ARCHITECTURAL KNOWLEDGE
DISEGNARECON
Analyses based on changes in the historic townscape were not only evaluated in num-bers but also visualized firstly by 2D map-ping technique, then by a 3D computer ba-sed urban model (Koramaz and Gülersoy, 2010) (Fig. 6). The computer that was used to produce 3D urban model and maps, was an Intel Centrino Duo that was running at 1,66 GHz ,contained 1 GB RAM and supported the GeForce 8400M GS. The 3D modeling of the existing townscape was generated by Auto-CAD 2004©. By block modeling in the Auto-CAD system, a 3D urban model was transformed into the VRML format to produce an anima-ted model to create for immersive virtual environment. According to the aim of this study, both 3D model and 2D mapping tech-niques constituted the base of survey studies in historic evolution of the site. Both the 2D mapping technique and the 3D model had the same physical elements which were formed with buildings, tombs and religious buildings as monumental buildings and finally streets. METHODOLOGY
While recent conservation studies and inter-ventions in the Zeyrek Urban Historic Site in-dicated a significant change in urban historic characteristics, the motivation for this paper came from the capability of 2D and 3D visuali-zation techniques in definition of this change. These visualization techniques were 2D con-ventional mapping and a 3D urban model, ge-nerated by means of historic documents, ima-ges and inventories. A questionnaire study was held in 2008 to gather responses from users; respectively graduate students in thr Facul-ty of Architecture, professionals in planning and conservation institutions, and high school students in the site as the representatives of the inhabitants. The users’ responses were investigated and assessed in quantitative me-thods with descriptive statistics in order to measure how efficiently the change in historic townscape was perceived and comprehended by means of both visualization techniques. Questionnaire mainly consisted of three sec-tions, the comprehension level of townsca-pe analysis, the cognition level of the urban
6. Change in historic townsca-pe in Zeyrek urban historic site (Koramaz and Gülersoy, 2010).
Users’ Responses to 2d and 3d Visualization Techniques Turgay Koramaz, Nuran Gülersoy |
ISSN 1828-5961
historic environment, and the perception of semantic environmental scale components. Each separate group answered the same to-pics, covering the extent of how they com-prehended and perceived each figure and il-lustration and how they perceived the site in the components of the SMB. All questions in the questionnaire were conducted in a seven-level Likert scale with 1: “poor” and 7: “ex-cellent”. Within the purpose of this paper, responses for the questions related to chan-ge and cognition of townscape in the historic environment were presented. The results of chosen questions listed below were mainly the ones related to change and the cognition of the historic townscape.
In the first section of the questionnaire, re-spondents were asked to describe their com-prehension level for townscape analyses in the Zeyrek Urban Historic Site. While answe-ring those questions, the related slide was presented to the respondents. The second section of the questionnaire was mainly based on the cognition level of the historic townsca-pe. The third section described respondents’ own perception level on the SMB components of pleasantness, complexity, unity, enclosed-ness, potency, social status, affection and originality (Table 2).
Both of the questionnaires concerning the evaluation of users’ responses for 2D and 3D visualization techniques were conducted after the presentations. The presentations and questionnaires were held in a meeting room in the faculty. Presentations were made by projecting the presentations on a wall of the room. Respondents watched a 10 minute presentation which consisted of the schemes and analysis, representing the Zeyrek Urban Historic Site. Respondent groups the com-pleted the same questionnaire forms in order to evaluate the visualization technique which had been presented.
230 respondents in two groups completed the questionnaire. 120 respondents in the profes-sional group and 110 respondents in the non-professional group took part in the presenta-tions and questionnaire study. The professional group consisted of graduate students in
Istan-7. Traditional buildings in historic townscape of Zeyrek Urban Historic Site.
giugno 2011 ISSN 1828-5961
38 | DIGITAL MODELING FOR ARCHITECTURAL KNOWLEDGE
DISEGNARECON
bul Technical University, Faculty of Architecture and professionals in planning and conservation institutions in Istanbul. The non-professional group consisted of students from two high schools, which were within walking distance (500 m) of the Zeyrek Urban Historic Site. The respondents’ ages in the professional group ranged from 21 to 53 years, with an average of 28,19 years (S.D.=5.221, median 27). The respondents’ ages in the non-profes-sional group ranged from 14 to 19 years, with an average of 16,44 years (S.D.=1.026, median 17).The respondents assessed the 2D map-ping technique and the 3D urban model in se-parate groups after sese-parate presentations. The first group of 115 respondents evaluated 2D mapping technique in the experiment and the second group of 115 respondents evalua-ted the 3D urban model in the experiment. In the professional group (n:120), 104 respon-dents (52 in the first group, and 52 in the second group) stated they were familiar with computer aided design software programs (AutoCAD, Ar-chiCAD, AllPlan etc). 42 respondents (20 in the first group, and 22 in the second group) stated they were familiar with GIS software programs (ArcGIS). 41 respondents (19 in the first group, 22 in the second group) stated that they were familiar with 3D modeling software (3D Max, 3D Viz, etc). Between the professional respondent groups, no statistically significant differences were found for the variables of education and computer experience.
RESULTS
Results according to responses from respon-dent groups were examined regarding to questionnaire form by means of a statistical software package, SPSS 17.0©. Responses from the professional and non-professional respondents, and the first and second groups, were compared with a T-test to examine the equality of means. As the first group evaluated the presentation with the 2D mapping techni-que and the second group evaluated the 3D urban model, a comparison was assembled in order to measure the difference between these presentations in terms of delivering in-formation for change in the historic
townsca-8. Restored buildings and urban façade in historic townscape of Zeyrek Urban Historic Site.
Users’ Responses to 2d and 3d Visualization Techniques Turgay Koramaz, Nuran Gülersoy |
ISSN 1828-5961
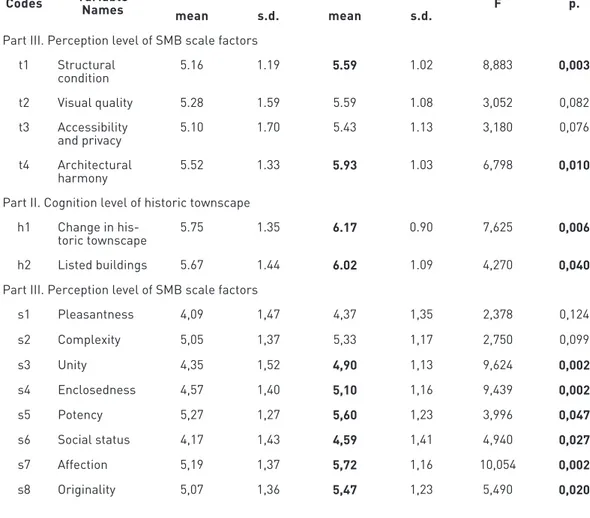
pe in Zeyrek. Overall, all of the mean values from the second group were larger than the mean values from the first group. However, T-test significance indicated that the statisti-cally significant mean differences existed in all except one questionand in three questions in the 90% confidence interval (Table 3). The group mean values from the second group, in the comprehension and cognition variables of structural condition (t1), architectural har-mony (t4), change in historic townscape (h1), listed buildings (h2), were significantly (95% confidence interval) higher. But the other two variables of visual quality (t2) and accessibi-lity and privacy (t3) were significant at a 90% confidence interval (t2; p = 0.082 and t3; p = 0.076). As the most distinctive SMB compo-nents, sense of unity (s3), enclosedness (s4) and affection (s7) (p = 0.002; F values were in highest absolute values respectively as 9,624, 9,439, and 10,054) were better determined by the 3D urban model than by the 2D mapping technique. The variable of h1 which referred to cognition of change in the historic townscape (mean value = 5.75 in the first group and mean value = 6.17 in the second group) were also de-fined better in the 3D urban model than in the 2D mapping technique (F = 7,625; p = 0.006). Two groups’ means and standard deviations for SMB factors were also presented with their significance levels in Table 3. The hi-ghest difference between the responses for 2D and 3D visualization techniques was for sense of affection (s7). The mean values of all components were higher for the second group, to whom the 3D urban model was pre-sented. In accordance with the responses for the unity factor (s3) and enclosedness factor (s4), the 3D model was definitely a better tool to represent how well all the various parts of the historic townscape fit together into a co-herent and functional whole with high level of sense in spatial enclosure and demarcation than the 2D mapping technique. The sense of affection factor was also responded to in fa-vor of 3D urban model in that the quality of recognition, giving rise to a sense of familia-rity, was successfully comprehended regar-ding the age of the environment. Responses
Questions in the Survey Codes Variable Names
Part I. Comprehension level of townscape analyses. To what extent can…
1. analysis of structural condition define the
site? t1 Structural condition
2. analysis of visual quality define the site? t2 Visual quality 3. analysis of accessibility and privacy define
the site? t3 Accessibility and privacy
4. analysis of architectural harmony define
the site? t4 Architectural harmony
Part II. Cognition level of historic townsc-apeTo what extent do you perceive…
5. change in historic townscape? h1 Historical evolution
6. listed buildings in the site? h2 Listed buildings
Part III. Perception level of SMB scale factor-sTo what extent do you perceive…
7. an environmental quality of being pleasant
and secure? s1 Pleasantness
8. a degree of variation or intensity, contrast
and abundance? s2 Complexity
9. a coherent whole in which various parts of
environment fit together? s3 Unity
10. a sense of spatial enclosure and
demar-cation? s4 Enclosedness
11. an expression of power in the
environ-ment and its various parts? s5 Potency
12. an expression of social status
represent-ing the built environment? s6 Social status
13. a sense of affection regarding quality in
historic environment? s7 Affection
14. a sense of originality with surprising
ele-ments in the environment? s8 Originality
Table 2. Definition of variables.
giugno 2011 ISSN 1828-5961
40 | DIGITAL MODELING FOR ARCHITECTURAL KNOWLEDGE
DISEGNARECON
Table 3. Comparison of 2D and 3D visualization techniques.
Question response format was seven-step scale from 1 to 7 and signi- ficant (p<0.05) highest mean values for each variable are printed in bold (s.d.=standard deviation, t=statistics, p=significance values). Codes Variable Names 1. Group, 2D n: 115 2. Group, 3D n: 115 F p.
mean s.d. mean s.d.
Part III. Perception level of SMB scale factors t1 Structural condition 5.16 1.19 5.59 1.02 8,883 0,003 t2 Visual quality 5.28 1.59 5.59 1.08 3,052 0,082 t3 Accessibility and privacy 5.10 1.70 5.43 1.13 3,180 0,076 t4 Architectural harmony 5.52 1.33 5.93 1.03 6,798 0,010
Part II. Cognition level of historic townscape h1 Change in
his-toric townscape 5.75 1.35 6.17 0.90 7,625 0,006
h2 Listed buildings 5.67 1.44 6.02 1.09 4,270 0,040
Part III. Perception level of SMB scale factors
s1 Pleasantness 4,09 1,47 4,37 1,35 2,378 0,124 s2 Complexity 5,05 1,37 5,33 1,17 2,750 0,099 s3 Unity 4,35 1,52 4,90 1,13 9,624 0,002 s4 Enclosedness 4,57 1,40 5,10 1,16 9,439 0,002 s5 Potency 5,27 1,27 5,60 1,23 3,996 0,047 s6 Social status 4,17 1,43 4,59 1,41 4,940 0,027 s7 Affection 5,19 1,37 5,72 1,16 10,054 0,002 s8 Originality 5,07 1,36 5,47 1,23 5,490 0,020
for potency factor (s5) and social status (s6) reported that sense of power in townscape and evaluation of the built environment in so-cio-economic terms were efficiently expres-sed in terms of maintenance, as depicted by the 3D urban model.
As less-significance levels occurred between the two groups, it was reported that signifi-cance values were on the level more than 0,05 which were not statistically significant. Howe-ver, the least distinctive results were those of pleasantness (s1) and complexity (s2) which had the lowest mean difference (the significan-ce levels were respectively as p = 0,124 and p = 0,099) when compared to other SMB factors. The pleasantness factor determined the re-presentation of environmental quality of being pleasant, beautiful and secure and complexity factor determined the degree of variation or intensity, contrast and abundance in the built environment. These two factors were directly related to aging and deterioration in the histo-ric townscape. The reason for the insignificant responses for pleasantness (s1) and comple-xity (s2) factors was that the 3D urban model did not represent the urban historic site in realistic detail by neglecting corrosions and the deterioration of the urban façades for the purpose of abstraction. The 3D urban model in this study was reported as less capable of representing real urban environment in these SMB factors (only s1 and s2) because of not having material or texture characteristics on façades with a realistic rendering function. CONCLUSION
In conclusion, the 2D mapping technique was less capable of creating sense of affection in representation of change in the historic town-scape than the 3D urban model. On the con-trary, the 3D urban model was more capable of representing townscape characteristics, including structural condition, visual quality and traditional listed buildings than the 2D mapping technique. The most distinctive fin-dings were also reported by comparing the re-sults from professional and non-professional groups (Koramaz and Gülersoy-Zeren, 2009a). In accordance with the responses from
plan-Users’ Responses to 2d and 3d Visualization Techniques Turgay Koramaz, Nuran Gülersoy |
ISSN 1828-5961
planning process, Environment and Planning B: Planning and Design, 28(6) pp. 833-845. Houtkamp, J. and van Oosten-dorp, H., 2007. Virtual Van-dalism: The Effect of Physical Incivilities on the Affective Ap-praisal of 3D Urban Models. In: “11th International Conference Information Visualization” (IEEE, IV’07), 10.1109/IV.2007.74 pp 559-566.
Koramaz, T.K., 2002. Three Di-mensional Evaluation of Urban Conservation Applications by Means of Computer Based Sy-stems (MSc Dissertation), ITU, Institute of Science and Tech-nology, Urban Design Master Program, Istanbul, Turkey. Koramaz, T.K., 2009. Investi-gation of User’s Perception Regarding the Efficiency of Visualization Techniques in Ur-ban Conservation Process (PhD Dissertation), ITU, Institute of
Science and Technology, Urban and Regional Planning PhD Pro-gram, Istanbul, Turkey. Koramaz, T.K., and Gülersoy-Zeren, N., 2009: Comparison Between Users’ Responses for Static 3D Model and VR Appli-cation in Zeyrek Urban Historic Site. In: “22nd CIPA Sympo-sium”, (published in electronic format http://cipa.icomos.org/ t e x t % 2 0 f i l e s / K Y O T O / 9 4 . p d f ) , Kyoto, Japan.
Koramaz, T.K., and Gülersoy-Zeren, N., 2009. Evaluation of Users’ Responses for 3D Urban Model in Urban Conservation Process, “A|Z, ITU Journal of Faculty of Architecture”, 6(2) pp. 1-19, ITU, Faculty of Architectu-re, Istanbul, Turkey.
Koramaz, T.K., and Gülersoy-Ze-ren, N., 2010. 3D Visualization of Transformation in Historic Townscape: Case of Zeyrek Ur-ban Site. In: “14th IPHS
Confe-ning and conservation professions, the most important features of the 3D urban models’ were:
- Explanation ability of conservation project and interventions to structural and visual quality of urban historic environments, - Representation ability of change in the hi-storic townscape of urban environments, - Improvement of the cognition and percep-tion levels of urban historic environments with the creation of spatial unity, enclosed-ness and affection sense.
As the non-professional group, high school students responded especially to one of the three features of the 3D urban model above. In accordance with high school students’ sense of affection to urban historic environment, the 3D urban model was efficient in representing the urban pattern whether it maintained ar-chitectural vernacular characteristics or not.
REFERENCES
Al-Kodmany, K., 2002. Visua-lization Tools and Methods in Community Planning: From Fre-ehand Sketches to Virtual Reali-ty. “Journal of Planning Litera-ture”, 17(2) pp. 189-211. Bates-Brkljac, N., 2007. Inve-stigating perceptual responses and shared understanding of architectural design ideas when communicated through diffe-rent forms of visual represen-tations. In “11th International Conference Information Visuali-zation”, (IEEE, IV’07), 10.1109/ IV.2007.74 pp 348-353. Bertol, D., 1997. Designing Di-gital Space, an architect’s guide to virtual reality, John Wiley & Sons Inc., New York, USA. Burke, G., 1976, Townscapes. Pelican Books Ltd., Middlesex. Cullen, G., 1971, The Concise
Townscape, Van Nostrand Rein-hold, New York.
Day, A., 2002. Urban visua-lization and public inquiries: the case of the Heron Tower, London, Architectural Research Quarterly, 6(4) pp. 363-372 Gülersoy-Zeren, N., Tezer, A., Yigiter, R., 2001. A Study in Conservation: Zeyrek, Istanbul Technical University, Istanbul, Turkey.
Gülersoy-Zeren, N., Tezer, A., Yigiter, R., Koramaz, T.K., and Günay, Z., 2008. Istanbul Project: Istanbul Historic Peninsula Con-servation Study; Zeyrek, Suley-maniye and Yenikapi Historic Di-stricts, Volume 2: “Zeyrek Case”, Istanbul Technical University, Istanbul, Turkey.
Hamilton, A., Trodd, N., Zhang, X., Fernando, T. and Watson, K., 2001: Learning through visual systems to enhance the urban
rence, Urban Transformation: Controversies, Contrasts and Challenges”, ITU, Faculty of Architecture - Planning and Environment Research Center, Taskisla, vol. 2, pp. 359 – 371, Istanbul, Turkey.
Küller, R., 1991. Environmental assessment from a neuropsy-chological perspective. In: T. Gärling, G.W. Evans (Eds.), “En-vironment, Cognition and Ac-tion: An Integrated Approach”, Oxford University Press, New York, 1991, pp. 111-147. Küller, R., 1972. A semantic model for describing perceived environment. Document No. 12:1972, National Swedish In-stitute for Building Research, Stockholm, Sweden.
Neto, P.L., 2001. Evaluation of an urban design project: imagery and realistic computer models. Envi-ronment and Planning B: Planning and Design, 28(5) pp. 671-686
As reported in the study, the significant dif-ferences, termed as structural condition, architectural harmony and listed traditional buildings, were also those concerning the representation capability of change in the historic townscape by 3D visualization tech-niques. The study also indicated that another distinctive parameter was the cognition level of townscape characteristics of the urban hi-storic site which is explicitly explained as the purpose of the study.
As semantic environmental scale (SMB) fac-tors were significantly discriminated in two visualization techniques, these factors were efficiently stated as a validated measurement scale for comparing users’ responses for 2D and 3D visualization techniques (Koramaz, T.K. and Gülersoy-Zeren, N., 2009b). The re-sults indicated also the fact that user groups commonly gave higher scores to the 3D
ur-Osgood, C., Suci, G. and Tan-nenbaum, P., 1957. The Measu-rement of Meaning, University of Illinois Press, Urbana, USA. Pietsch, S.M., 2000. Computer visualisation in the design con-trol of urban environments: a literature review. Environment and Planning B: Planning and Design, 27(4), pp. 521-536 Westerdahl, B., Suneson, K., Wernemyr, C., Roupe, M., Jo-hansson, M. and Allwood C.M., 2006. Users’ Evaluation of a Vir-tual Reality Architectural Model Compared with the Experience of the Completed Building, “Au-tomation in Construction”, 15(2) pp. 150-165.
ban model when comparing the scores to the 2D mapping technique. Overall, the results showed that the methodology was valuable when comparing the efficiency of visualiza-tion techniques in representing urban histo-ric sites.
In summary, the 3D urban model was reported to have given a fairly better representation of change in historic townscape of the Zeyrek Ur-ban Site than the 2D mapping technique. The representation ability of the 3D urban model was regarded as an improvement according to both professional and non-professional groups’ level of perception in the sense of comprehen-sion and affection to change in urban historic environments. The methodology in this paper presented the capabilities of innovative 3D vi-sualization techniques dedicated to put urban conservation projects into the service of va-rious interest groups in the planning process.