<Article>
Active-learning methods in large groups of repeat
students
Gemma Abío, Manuela Alcañiz, Marta Arespa, Helena Chulià, Marta Gómez-Puig, Ester Manna, Concepció Patxot, Glòria Rubert, Fernando Sánchez-Losada, Mònica Serrano, Alexandrina Stoyanova, Montserrat Vilalta-Bufí
This paper is based on work supported by the University of Barcelona and the Institute of Education Sciences under grant numbers 2014PID_UB/031 and REDICE16-1462. We thank two anonymous referees for their helpful comments
Sent: 04/12/2017 Accepted: 12/01/2018 Published in press: 15/02/2018 Published: 04/07/2018
//Abstract
INTRODUCTION. Students who are required to repeat a subject at university are often not only low achieving, but also unmotivated and lacking in self-confidence. METHOD. In this study, we evaluate the effect of implementing a combination of three innovative techniques (flipped classroom, team-based learning and frequent testing) in groups of students who are repeating a subject. We assess the impact of the new teaching strategy on the final course grade through econometric analysis. Our sample consists of more than a thousand students who were repeating a subject in the Bachelor’s degrees in Business Administration or Economics of the University of Barcelona. RESULTS. We find that students benefit from guided autonomous study, continuous feedback and teamwork. The benefits are reflected primarily in higher final grades and an increase in the number of students who sat the final exam. The results hold up even after controlling for age, gender and average overall grade. DISCUSSION. Although the study was carried out with groups of students who were repeating a subject in economic theory, their success suggests that the new teaching approach could be successfully applied to other subject areas and among groups of students who are taking a subject for the first time.
//Keywords
Teaching innovation; Flipped classroom; Team-based learning; Frequent testing; Repeating a subject; Economics. //Recommended reference
Abío, G., Alcañiz, M., Arespa, M., Chulià, H., Gómez-Puig, M., Manna, E., … Vilalta-Bufí, M. (2018). Active-learning methods in large groups of repeat students. REIRE Revista d’Innovació i Recerca en Educació, 11(2), 70–82. http://doi.org/10.1344/reire2018.11.220657
//Authors’ information
Gemma Abío. Department of Economics, Faculty of Economics and Business, University of Barcelona (Spain). [email protected], ORCID: http://orcid.org/0000-0003-4823-524X
Manuela Alcañiz. Department of Econometrics, Statistics and Applied Economics, Faculty of Economics and Business, University of Barcelona (Spain). [email protected], ORCID: http://orcid.org/0000-0002-5028-1926 Marta Arespa. Department of Economics, Faculty of Economics and Business, University of Barcelona (Spain). [email protected], ORCID: http://orcid.org/0000-0002-8207-6855
Helena Chulià. Department of Econometrics, Statistics and Applied Economics, Faculty of Economics and Business, University of Barcelona (Spain). [email protected], ORCID: http://orcid.org/0000-0001-5020-0519
Marta Gómez-Puig. Department of Economics, Faculty of Economics and Business, University of Barcelona (Spain). [email protected], ORCID: http://orcid.org/0000-0001-8349-2829
Ester Manna. Department of Economics, Faculty of Economics and Business, University of Barcelona (Spain). [email protected], ORCID: http://orcid.org/0000-0002-6932-0577
Concepció Patxot. Department of Economics, Faculty of Economics and Business, University of Barcelona (Spain). [email protected], ORCID: http://orcid.org/0000-0002-4382-0119
Glòria Rubert. Department of Economics, Faculty of Economics and Business, University of Barcelona (Spain). [email protected], ORCID: http://orcid.org/0000-0002-5026-9273
Fernando Sánchez-Losada. Department of Economics, Faculty of Economics and Business, University of Barcelona (Spain). [email protected], ORCID: http://orcid.org/0000-0001-6720-6685
Mònica Serrano. Department of Economics, Faculty of Economics and Business, University of Barcelona (Spain). [email protected], ORCID: http://orcid.org/0000-0003-1190-5406
Alexandrina Stoyanova. Department of Economics, Faculty of Economics and Business, University of Barcelona (Spain). [email protected], ORCID: http://orcid.org/0000-0003-3238-0055
Montserrat Vilalta-Bufí. Department of Economics, Faculty of Economics and Business, University of Barcelona (Spain). [email protected], ORCID: http://orcid.org/0000-0003-3089-3455
//Títol
Mètodes d’aprenentatge actiu en grups grans d’estudiants repetidors //Resum
INTRODUCCIÓ. Els estudiants repetidors d’un curs a la universitat sovint es caracteritzen per tenir no només un baix rendiment sinó també una manca de motivació i confiança en ells mateixos. MÈTODE. En aquest estudi, analitzem l’efecte de la implementació d’una combinació de tres tècniques d’ensenyament innovadores (la classe inversa, l’aprenentatge basat en equips i l’avaluació freqüent amb tests) en grups d’estudiants repetidors d’alguna assignatura. Avaluem l’impacte d’aquestes noves estratègies sobre la nota final del curs utilitzant mètodes economètrics. La mostra que utilitzem consta de més d’un miler d’estudiants que repeteixen un curs en els graus d’Administració i Direcció d’Empreses (ADE) o d’Economia de la Universitat de Barcelona. RESULTATS. Obtenim que els estudiants es beneficien de l’estudi autònom guiat, la retroacció continuada que reben, i el treball en equip. Els guanys es reflecteixen sobretot en una nota final més alta i en un augment en la proporció d’estudiants que es presenten a l’examen final. Els resultats es mantenen quan es controla per edat, sexe i nota mitjana dels estudis. DISCUSSIÓ. Malgrat que l’estudi s’ha portat a terme a partir d’estudiants repetidors d’assignatures de teoria econòmica, els resultats suggereixen que la nova metodologia d’ensenyament es podria aplicar amb èxit en altres àrees i amb grups d’estudiants no repetidors.
//Paraules clau
Innovació docent; Classe inversa; Aprenentatge basat en equips; Avaluació freqüent; Cursos de repetidors; Economia.
//Título
Métodos de aprendizaje activo en grupos grandes de estudiantes repetidores //Resumen
INTRODUCCIÓN. Los estudiantes repetidores de un curso en la universidad se caracterizan a menudo por tener no solo un bajo rendimiento sino también una falta de motivación y confianza en sí mismos. MÉTODO. En este artículo, analizamos el efecto de implementar una combinación de tres técnicas de innovación docente (el aula invertida, el aprendizaje basado en equipos, y la evaluación frecuente con test) en grupos de estudiantes repetidores de una asignatura. Evaluamos el impacto de estas nuevas estrategias sobre la nota final del curso utilizando métodos econométricos. La muestra que usamos consta de más de mil estudiantes que repiten un curso en los grados de Administración y Dirección de Empresas o Economía de la Universidad de Barcelona. RESULTADOS. Hallamos que los estudiantes se benefician del estudio autónomo guiado, la retroacción continua que reciben, y el trabajo en equipo. Las ganancias se reflejan sobre todo en una nota final más alta y un aumento en la proporción de estudiantes que se presentan al examen final. Los resultados se mantienen cuando se controla por la edad, el sexo y la nota media de los estudios. DISCUSIÓN. Aunque el estudio se ha llevado a cabo con estudiantes repetidores de cursos de teoría económica, los resultados sugieren que la nueva metodología docente se podría aplicar con éxito en otras asignaturas y con grupos de estudiantes no repetidores.
//Palabras clave
Innovación docente; Aula invertida; Aprendizaje basado en equipos; Evaluación frecuente; Cursos de repetidores; Economía.
1. Introduction
Since the adoption of innovative techniques to promote student engagement in active learning, university teaching has frequently diverged from the traditional lecture format. The aim of introducing such techniques in the classroom is to change study strategies by encouraging students to actively participate in the learning process. This is especially necessary for students who experience academic difficulties and are required to repeat a subject at some stage of their degree programme. Some of these students may have poor knowledge capacity or a background that hinders the learning process, while others may lack the skills and learning habits required for a successful performance in the educational setting (Kruger and Dunning, 1999; Pennebaker, Gosling and Ferrell, 2013). However, despite the importance of designing active-learning techniques to help low-achieving students improve their academic performance, the issue has thus far not been studied in this specific group of students. The aim of the present paper is to take a major step towards filling this gap in the literature.
In this context, flipped classroom (FC) and team-based learning (TBL) are the leading active-learning strategies. FC is a teaching strategy that focuses on the importance of using class time to construct knowledge rather than transmit information. It reverses the traditional educational arrangement: students prepare content and concepts before class time, and the classroom is transformed into a dynamic space in which the instructor organizes in-class activities and guides and assists students in the learning process. Thus, the classroom becomes an interactive learning environment. The origins of FC can be traced back to the 1990s (Crouch and Mazur, 2001; King, 1993; Mazur, 1997) and became popular during the 2000s (Bergmann and Sams, 2012). Many studies support its success (McLaughlin, 2013; Missildine, Fountain, Summers and Gosselin, 2013; Wilson, 2013) and highlight the improvements in student achievements, participation and attitudes toward learning and teaching, and higher satisfaction levels among teachers involved in the model (Berrett, 2012; Chung, 2014; Lage, Platt and Treglia, 2000; Prieto, Díaz, Montserrat and Reyes, 2014; Strayer, 2012).
In the TBL approach, traditional lectures play a minor role and are replaced by activities involving interaction between small groups of students. Thus, students actively participate in the learning process of their classmates. They are given the responsibility of preparing the subject content and studying in advance so that they can contribute to the results of the group. The activities not only reinforce student knowledge and learning processes (Nordberg, 2008; Opdecam, Everaert and Van Keer, 2014; Shah, 2013), but also help them develop interpersonal communication skills (Michaelsen, Knight and Fink, 2004). A cooperative learning strategy therefore enhances the interconnection between students, who improve their academic performance (Yamarik, 2007), increase their self-esteem and foster a spirit of teamwork (Millis and Cottell, 1998) through involvement in a common project.
In addition to these two active-learning strategies, frequent testing (FT) is another tool that can help students develop learning habits. According to Roediger, Putnam and Smith (2011), the benefits of testing go beyond mere assessment. Quizzes allow students to identify knowledge gaps as they go along, provide lecturers with feedback on the progress of their students and, most importantly, improve learning by allowing lecturers to dedicate more time to more complex content and concepts. Moreover, teamwork within test activities has been shown to increase
student engagement and enhance the productive learning behaviour of both low and high achievers (Hong and Pham, 2013).
The present study evaluates the results of our experience through the use of these three strategies (FC, TBL and FT) with students who are repeating a subject in special groups called Groups of Intensive Study (GIS) at the University of Barcelona (UB). Incorporating these learning activities to motivate and organize their work at individual and team levels resulted in significant improvements in both the academic performance and class attendance of students. As far as we know, Abío et al.
(2017) is the first study to analyze the benefits of a more interactive classroom in groups of students who are repeating a subject. In this paper, however, we use a larger dataset that makes it possible to develop econometric tests.
The study was carried out over three academic years (2013-2014, 2014-2015 and 2015-2016), in four subjects taken as part of two degrees: Microeconomics in the Bachelor’s Degree in Business Administration (BA) and Introduction to Economics, Microeconomics I and Microeconomics II in the Bachelor’s Degree in Economics (ECO). The results show a significant increase in the academic performance and class attendance of these students and suggest that this educational strategy may also be helpful for teaching many other subjects.
The paper is organized as follows: Section 2 describes the context of the experience. Section 3 presents the teaching strategies proposed to improve the academic achievement of GIS students. Section 4 reports the results and, finally, Section 5 presents the conclusions.
2. The teaching context
In the academic year 2011-2012, the UB introduced the GIS for students required to repeat a subject. Like regular groups, the GIS is worth 6 ECTS credits. However, while regular groups engage in 60 hours of face-to-face activities, GIS devote just 30 hours to face-to-face activities. This structure involves an increase in both the workload of the lecturer, who has to prepare additional online materials for guided self-study, and the time students are required to spend on autonomous learning. Moreover, since GIS class time is scheduled for outside the regular class-time schedule (during lunch breaks), it frees up the students’ timetable and thus enables them to combine the repeat subject with classes for new subjects.
During the academic years 2011-2012 and 2012-2013, GIS face-to-face activities focused primarily on traditional classes. However, this learning format turned out to be relatively inefficient. The GIS results were very disappointing: attendance during face-to-face activities, the percentage of students who chose to sit exams and the proportion of those who passed the subject were lower than in regular groups. These findings may be attributed to the characteristics of the students who enrolled in the GIS. Repeat students are not a representative sample of the general student population and are more likely to experience learning difficulties and poorer outcomes. While there are no significant differences between GIS and regular groups in terms of gender, GIS students tend to be one or two years older than those in regular groups, since they have repeated the subject at least once. Our experience with these students showed that they might have a lower analysis and synthesis capacity, reduced ability to organize their work and manage their time, and less motivation to study. The poor performance of GIS in the first two years of their implementation
led us to implement a new teaching strategy to better address these students’ needs and help them make progress in their studies.
Finally, it is worth mentioning that, although there has been a gradual reduction in the number of students per group, GIS can be quite numerous. While regular groups consist of a maximum of 90 students, GIS can easily exceed this number. This clearly conditions teaching outcomes. Below is an explanation of how we combine and apply active-learning methods —FC, TBL and FT— in the context of such large groups.
3. Teaching strategy
To improve the learning performance of students in GIS, we propose a strategy based on the joint implementation of the FC, TBL and FT methods. In this context, FC allows the teaching and learning dynamics to shift from passive to more proactive. TBL incorporates a social interaction dimension into this learning process. In fact, TBL combined with FT makes our active-learning methodology feasible in a large-group context by reducing the teacher’s workload. The proposed teaching approach undoubtedly requires considerable involvement from the teacher for the development of activities and marking of continuous assessment activities, especially in large groups. In fact, this project was developed by a group of teachers who were collaborating on the development of exercises. During the second semester of 2013-2014 and throughout the academic years 2014-15 and 2015-16, we carried out a trial experiment in four subjects — Microeconomics (BA), Introduction to Economics (ECO), Microeconomics I (ECO), and Microeconomics II (ECO)— to test the results of this teaching approach and improve the strategy design for future implementations.
Description of the teaching strategy
In each subject, students can choose between two assessment formats: continuous or single assessment. Continuous assessment consists of a weighted average of several aspects, which often include activities during the academic year and a final exam. By contrast, single assessment consists solely of the final exam grade. In this section, we describe the learning activities used in the continuous assessment of GIS. These activities contribute to a constructive alignment between the intended learning outcomes, the teaching/learning activities and the assessment tasks (Biggs and Tang, 2011).
Using these new methodologies, students in the GIS who are subject to continuous assessment are grouped into stable teams of three or four members. The aim of creating stable groups is to reinforce commitment to the group work and efficiency. Class attendance is mandatory, as there are continuous assessment activities every day. The schedule for each session and the student materials are announced in advance on the subject’s digital platform. Each session consists of either theoretical or practical classes.
Theoretical sessions start with a test: students have to answer an individual multiple-choice quiz made up of 10 questions and based on the materials provided in advance. Immediately afterwards, students answer the same 10 multiple-choice questions in their teams. This exercise requires students to discuss the questions and reach a consensus with their
colleagues, since they have to provide a single answer. Both quizzes are assessed and each lasts 15–25 minutes. Finally, the answers to the test questions are provided by the teacher, who resolves queries and discusses any questions that may arise. The time remaining in the session (around 30–40 minutes) is devoted to explaining the more complex theoretical concepts of the topic. In practical sessions, students work in teams in the classroom to resolve numerical and graphic problems related to the topic. In order to encourage students to participate in the teamwork and increase their motivation, the first team to solve a problem presents the solution to the rest of the class using the board and obtains extra points (see Table 1 below). Although this was not the primary objective of our strategy, presenting solutions on the board is considered an important part of developing and improving students’ presentation skills.
During the final week of the subject, students are asked to fill in self- and co-assessment questionnaires on their own work and that of their teammates. Finally, students are asked to sit a final exam.
Grading system
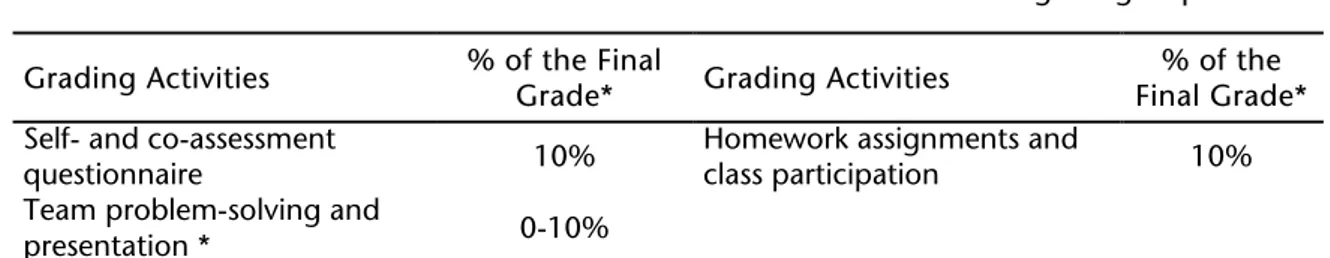
The assessment and learning activities in GIS are designed to help students successfully keep up with the subject, meet the learning objectives and demonstrate their progress. Table 1 provides a breakdown of all components included in the grading system for both GIS and regular groups.
Both the subject content and the final exam are the same for GIS and regular students. All students can choose between continuous and single assessment. Moreover, in the case of students who choose continuous assessment, the overall weight of their continuous assessment activities (40%) and final exam (60%) in their final year grade is the same for both group types. Therefore, the only difference between the way in which GIS students and regular group students are graded is the type of continuous assessment activities used. The activities carried out by GIS students aim to stimulate autonomous learning before classes and to foster active participation during the two-hour weekly sessions, whereas the two continuous assessment tests in the regular groups are performed following an explanation of the corresponding topics or units. Moreover, the continuous assessment method used in the new approach includes frequent testing, while only a few activities are assessed in the regular groups during the academic year.
Table 1
Summary of assessment policy according to group type
Assessment in GIS Assessment in regular groups Grading Activities % of the Final Grade* Grading Activities Final Grade* % of the
Final exam 60% Final exam 60%
Average of all individual tests 15% Continuous assessment test 1 15% Average of all team tests 15% Continuous assessment test 2 15%
Assessment in GIS Assessment in regular groups Grading Activities % of the Final Grade* Grading Activities Final Grade* % of the Self- and co-assessment
questionnaire 10% Homework assignments and class participation 10% Team problem-solving and
presentation * 0-10%
* 10% of the final grade in this category is an extra-credit option. It is obtained only by students who actively participate in team problem-solving and who present solutions on the board to the rest of the teams.
Source: Authors’ own data
4. Results and discussion
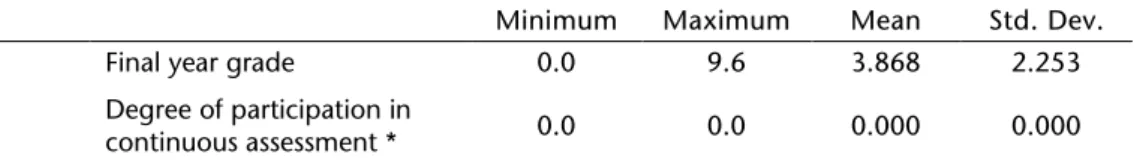
The sample consists of 1,091 students enrolled in a GIS in one of four subjects during the abovementioned academic years. Around 41% of these students followed the new teaching strategy, while the rest did not choose continuous assessment —these students were a minority within the GIS that used the new methodologies— or, for different reasons, were enrolled in a GIS that did not apply the new strategy.1 Students were not told in advance that there were two
methodologies. Table 2 shows the descriptive statistics. Both groups are similar in all characteristics, except for the final year grade. The difference in the final year grade is statistically significant at 1%, with the group following the new methodology (treatment group) obtaining a higher grade. Note that the treatment group shows a lower standard deviation. This feature might be a major factor when designing strategies to minimize student performance dispersion, an ever-present problem that is extremely difficult to tackle when dealing with large groups.
Table 2 Descriptive statistics
Minimum Maximum Mean Std. Dev.
Total sample (n=1,091)
% Female 38.0 %
Age 19 63 21.010 3.340
Average grade of studies 5.0 7.6 5.936 0.369
Final year grade 0.0 9.6 4.207 2.217
Degree of participation in continuous assessment * 0.0 100.0 63.801 41.515 Treatment group (n=448) % Female 38.4 % Age 19 43 20.770 2.746
Average grade of studies 5.0 7.4 5.922 0.363
Final year grade 0.0 9.0 4.692 2.072
Degree of participation in continuous assessment * 14.0 100.0 86.724 18.705 Control group (n=643) % Female 37.8 % Age 19 63 21.190 3.691
Average grade of studies 5.0 7.6 5.947 0.374
1 Our results continue to hold up when students enrolled in a GIS that followed the new teaching strategy but applied single assessment were
excluded from the control group (n=160).
Minimum Maximum Mean Std. Dev.
Final year grade 0.0 9.6 3.868 2.253
Degree of participation in
continuous assessment * 0.0 0.0 0.000 0.000
* Measured as a percentage of continuous assessment activities undertaken by the student.
Treatment group refers to those who followed the new teaching strategy and the continuous assessment approach, while the control group refers to those who were enrolled in a GIS that either did not follow the new teaching strategy (and hence the proper continuous assessment method) or followed the new teaching strategy but applied the single assessment approach.
Source: Authors’ own data
Table 3 shows the results of a linear regression to explain the final year grade.2 The effect of the
treatment group remains positive and significant, even when we controlled for gender, age and average grade of the studies.3 Applying the new teaching strategy results in an expected increase
of 0.797 points in the final grade.
Table 3
Linear regression. Dependent variable: Final year grade. Total sample Variable Coeff. T p-value
Constant 0.068 0.063 0.950 Gender -0.021 -0.159 0.874 Age -0.128 -6.667 0.000 Average grade of studies 1.096 6.311 0.000 Treatment group 0.797 6.135 0.000 F=30.30 (P-value=0.000), R2=10.0%.
Source: Authors’ own data
Table 4 analyzes the importance of the degree of participation in the continuous assessment process, measured as a percentage of completed activities out of all activities proposed. The results show that students who participated in more activities obtained a higher final grade, even after controlling for average grade of studies, gender and age. Therefore, greater exposure to the new methodology seems to improve academic results. Note that gender is irrelevant to the final grade in all cases, while being older or having a lower average grade of studies results in poorer performance.
Table 4
Linear regression. Dependent variable: Final year grade. Treatment group only
Variable Coeff. t p-value
Constant -2.724 -1.672 0.095
Gender -0.122 -0.655 0.513
Age -0.091 -2.770 0.006
Average grade of studies 1.074 4.254 0.000
Degree of participation in continuous assessment 0.035 7.101 0.000 F=21.21 (P-value=0.000), R2=16.1%.
Source: Authors’ own data
2 Unfortunately, the grade in the final exam was not available for 56% of our cases.
A comparison of the percentage of students who sat the final exam between the treatment and control group also reveals a clear advantage of the new teaching strategy. While 92.4% of students following the new teaching strategy sat the final exam, only 84.8% from the control group did so. The difference is statistically significant, at 1%.
Finally, we analyze the academic performance of different groups studying the subject Microeconomics (BA). This subject offers a large sample of 531 students and the advantage of being taught by the same lecturer, thus eliminating selection problems due to differences in teaching quality. Moreover, we added a new group of students to the comparison: those who were studying the subject for the first time, also with the same lecturer. Table 5 shows the average final year grade and its confidence interval. The results show that the regular group has a higher average final year grade than the students in the GIS. This is not surprising when one considers that the students in the GIS had failed the subject at least once, a fact that may be a predictor of poorer future performance than students in a regular group. However, note that there is an overlap in the confidence intervals between the regular group and the GIS with the new teaching strategy, thus indicating that the difference in average grade is not significant, at 5%. This suggests that the new teaching methodology brings the academic performance of repeat students into line with those in a regular group. Moreover, the difference between those in the GIS that followed the new teaching strategy and those in the GIS that followed the regular teaching strategy is large and significant, thereby reinforcing the previous results.
Table 5
Differences in academic performance in Microeconomics (BA)
95% confidence interval Sample size Mean Std. Dev Lower bound Upper bound
Regular group 217 4.794 2.272 4.490 5.098
GIS with new teaching strategy 156 4.178 2.227 3.826 4.503 GIS with regular teaching strategy 158 3.144 2.131 2.809 3.478
Total 531 4.122 2.317 3.925 4.320
Source: Authors’ own data
Figure 1 presents the box plot of the final year grades of these three groups. The boxes in each box plot represent 50% of the middle grades. The black horizontal line represents the median and the upper and lower bounds represent the maximum and minimum grade, respectively. This figure shows how the grade distribution of the GIS with the new teaching strategy (in the centre) is much more similar to the regular group distribution (on the left) than to the GIS without the new teaching strategy (on the right).
Finally, we also look at the percentage of students who sat the final exam. There are statistically significant differences in the percentage of students who show up for the final exam across the three groups. The percentage is highest in the regular groups (92.6%), followed by the GIS with the new teaching strategy (85.9%) and finally the GIS with the regular teaching strategy (82.3%). The differences are significant, at 1%.
Figure 1
Distribution of final years grades in Microeconomics (BA) across three groups. NM=new methodology
Source: Authors’ own data
5. Conclusions
This paper proposes a combination of FC, TBL and FT strategies to enhance the academic performance of students required to repeat a subject. To the best of our knowledge, such students, who represent a group for major concern, have not received a great deal of attention from researchers in the field of teaching innovation.
The results suggest that students benefit from guided autonomous study, continuous feedback and teamwork. The benefits are reflected primarily in: (1) a higher final year grade, which is not much lower than the grades of students who attend regular groups, and (2) an increase in the percentage of students who sat the final exam. The results hold up when controlling for age (which worsens results), gender (which is not significant) and average grade of studies.
The teaching approach proposed requires a high level of involvement by the teacher for the development of activities and marking of continuous assessment activities, especially in large groups. Working with colleagues and using new technologies to carry out self-assessment procedures might represent approaches to reducing the considerable time requirements. In our experience, the positive results outweigh the costs of applying the proposed teaching approach. Although the study was carried out with groups of students who were repeating subjects as part of the economics degree, the success suggests that the new teaching approach might be applied successfully to other subject areas and among groups of students who are taking a subject for the first time.
<References>
Abío, G., Alcañiz, M., Gómez-Puig, M., Rubert, G., Serrano, M., Stoyanova, A., and Vilalta-Bufí, M. (2017). Retaking a course in economics: Innovative teaching strategies to improve academic performance in groups of low-performing students, Innovations in Education and Teaching International, forthcoming. https://doi.org/10.1080/14703297.2017.1389289
Bergmann, J., and Sams, A. (2012). Flip your classroom: Reach every student in every class every day. Washington, D.C.: International Society for Technology in Education.
Berrett, D. (2012). How ‘flipping’ the classroom can improve the traditional lecture. The Chronicle of Higher Education. Retrieved from
http://chronicle.com/article/How-Flipping-the-Classroom/130857/
Biggs, J., and Tang, C. (2011). Teaching for quality learning at university (4th ed.). Maidenhead (UK): McGraw Hill.
Chung, K. (2014). Professors ‘flip’ classrooms, enhance learning. Daily Tar Heel. Retrieved from
http://www.dailytarheel.com/article/2014/01/flipped-classrooms-0108
Crouch, C., and Mazur, E. (2001). Peer Instruction: Ten Years of Experience and Results, American Journal of Physics,69, 970–977. https://doi.org/10.1119/1.1374249
Hong, T., and Pham, T. (2013). Using group projects as a strategy to increase cooperation among low- and high-achieving students. Higher Education Research and Development,32, 993–1006.
https://doi.org/10.1080/07294360.2013.806436
King, A. (1993). From sage on the stage to guide on the side. College teaching 41, 30–35.
https://doi.org/10.1080/87567555.1993.9926781
Kruger, J., and Dunning, D. (1999). Unskilled and unaware of it: How difficulties in recognizing one’s own incompetence lead to inflated self-assessments. Journal of Personality & Social Psychology,77, 1121–1134. https://doi.org/10.1037/0022-3514.77.6.1121
Lage, M.J., Platt, G.J., and Treglia, M. (2000). Inverting the classroom: A gateway to creating an inclusive learning environment. The Journal of Economic Education, 31, 30–43.
https://doi.org/10.1080/00220480009596759
Mazur, E. (1997). Peer Instruction: A User's Manual Series in Educational Innovation. Upper Saddle River (USA): Prentice Hall.
McLaughlin, J.C. (2013). Pharmacy student engagement, performance, and perception in a flipped satellite classroom. American Journal of Pharmaceutical Education, 77, 1–8.
https://doi.org/10.5688/ajpe779196
Michaelsen, L. K., Knight, A. B., and Fink, L. D. (2004). Team-Based Learning: A Transformative Use of Small Groups in College Teaching. Sterling (USA): Stylus.
Millis, B. J., and Cottell, P. G. (1998). Cooperative Learning for Higher Education Faculty. Phoenix (USA): Oryx Press.
Missildine, K., Fountain, R., Summers, L., and Gosselin, K. (2013). Flipping the classroom to improve student performance and satisfaction. Journal of Nursing Education, 52, 597–599.
https://doi.org/10.3928/01484834-20130919-03
Nordberg, D. (2008). Group projects: More learning? Less fair? A conundrum in assessing postgraduate business education. Assessment & Evaluation in Higher Education, 33, 481–492.
https://doi.org/10.1080/02602930701698835
Opdecam, E., Everaert, P., and Van Keer, H. (2014). Preferences for Team Learning and Lecture-Based Learning Among First-Year Undergraduate Accounting Students. Research in Higher Education,55, 400–432.
Pennebaker, J.W., Gosling, S.D., and Ferrell, J.D. (2013). Daily Online Testing in Large Classes: Boosting College Performance while Reducing Achievement Gaps. PLoS ONE, 8(11), e79774.
Https://doi.org/10.1371/journal.pone.0079774
Prieto, A., Díaz, D., Montserrat, J., and Reyes, E. (2014). Experiencias de aplicación de estrategias de gamificación a entornos de aprendizaje universitario. ReVisión, 7(2), 76–92.
Roediger, H. L. III, Putnam, A. L., and Smith, M. A. (2011). Ten benefits of testing and their applications to educational practice. Psychology of Learning and Motivation, 55, 1–36.
https://doi.org/10.1016/B978-0-12-387691-1.00001-6
Shah, S. Z. A. (2013). The use of group activities in developing personal transferable skills.
Innovations in Education and Teaching International, 50, 297–307.
https://doi.org/10.1080/14703297.2012.760778
Strayer, J. (2012). How learning in an inverted classroom influences cooperation, innovation and task orientation. Learning Environments, 15, 171–193. https://doi.org/10.1007/s10984-012-9108-4
Wilson, S. G. (2013). The flipped classroom: A method to address the challenges of an undergraduate statistics course. Teaching of Psychology, 40, 193–199.
https://doi.org/10.1177/0098628313487461
Yamarik, S. (2007). Does cooperative learning improve student learning outcomes? Journal of Economic Education,38, 259–277. https://doi.org/10.3200/JECE.38.3.259-277
Copyright © 2018. This work is under a Creative Commons License. It can be used only if you give the credits to the authors in the manner specified at the beginning of this document.