Stefano Chiari
ECOLOGY OF THE HERMIT
BEETLE (OSMODERMA EREMITA)
IN MEDITERRANEAN WOODLANDS
Tutor: Prof. Giuseppe M. Carpaneto
Co-tutor: Prof. Thomas Ranius
Doctoral School in Biology – Section:
Biodiversity and Ecosystem Analysis
XXIV Cycle, A.A. 2011/2012
DOCTORAL SCHOOL IN BIOLOGY
Section: Biodiversity and Ecosystem Analysis
XXIV CYCLE
Ecology of the hermit beetle (Osmoderma eremita)
in Mediterranean woodlands
Ecologia del coleottero eremita (Osmoderma eremita) in ambienti boschivi del Mediterraneo
Stefano Chiari
A.A. 2011/2012
Tutor: Prof. Giuseppe M. Carpaneto Co-tutor: Prof. Thomas Ranius
Chiari S., 2009. Ecology of the hermit beetle (Osmoderma eremita) in Mediterranean woodlands. Doctoral thesis. Department of Environmental Biology, Roma Tre University, Rome, Italy. Stefano Chiari
Department of Environmental Biology, Roma Tre University, 446 Viale Marconi, 00146 Rome, Italy.
E-mail: [email protected], [email protected] © Stefano Chiari
No parts of this thesis, including papers that are submitted, must be reproduced without permission.
Front cover: a male of hermit beetle (Osmoderma eremita) walking on the bark of a cork oak (Quercus suber) (Photo by S. Chiari).
Thesis defense on the 16th December 2011 in front of the following jury: Alain Lenoir (European evaluator),
Anna Traveset (European evaluator), Glenn Svensson (European evaluator), Patrizia D’Ettorre (Expert member). Thesis reviewers:
Glenn Dubois, Keith N. A. Alexander.
To my family, my friends,
‘‘Winter Always Turns to Spring’’
Nichiren Daishonin
CONTENTS vii
CONTENTS
ABSTRACT ix PREFACE xi CHAPTER 1 Introduction 1 1.1 European forests 1 1.2. Saproxilic fauna 1 1.3 Osmoderma eremita 2 1.3.1 Population characteristics 3 1.3.2 Habitat requirements 4 1.3.3 Dispersal abilities 5 1.3.4 Threats 61.3.5 Status and role in conservation biology 6 1.4 Overview of the thesis and aims 7
1.5 References 9
CHAPTER 2 Capture methods and population assessment 17 CHAPTER 3 Habitat characteristics 43 CHAPTER 4 Dispersal patterns 65 CHAPTER 5 Conclusions and implications for conservation 91
5.1 Conclusions 91
5.2 Implications for conservation 93 5.2.1 Finding high priority sites 93 5.2.2 Management at landscape level 93 5.2.3 Management at single tree level 94
5.3 Final remarks 95
5.4 References 95
ACKNOWLEDGEMENTS 97
ABSTRACT
ix
ABSTRACT
One of the most endangered assemblage of species in Europe is represented by saproxylic beetles associated with old trees, as this habitat has decreased severely in Europe during the last 200 years. This thesis contains the first quantitative studies of the population status, the habitat characteristics and the dispersal patterns of
Osmoderma eremita in Mediterranean woodlands, at the southernmost limit of its distribution range, i.e. central Italy.
Pitfall traps, associated with visual encounter surveys, resulted to be the optimal method to assess the species presence and to obtain reliable population size estimates. Differently from northern Europe, where the demographic structure of this species has been explained by the metapopulation approach, at the southernmost limit of its distribution range a single hollow tree may host only a reduced number of individuals, which do not represent a population in itself, and a single population is widespread on the landscape.
The frequency of presence was higher in cavities with more than 4 l of wood mould, in cavities with dry or half-moist wood mould rather than wet wood mould, and with a low soil contamination. A comparison with northern regions indicated that the warmer macro-climatic conditions in the south made the species independent on sun exposure. As most of the hollow trees contained only a small amount of wood mould (< 4 l), the habitat quality was generally poorer than in the oak pastures studied in northern Europe.
Telemetered beetles spent their life time not only inside hollow trees but also in other habitats, such as on the ground surface and under the ground level. Beetles were more active at the beginning of the season. Even though 81% of the males and 69% of the females conducted dispersals during their life-time, the dispersal distance over individuals’ life-time did not differ between sexes. The longest dispersal was conducted by a female that moved 1504 m, and power function predicts that 9.7% of beetles move distances farther than 1600 m. Both dispersal rate and range are higher than what has been found in northern Europe.
Since the population size per tree is low, the habitat quality is generally poor and a high predation rate (at least 28%) was observed in dispersing beetles, conservation efforts for this species should not focus on preserving few and isolated monumental hollow trees, but should be extended to large stands.
PREFACE
xi
PREFACE
This thesis is based on three papers submitted to peer-reviewed journals. In the common introduction were briefly addressed the issues related to saproxylic organisms, to the peculiar characteristics of Osmoderma eremita and the overall aims of the thesis. Each one of the following chapters corresponds to one paper, in particular: CHAPTER 2: Chiari S., Zauli A., Mazziotta A., Luiselli L., Audisio P., Carpaneto G.M. Surveying an endangered saproxylic beetle,
Osmoderma eremita, in Mediterranean woodlands: a comparison
between different capture methods. Submitted.
CHAPTER 3: Chiari S., Carpaneto G.M., Zauli A., Marini L., Audisio P., Ranius T. Habitat of an endangered saproxylic beetle,
Osmoderma eremita, in Mediterranean woodlands. Submitted.
CHAPTER 4: Chiari S., Carpaneto G.M., Zauli A., Zirpoli G.M., Audisio P., Ranius T. Dispersal patterns of an endangered saproxylic beetle, Osmoderma eremita, in Mediterranean woodlands. Submitted.
In the final section, the outcomings of these papers were utilized for drawing conclusions on the status of knowledge on Osmoderma
eremita at the southernmost limit of its distributional range and for
Introduction
1
CHAPTER 1
Introduction
1.1 European forests
The natural vegetation in most of Europe is forest, from the Mediterranean evergreen scrub through the deciduous forests of Central and Western Europe to the boreal forests of Fennoscandia (Bengtsson et al. 2000). Many of these forests are now long gone due to human activities and land-use changes (Perlin 1988). Some European forest types belong to the most severely disturbed and endangered ecosystems of the world (Hannah et al. 1995).
Forests support about 65% of the world’s terrestrial taxa (World Commission on Forests and Sustainable Development 1999) and have the highest species diversity for many taxonomic groups including birds (Gill 1995), invertebrates (Erwin 1982; Majer et al. 1994) and microbes (Crozier et al. 1999; Torsvik et al. 1990).
Old growth forest could harbour trees in which hollows with wood mould are formed (Ranius et al. 2009). Wood mould is fungi-infested loose material mainly consisting of rotten wood, often with frass and fragments of dead insects (Ranius 2001). Cavities start to develop when trees are about 150–200 years old (Ranius and Nilsson 1997), providing important habitats for a wide range of invertebrates, birds and mammals (Gibbons and Lindenmayer 2002; Kosinski 2006; Ranius et al. 2005). Many insect species are associated with this microhabitat (Jonsell et al. 1998).
The Mediterranean forests of Europe have been altered by human activities for a very long time and practically no pristine forest appears to be left in the region (Bengtsson et al. 2000). Old trees are now scarce and many species dependent on this habitat are today severely threatened, as isolated populations in small unconnected remnants (Harding and Rose 1986; Speight 1989).
1.2 Saproxilic fauna
Saproxylic organisms, i.e. species that are dependent on dead wood or other saproxylic species during at least some part of their life cycle (Speight 1989), constitute a large proportion of the biodiversity in forests (Siitonen 2001). Some saproxylic species are generalists, but
CHAPTER 1
2
most of them discriminate between different types of wood habitat; for instance, decay stage (Araya 1993), moisture (Dajoz 1980), successional stage of the deadwood (Siitonen and Saaristo 2000), temperature (Kelner-Pillault 1974), tree girth (Siitonen and Saaristo 2000), and sun exposure have been found to be important factors (Ranius and Jansson, 2000; Lindhe and Lindelöw 2004; Berglund et al. 2009).
Saproxylic beetles have been proposed as indicator species of forest integrity (Speight 1989; Nilsson et al. 2001) because they are highly dependent on dead wood, and are therefore particularly sensitive to forest management practices (Siitonen 2001). In Europe, many saproxylic insects are today threatened (Nieto and Alexander 2010), owing to intensive commercial forestry and changed agricultural management practices, which have decreased the amount and quality of dead wood (Davies et al. 2008).Unfortunately, the understanding of population characteristics of saproxylic beetles is poor at its best, and largely based on anecdotal observations (Komonen et al. 2008). Therefore, there is a need for detailed knowledge about the habitat requirements of the saproxylic species of conservation concern.
1.3 Osmoderma eremita
Osmoderma eremita (Scopoli, 1763, Coleoptera: Scarabaeidae) is a
up to 3 cm-large flying saproxylic beetle, inhabiting hollow trees of European old growth forests. It has a relict distribution in most parts of Western Europe, and Italy is the southernmost limit of its distributional range (Fig. 1). The larvae develop in wood mould and normally they become pupae after 2 years. The adults emerge the following year and fly in summer, since June. Thus, in nature, development normally takes 3 years and adults live up to one month (Ranius et al. 2005). Adult males produce a pheromone, with a characteristic fruity odour, like apricot or peach, to attract females. This pheromone can be used as bait by scientists for sampling the species and also as kairomone by a specialized predator (Elater
ferrugineus) for finding its prey; moreover it was hypothesized that
this pheromone could be exploited also by other saproxylic beetles as a general cue in habitat selection (Svensson et al. 2004).
Introduction
3
1.3.1 Population characteristics
The populations structure and abundance of O. eremita was mostly studied in Sweden, the northern part of its distribution range, where hollow trees were usually aggregated in stands. A stand was defined as a cluster of hollow oaks within a distance not exceeding 250 m from one tree to the next (Ranius 2000). The 250 m limit was used
Figure 1 Geographical ranges of the Osmoderma eremita complex in
Europe (Audisio et al. 2007)
because the first studies on O. eremita flight abilities have been found that this beetle has a dispersal distances no further than 200 m (Hedin and Ranius 2002; Ranius and Hedin 2001). Ranius (2000, 2001) showed that O. eremita has a metapopulation structure (sensu Levins 1969) on a small scale, where each hollow tree is a habitat patch, potentially sustaining a local population. These populations
CHAPTER 1
4
may be more or less connected by dispersal, and together form a set of metapopulations on a larger scale (Ranius 2000).
In a 5-years mark-recapture study, the population size per tree was found on average 11 adults tree-1 year-1, but differed widely between trees (0-85 adults tree-1 year-1) (Ranius 2001). The total population size of O. eremita in Bjärka-Säby (province of Östergötland, southeastern Sweden) was estimated to be 3900 individuals (Ranius 2001). A following 7-years study case carried out in Bjärka-Säby and Brokind (province of Östergötland, southeastern Sweden) showed that the population estimated in the study sites varied between 1100 and 3400, depending on the capture method, and the population size per tree was found on average from 10.1 adults tree-1 year-1 to 21.0 adults tree-1 year-1, depending on the year
(Larsson and Svensson 2009). In the first study case the spatial variability between trees was much greater than temporal variability between years (Ranius 2001), while in the second one the trap catches of O. eremita differed dramatically between years (Larsson and Svensson 2009). Carrying capacity was found proportional to the volume of wood mould, generating large differences in local extinction risks between hollow trees, and the habitat dynamics seems to be more important than demographic processes (Ranius 2007). Thus, the O. eremita populations were subsequently described in more detail by Ranius (2007), with features from both mainland-island metapopulations (sensu Harrison et al. 1988) and habitat-tracking metapopulations (sensu Thomas 1994).
1.3.2 Habitat requirements
Generally, beetles living in decomposing wood of late succession stages are not restricted to tree species but to special rot types, microclimate regimes and wood structures (Ranius and Nilsson 1997). Most findings of O. eremita have been made in hollow but still living, standing trees belonging to a large range of species (Carpaneto et al. 2010; Dubois et al. 2009; Oleksa et al. 2007; Ranius et al. 2005). As long as there is a suitable tree hollow, it appears that
O. eremita is rather an opportunistic species with respect to host tree
identity, and it should therefore colonize all suitable trees according to their availability. Tree characteristics reflecting suitable microclimate and amount of wood mould have been found to be important at northern latitudes. In Sweden the frequency of O.
Introduction
5
eremita was found to be higher in hollows with openings directed
towards sunny directions (Sud or West) and in warmer stands, as more sun exposed (Ranius and Jansson 2000; Ranius and Nilsson 1997). Also in France the frequency of occurrence was higher in open landscapes (Dubois et al. 2009), indicating that O. eremita is rather thermophilic at central and northern latitudes. Furthermore, frequency of occurrence was lower in those tree hollows that contain small amounts of wood mould, which predominantly are younger hollows (Jönsson 2003; Ranius and Jansson 2000; Ranius and Nilsson 1997; Ranius et al. 2009). This means that there is a difference in quality between hollow trees and that the quality, at central and northern latitudes, varies mostly in relation to temperature and to the successional decay stage.
1.3.3 Dispersal abilities
In Sweden, during the first pioneering studies on dispersal abilities of
O. eremita distances no greater than 200 m were registered for
dispersing beetles (Hedin and Ranius 2002; Ranius and Hedin 2001). Following studies concerning the dispersal rate estimate that only 1.6% of the dispersing individuals move distances further than 250 m and most of the adults (82-88%) remained in same tree throughout their life (Hedin et al. 2008; Ranius 2006). Also in the latest studies, carried out at the same latitudes, the species has exhibited a limited dispersal rate and a dispersal distance of up to 300 m (Svensson et al. 2011). A model including all observed individuals yielded a mean dispersal range of 82 m with 1% dispersing more than 1 km (Svensson et al. 2011). In all these studies no significant differences were observed between males and females. The low dispersal rate and distances showed by the species indicated that the populations of each tree have limited connections with each other, and the single stand was found the most relevant scale for O. eremita (Ranius 2000).
In France, Dubois and Vignon (2008) reported for one individual a total dispersal of 700 m. In a tethered flight experiment with individuals collected in France, the movements of O. eremita ranged from 20 to 1500 m, with a maximum cumulative flight distance of one individual of 2400 m (Dubois et al. 2010). In this study several differences were consistent with sex-biased dispersal in O. eremita: flight distance, average and maximum flight speeds were larger in
CHAPTER 1
6
females. Also, both the take-off and flight completions were different between males and females, and increased in females with lower body conditions, whereas decreased in males (Dubois et al. 2010). The interactions between sex and body conditions on flight capacity may reveal different dispersal strategies between males and females. Moreover, the spatial extent of landscape scale habitat management for this species could be different in relation to different latitudes. 1.3.4 Threats
Among the leading threats affecting O. eremita there is the modern forest management which deprives this species of its habitat (Luce 1997). The habitat destruction is mostly due to intensive deforestation for the timber trade, forestry shortened shifts, removal of dying trees or dead trunks, forest fires and changed agricultural management practices (Davies et al. 2008). The replacement of broadleaf trees by coniferous trees supplemented this process of habitat reduction (Tauzin 2005).
Most populations of O. eremita inhabit localities which are much smaller, and the genetic effects may have a considerably larger influence on the population viability (Ranius 2001). Therefore, lowered fitness resulting from inbreeding and loss of genetic variation might also increase extinction risks (Ranius 2000).
Due to habitat destruction, habitat alteration and loss of genetic variation, many local extinctions of O. eremita are to be expected in the near future (Luce 1997; Ranius et al. 2005).
1.3.5 Status and role in conservation biology
This beetle, protected by the Bern Convention (Appendix 2) and the Habitat Directive (Annex II, IV), is listed in the IUCN Red List of Threatened Species as near threatened (Nieto et al. 2009).
In nature conservation working on a single species is important, as it is more likely to be protected by law and it is easier to assess and monitor than groups of species (Caro and O’Doherty 1999; Simberloff 1998). For that reason O. eremita was proposed as umbrella species (Ranius 2002). Moreover, this beetle was considered both as an indicator of saproxylic species richness and as a keystone species (Ranius 2002). This may be because O. eremita affects the rotten wood habitat both physically and chemically, in a favourable way for other species (Jönsson et al. 2004). Thus, the
Introduction
7
preservation of O. eremita is important for the survival of the entire invertebrate community associated with hollow trees in Europe (Ranius 2002;Svensson et al. 2003, Ranius et al. 2005).
1.4 Overview of the thesis and aims
A species’ ecology may vary within its distribution range, in response to different climatic conditions, or habitat and landscape characteristics (Dover and Settele 2009; Ranius et al. 2011). Moreover, for long-term conservation planning, we need a detailed knowledge about which sites should be given priority, which habitat characteristics should be improved, and how the few suitable trees should be actively managed (Alexander et al. 1996).
In Italy, as in the whole Mediterranean region, knowledge on old trees and saproxylic beetles are still poor. Most of the studies regarding O. eremita were carried out in northern and central Europe, first of all Sweden and France, respectively. For most localities with hollow trees in Italy, there are only anectodical information on presence/absence of O. eremita, and there are not data at all on abundance. In Mediterranean environments the habitat suitability for
O. eremita could be different in comparison to the central and
northern Europe, and understanding the autecology of the species at low latitudes could enhance conservation efforts and strategies. Finally, the dispersal patterns determine at which spatial scale habitat patch and isolation became critical for long term survival, and should be studied in different ecological and geographical contexts. All these aspects are important for nature conservation, and O. eremita could be used as flagship species for conservation in the Italian peninsula, where the status of the few remnaining old forests, and their associated fauna, are very critical.
Therefore, we carried out this work in two of the few areas where
O, eremita has been found in central Italy (Fig. 2). These areas have
been discovered and then selected after preliminary surveys conducted in 2008 for a monitoring project on saproxylic beetles supported by the Regional Park Agency (ARP). The two selected areas appeared the most suitable for O. eremita in the Latium region. Until now these areas seem to be the southernmost were the species occurs (Fig. 2).
CHAPTER 1
8
Figure 2 Italian distribution of Osmoderma eremita (modified from
CKmap Project, Ministry of the Environment: Ruffo and Stoch 2006). The big dot corresponds to our study areas, including the two new sites discovered during a preliminary survey for ARP in 2008
As no study on O. eremita has so far been conducted in the southern part of its range, i.e. in Italy, the overall scope of this thesis is to increase the ecological knowledge on hermit beetle’s Mediterranean populations, specifically by pursuing the following aims:
1. testing capture methods to detect the occurrence of O.
eremita and assessing its population status;
2. describing its habitat requirements;
Introduction
9
1.5 References
Alexander KNA, Green EE, Key R (1996) The management of over mature tree populations for nature conservation - the basic guidelines. In: Read HJ (ed) Pollard and Veteran Tree Management II. Corporation of London, London
Araya K (1993) Relationship between the decay types of dead wood and occurrence of lucanid beetles (Coleoptera: Lucanidae). Appl Entomol Zool 28:27-33
Audisio P, Brustel H, Carpaneto GM, Coletti G, Mancini E, Piattella E, Trizzino M, Dutto M, Antonini G, De Biase A (2007) Updating the taxonomy and distribution of the european
Osmoderma, and strategies for their conservation (Coleoptera,
Scarabaeidae, Cetoniinae). Fragm Entomol 39:273-290
Bengtsson J, Nilsson SG, Franc A, Menozzi P (2000) Biodiversity, disturbances, ecosystem function and management of European forests. For Ecol Manag 132:39-50
Berglund H, O’Hara RB, Jonsson BG (2009) Quantifying habitat requirements of tree-living species in fragmented boreal forests with Bayesian methods. Conserv Biol 5:1127-1137
Caro T, O’Doherty G (1999) On the use of surrogate species in conservation biology. Conserv Biol 13:805-814
Carpaneto GM, Mazziotta A, Coletti G, Luiselli L, Audisio P (2010) Conflict between insect conservation and public safety: the case study of a saproxylic beetle (Osmoderma eremita) in urban parks. J Insect Conserv 14:555-565
Crozier RH, Agapow P, Pedersen K (1999) Toward complete biodiversity assessment: an evaluation of the subterranean bacterial communities in the Oklo region of the sole surviving nuclear reactor. FEMS Microbiol Ecol 28:325-334
Dajoz R (1980) Écologie des insectes forestrièrs. Gauthier-Villars, Paris
Davies ZG, Tyler C, Stewart GB, Pullin AS (2008). Are current management recommendations for saproxylic invertebrates effective? A systematic review. Biodivers Conserv 17:209-234 Dover J, Settele J (2009) The influences of landscape structure on
butterfly distribution and movement: a review. J Insect Conserv 13:3-27
Dubois G, Vignon V (2008) First results on radio-tracking of Hermit beetle, Osmoderma eremita (Coleoptera: Cetoniidae) in chestnut
CHAPTER 1
10
orchards of the northwest of France. Rev Ecol (Terre Vie) 63:123-130
Dubois GF, Le Gouar PJ, Delettre YR, Brustel H, Vernon P (2010) Sex-biased and body condition dependent dispersal capacity in the endangered saproxylic beetle Osmoderma eremita
(Coleoptera: Cetoniidae). J Insect Conserv 14:679-687
Dubois GF, Vignon V, Delettre YR, Rantier Y, Vernon P, Burel F (2009) Factors affecting the occurrence of the endangered saproxylic beetle Osmoderma eremita (Scopoli, 1763) (Coleoptera: Cetoniidae) in an agricultural landscape. Landsc Urban Plann 91:152-159
Erwin TL (1982) Tropical forests: their richness in coleoptera and other species. Coleopt Bull 36:74-75
Gibbons P, Lindenmayer D (2002) Tree hollows and wildlife conservation in Australia. CSIRO Publishing, Collingwood Gill FB (1995) Ornithology, 2nd ed. W.H. Freeman and Company,
New York
Hannah L, Carr JL, Lankerani A (1995) Human disturbance and natural habitat: level analysis of a global data set. Biodivers Conserv 4:128-155
Harding PT, Rose F (1986) Pasture–woodlands in lowland Britain. A review of their importance for wildlife conservation. Institute of Terrestrial Ecology, Huntingdon
Harrison S, Murhpy D, Ehrlich PR (1988) Distribution of the Bay checkerspot butterfly Euphydryas editha bayensis: evidence for a metapopulation model. Am Nat 132:360-382
Hedin J, Ranius T (2002). Using radio telemetry to study dispersal of the beetle Osmoderma eremita, an inhabitant of tree hollows.
Comput Electron Agric 35:171-180
Hedin J, Ranius T, Nilsson G, Smith G (2008) Restricted dispersal in a flying beetle assessed by telemetry. Biodivers Conserv 17:675-684
Jonsell M, Weslien J, Ehnström B (1998) Substrate requirements of red-listed saproxylic invertebrates in Sweden. Biodivers Conserv 7:749-764
Jönsson N, 2003. Situation and habitat preference of Hermit beetle,
Osmoderma eremita, on the island Hallands Väderö. Inst F
Introduction
11
Jönsson N, Méndez M, Ranius T (2004) Nutrient richness of wood mould in tree hollows with the Scarabaeid beetle Osmoderma
eremita. Anim Biodivers Conserv 27:79-82
Kelner-Pillault S (1974) Étude écologique du peuplement entomologique des terraux d’arbres creux (chataignerset saules). B Ecol 5:123-56
Komonen A, Jonsell M, Ranius T (2008) Red-listing saproxylic beetles in Fennoscandia: current status and future perspectives. Endang Species Res 6:149-154
Kosinski Z (2006) Factors affecting the occurrence of middle spotted and great spotted woodpeckers in deciduous forests — a case study from Poland. Ann Zool Fenn 43:198-210
Larsson MC, Svensson GP (2009) Pheromone Monitoring of Rare and Threatened Insects: Exploiting a Pheromone–Kairomone System to Estimate Prey and Predator Abundance. Conserv Biol 6:1516-1525
Levins R (1969) Some demographic and genetic consequences of environmental heterogeneity for biological control. Bull Ent Soc Am 15:237-240
Lindhe A, Lindelöw Å (2004) Cut high stumps of spruce, birch, aspen and oak as breeding substrates for saproxylic beetles. For Ecol Manag 203:1-20
Luce JM (1997) Osmoderma eremita (Scopoli, 1763). In: van Helsdingen PJ, Willemse L, Speight MCD (eds) Background information on invertebrates of the Habitat Directive and the Bern Convention. Part I: Crustacea, Coleoptera and Lepidoptera. Strasburg: Council of Europe. Nature and Environment 79:64-69 Majer JD, Recher HF, Postle AC (1994) Comparison of arthropod
species richness in eastern and western Australian canopies: a contribution to the species number debate. Mem Queensl Mus 36:121-131
Nieto A, Alexander KNA (2010) European Red List of Saproxylic Beetles. Publications Office of the European Union, Luxembourg Nieto A, Mannerkoski I, Putchkov A, Tykarski P, Mason F, Dodelin
B, Tezcan S (2009) Osmoderma eremita. In: IUCN 2010. IUCN Red List of Threatened Species. Version 2010.4. <www.iucnredlist.org>. Downloaded on 18 March 2011
Nilsson SG, Hedin J, Nicklasson M (2001) Biodiversity and its assessment in boreal and nemoral forests. Scand J For Res Suppl 3:10-26
CHAPTER 1
12
Oleksa A, Ulrich W, Gawroński R (2007) Host tree preferences of hermit beetles (Osmoderma erermita Scop., Coleoptera: Scarabaeidae) in a network of rural avenues in Poland. Pol J Ecol 55:315-323
Perlin J (1988) A Forest Journey. Norton, New York
Ranius T (2000) Minimum viable metapopulation size of a beetle,
Osmoderma eremita, living in tree hollows. Anim Conserv
3:37-43
Ranius T (2001) Constancy and asynchrony of Osmoderma eremita populations in tree hollows. Oecologia 126:208-215
Ranius T (2002) Osmoderma eremita as an indicator of species richness of beetles in tree hollows. Biodivers Conserv 11:931-941 Ranius T (2006) Measuring the dispersal of saproxylic insects: a key
charateristic for their conservation. Popul Ecol 48:177-188 Ranius T (2007) Extinction risks in metapopulations of a beetle
inhabiting hollow trees predicted from time series. Ecography 30:716-726
Ranius T, Hedin J (2001) The dispersal rate of a beetle, Osmoderma
eremita, living in tree hollows. Oecologia 126:363-370
Ranius T, Jansson N (2000) The influence of forest regrowth, original canopy cover and tree size on saproxylic beetles associated with old oaks. Biol Conserv 95:85-94
Ranius T, Nilsson SG (1997) Habitat of Osmoderma eremita Scop. (Coleoptera: Scarabaeidae), a beetle living in hollow trees. J Insect Conserv 1:193-204
Ranius T, Johansson V, Fahrig L (2011) Predicting spatial occurrence of beetles and pseudoscorpions in hollow oaks in southeastern Sweden. Biodivers Conserv 20:2027-2040
Ranius T, Niklasson M, Berg N (2009) Development of tree hollows in peduncolate oak (Quercus robur). For Ecol Manag 257:303-310
Ranius T, Aguado LO, Antonsson K, Audisio P, Ballerio A, Carpaneto GM, Chobot K, Gjurašin B, Hanssen O, Huijbregts H, Lakatos F, Martin O, Neculiseanu Z, Nikitsky NB, Paill W, Pirnat A, Rizun V, Ruicnescu A, Stegner J, Süda I, Szwako P, Tamutis V, Telnov D, Tsinkevich V, Versteirt V, Vignon V, Vögeli M, Zach P (2005) Osmoderma eremita (Coleoptera, Scarabaeidae, Cetoniinae) in Europe. Anim Biodivers Conserv 28:1-44
Introduction
13
Ruffo S, Stoch F (2006) Checklist and distribution of the Italian fauna. Memorie del Museo Civico di Storia Naturale di Verona, 2.serie, Sezione Scienze della Vita 17, with CD-ROM
Siitonen J (2001) Forest management, coarse woody debris and saproxylic organisms: Fennoscandian boreal forests as an example. Ecol Bull 49:11-41
Siitonen J, Saaristo L (2000) Habitat requirements and conservation of Phyto kolwensis, a beetle species of old-growth forest. Biol Conserv 94:211-220
Simberloff D (1998) Flagships, umbrellas, and keystones: is single-species management passe in the landscape era? Biol Conserv 83:247-257
Speight MCD (1989) Saproxylic invertebrates and their conservation. Council of Europe, Strasbourg
Svensson GP, Larsson MC, Hedin J (2003) Air sampling of its pheromone to monitor the occurrence of Osmoderma eremita, a threatened beetle inhabiting hollow trees. J Insect Conserv 7:189-198
Svensson GP, Larsson MC, Hedin J (2004) Attraction of the larval predator Elater ferrugineus to the sex pheromone of its prey,
Osmoderma eremita, and its implications for conservation
biology. J Chem Ecol 30:353-363
Svensson GP, Sahlin U, Brage B, Larsson MC (2011) Should I stay or should I go? Modelling dispersal distances in a threatened saproxylic beetle, Osmoderma eremita, based on pheromone capture and radio telemetry. Biodivers Conserv doi:10.1007/s10531-011-0150-9
Tauzin P (2005) Ethology and distribution of the "Hermit beetle" in France (Coleoptera, Cetoniiidae, Trichiinae, Osmodermatini). Cetoniimania 4:131-153
Thomas CD (1994) Extinction, colonization, and metapopulations: environmental tracking by rare species. Conserv Biol 8:373-378 Torsvik V, Goksoyr J, Daae F (1990) High diversity in DNA of soil
bacteria. Appl Environ Microbiol 56:782-787
World Commission on Forests and Sustainable Development (1999) Our forests our future. Report of the World Commission on Forests and Sustainable Development. Cambridge University, Cambridge
CHAPTER 1
Capture methods and population assessment
17
CHAPTER 2
Surveying an endangered saproxylic beetle, Osmoderma eremita, in Mediterranean woodlands: a comparison between different capture methods
Authors: Stefano Chiaria, Agnese Zaulia, Adriano Mazziottab, Luca Luisellic, Paolo
Audisiod, Giuseppe M. Carpanetoa
Affiliation:
a Department of Environmental Biology, University Roma Tre, Viale G. Marconi 446,
00146 Rome, Italy. [email protected], [email protected],
b Department of Biological and Environmental Sciences, University of Jyväskylä, POB 35, 40014 Jyväskylä, Finland. [email protected]
c Centre of Environmental Studies Demetra s.r.l, Eni spa Environmental Department; via Olona 7, 00198 Rome, Italy. [email protected]
d Department of Biology and Biotechnologies ‘Charles Darwin’, University of Rome La Sapienza, Rome, Italy. [email protected]
Corresponding author:
Stefano Chiari, [email protected], Department of Environmental Biology, University Roma Tre, Viale G. Marconi 446, 00146 Rome, Italy. Mobile: +39 3293730889, Fax: +39 06 57336321.
Abstract Measuring population size is riddled with difficulties for wildlife biologists
and managers, and in the case of rare species, it is sometimes practically impossible to estimate abundance, whereas estimation of occupancy is still possible. Furthermore, obtaining reliable population size estimates is not straightforward, as different sampling techniques can give misleading results. A mark-recapture study of Osmoderma eremita, an endangered saproxylic beetle, was performed in central Italy, the southernmost part of its distributional range. Four capture methods were applied on 116 hollow trees to assess their detection probabilities and comparing population size estimates. The modelling approach suggest that there was a strong evidence of detection probability differences among the methods. Despite the use of pheromone and manipulation of the beetles, the capture histories were not affected by phenomena of trap-happiness or trap-shyness. Population size estimates obtained by different capture methods showed variation in abundance and precision. The estimated number of adults per tree, using the whole data set, was 0.5 and 0.2 by closed and open population models, respectively. Pitfall trap was found the optimal method to detect the occurrence of this species. In Italy, a single population of O. eremita is widespread on the landscape, and include beetles from more than one hollow tree. Thus, conservation efforts for this species should not focus on preserving few and isolated monumental hollow trees, but should be extended to large stands, especially in the southernmost areas, where local extinction is an imminent risk, and in many cases already occurring.
Keywords Coleoptera Scarabaeidae, Conservation, Dead wood, Occupancy,
CHAPTER 2
18
Introduction
Estimation of population size is riddled with difficulties for wildlife biologists and managers (Krebs 2009), despite unbiased monitoring of species abundance, in space and time, is crucial to determine extinction risk for threatened species (Schultz and Hammond 2003). Insects and other invertebrates deserve special attention because they are the richest and most diverse group of organisms, whose extinction rate is still largely unknown (Thomas et al. 2004). Trap methods have been widely used for sampling animal populations in the wild, including sampling insects in forest ecosystems (Leather 2005). Trap types used to catch forest insects could be divided into two categories: passive and active traps. A passive trap is assumed be neutral; on the contrary, active traps attract insects by chemical lures, baits, or even colour (Leather 2005). However, the use of passive or attractive traps can make the animals ‘trap-shy’ or ‘trap-happy’, thus biasing the assumption of constant probability of trapping success, which is necessary for every trapping survey protocol. Indeed, using passive or attractive traps, the probability of capture tends to decrease with time in some species (Amstrup et al. 2005), or even increase with time for other species (Sutherland 2006).
Saproxylic beetles have been proposed as indicator species of forest integrity (Speight 1989; Nilsson et al. 2001) because they are highly dependent on dead wood, and are therefore particularly sensitive to forest management practices (Siitonen 2001). Unfortunately, the understanding of population characteristics of saproxylic beetles is poor at its best, and largely based on anecdotal observations (Komonen et al. 2008).
Osmoderma eremita (Scopoli, 1763, Coleoptera: Scarabaeidae) is
a saproxylic beetle listed in the IUCN Red List of Threatened Species (Nieto et al. 2009) and in the EU Habitats Directive as a priority species of community interest. In nature conservation working on a single species is important, as it is more likely to be protected by law and it is easier to assess and monitor than groups of species (Caro and O’Doherty 1999; Simberloff 1998). For that reason O. eremita was proposed as umbrella species (Ranius 2002). However, the populations status of O. eremita was mostly studied in Sweden, the northern part of its distribution range, first using passive traps (i.e. pitfall traps) (Ranius 2000, 2001, 2007), then by attractive traps (i.e. pheromone traps) (Larsson and Svensson 2009, 2011). No study on
Capture methods and population assessment
19
the population status of this species has so far been conducted in the southern part of its range, i.e. in southern Europe.
Since considerable efforts are devoted to preserve dead wood and the associated insect fauna, quantitative information on population size, structure, and dynamics of forest insects are urgently needed (Komonen et al. 2008). Nevertheless, wildlife management and conservation biology interested in understanding and managing animal population often clash with a lack of rigorous methods for estimating quantities. The general concept of occupancy (i.e., locations where the species is present) is used much more widely than simply in monitoring as a surrogate for abundance (MacKenzie et al. 2006), especially in large-scale monitoring programs (Yoccoz et al. 2001). Sampling programs designed to estimate occupancy tend to require less effort than programs designed to estimate abundance (MacKenzie et al. 2002; Manley et al. 2004; Tyre et al. 2001). In the case of rare species, it is sometimes practically impossible to estimate abundance, whereas estimation of occupancy is still possible (MacKenzie et al. 2004, 2005). Thus, for reasons that include costs and necessity, occupancy is sometimes used as surrogate for abundance.
Therefore, a mark-recapture study of O. eremita was performed in central Italy, the southernmost part of its range, using four capture methods to assess their detection probabilities and comparing population size estimates. Explicitly, the following questions were addressed: 1) Are there differences in detection probability between capture methods? 2) Are capture events influenced by trap-happiness or trap-shyness? 3) Are there differences between population size estimates obtained by different capture methods? 4) What is the optimal trap method to detect the occurrence of O. eremita in Mediterranean woodlands?
Materials and Methods
Study species
O. eremita is a up to 3 cm-large flying beetle inhabiting hollow trees
of European deciduous forests. It has a relict distribution in most parts of Europe, and Italy is the southernmost limit of its range. The larvae develop in wood mould (i.e. loose rotten wood often mixed with fungi, frass and fragments of dead insects) and normally after 2 years they become pupae. The adults emerge the following year and
CHAPTER 2
20
fly in summer, since June. Thus, development normally takes 3 years and adults live in nature with a maximum of about one month (Ranius et al. 2005). O. eremita usually do not overwinter, thus our population estimates should be based on a single cohort of adult beetles. Males produce a pheromone, with a characteristic fruity odour, like apricot or peach, to attract females, and can also be utilized by other saproxylic beetles as kairomone or cue factor in habitat selection (Svensson et al. 2004). O. eremita was considered both as an indicator of saproxylic species richness and as a keystone species (Ranius 2002). This may be because O. eremita affects the rotten wood habitat both physically and chemically, in a favourable way for other species (Jönsson et al. 2004).
Study area
The study area was Forcella Buana (UTM Zone 33 T, WGS84, 362621 4584425; c. 800 m a.s.l.), an open pasture woodland characterized by an intense livestock-grazing activity, located on Mount Latiglia (southern Latium). Hollow trees were searched systematically through the area and then a subsample (n = 116) was randomly select to set the traps. The subsample size was selected to be able to check the maximum number of traps every day. The study trees were distributed across an area of 25 ha, between 740 and 928 m a.s.l., and belonged to six broad-leaf species: Ostrya carpinifolia (n = 93), Acer obtusatum (n = 12), Quercus ilex (n = 8), Acer
monspessulanum (n = 1), Fraxinus ornus (n = 1), and Quercus pubescens (n = 1). Each tree was marked and georeferenced using a
Garmin GPS (MAP 60 CSX) (Fig. 1). Field work
Adult beetles were sampled with three different traps, two actives and one passive. As active traps were used Black Cross Window Traps (BCWT) and Interception Air Traps (IAT), both baited with a neat racemic mixture of γ-decalactone (Sigma-Aldrich, USA). Pheromone dispensers for traps were 2 ml plastic eppendorf vials with cut strings of cotton as wicks, loaded with 1200 µl of the racemic mixture. The BCWT, the same as those used by Svensson and Larsson (2008), consisting of two black plastic sheets (25 cm height×30 cm width, 3 mm thickness) arranged in a cross and attached perpendicular to a plastic funnel (upper diameter 30 cm,
Capture methods and population assessment
21
Fig. 1 Overview of the study site, an open pasture woodland located
on Mount Latiglia (central Italy), the southernmost limit of
Osmoderma eremita distributional range. The dashed line delimits
the perimeter where sampled hollow trees were located
neck diameter 4 cm) leading down to a 0.5 l white plastic bottle. The IAT traps consisting of a transparent plastic shield (18.5 cm height x 12.5 cm width, 3 mm thickness) with a plastic dust-funnel (upper diameter 12.5 cm, neck diameter 2.8 cm), leading down to a 0.5 l white plastic bottle. The BCWT were placed on the trunk, suspended from tree branches, at the height of the hollow, while the IAT were placed in front of the entrance hole of a cavity. As passive traps were used Pitfall Traps (PT), empty jars placed inside the hollow, with the opening at the level of the wood mould surface (Ranius 2001). PT catch beetles that are walking on the wood mould surface inside the cavities, while IAT and BCWT capture flying beetles outside the cavity.
The traps were set on each tree from the middle of June to the first week of August 2009 and checked every two days. Adults of O.
eremita were also searched systematically by visual inspection of
hollows and trunks; later the catch performed in this way will be mentioned using the abbreviation VES (Visual Encounter Surveys). At first capture each elytron of the beetles was marked by a small drill (Dremel Lithium Cordless 8000JE). No beetle was damaged by the marking procedure. Sex was determined by examining the pronotum; the males has two distinct ridges while the females has only a slight sign of the same convex structure (Hansen 1925). After
CHAPTER 2
22
the marking procedure, beetles were released in the same hollow tree where they had been captured.
Data analyses
Capture methods
Occupancy models for multiple detection methods permit estimation of occupancy at two spatial scales: the larger scale corresponds to species’ use of a sample site (ψ), whereas the smaller scale corresponds to presence of the species at the local sample station (θ). Moreover, this approach permits simultaneous use of data from all methods for inference about method-specific detection probabilities (p̂T) (Nichols et al. 2008). Therefore, first a large-scale occupancy
probability (ψ) was explored by condensing detections from each capture method and fitting single species, single season, multi-method model to the O. eremita data. Then, the detection probability estimate (p̂ ) was calculated applying the single species, single season,
multi-method model separately to each capture method (T ). To describe the processes that gave rise to the detection data eight a priori models were considered. Detection probability was modelled as constant over time and detection methods (p), as time-independent but different among methods (ps), as time-dependent but constant among methods (pt), or with method as an additive effect with time
(ps+t). Models with multiplicative effects of method and time are
possible, but were hypothesized to be unnecessary for these data. Small-scale occupancy was modelled as either time-independent (θ) or time-dependent (θt). Estimates of θ could reflect a number of influences including range size and movement distances, seasonal and daily activity patterns, or local densities. Models were fit and maximum-likelihood estimates were obtained using the program PRESENCE (Hines and MacKenzie 2004).
Population size estimates
The estimated number of adults, that emerged during the season in the study area, was hereby named as population size. Population size estimates were generated with male and female data pooled. This was necessary given the relatively small sample sizes obtained during the field study. Estimates were calculated using separately information
Capture methods and population assessment
23
from each capture method, from each trap method combined with VES, and from all capture methods combined together.
Population size was estimated by capture-recapture data using both closed population models (Craig 1953; Otis et al. 1978) and Cormack-Jolly-Seber open population model method (Jolly 1965; see also Southwood 1978). These alternative methods were used in order to yield a population estimate from different, independent models and hence to make more robust estimates. For the closed population models, the hypothesis of population closure was verified by testing the null hypothesis that the population was not closed. Thus, the proportions of marked individuals for each occasion were ranked and the Pearson correlation coefficient was calculated (Sutherland 2006). Then, the assumption of equal catchability, with the distribution of captures between individuals conforming to a Poisson distribution, was verified by performing the Goodness-Of-Fit (GOF) test (Sutherland 2006).
All the models were built using the program MARK (White and Burnham 1999). The program MARK, for each model, beside the estimate of the parameters, computes the Akaike’s Information Criterion corrected for small-size samples (AICc), a measure of goodness of fit of the model combining likelihood and complexity (Burnham and Anderson 2002). The model with the highest support for the capture-recapture data was assumed to be the one with the lowest value of the AICc (Burnham and Anderson 2002).
The coefficient of variation (CV) was calculated as the standard error divided by the number of individuals estimated and indicates the precision of the population size estimate.
The number of adults per tree was calculated using the estimated population sizes obtained (from the whole dataset), for each model.
Trap index
An empirical index was developed in order to rank the different trap methods on the basis of two main aspects: the Efficacy and the
Efficiency, as the probability of detecting the species and the
performance of a task in the optimal way possible, respectively. The
Efficacy (p̂T) corresponded to the results of the occupancy models for
multiple detection methods. The Efficiency (
( )
6 1 T i ig
=∑
), according toCHAPTER 2
24
Alinvi et al. (2007), was calculated by choosing 6 parameters (i = from 1 to 6) of costs (1 = material costs; 2 = construction time prior the field; 3 = size of the trap, linked to the carriage; 4 = construction time in field; 5 = time to check trap in field and restart the trap; 6 = sensibility to the damage). To each parameter (i ), for every trap method (T ), a score (g), from 1 to 3 (1 ≤ gi(T ) ≤ 3), was assigned
based on experience from the study. The parameters are related to each other and a low score corresponds to high efficiency, i.e. low cost, least time, low sensibility, etc. (Alinvi et al. 2007). To determine which parameters were more important, each one was weighted (wi = weight) assigning a value between 1 and 4 (1 =
minimum weight; 2 = medium low weight; 3 = medium high weight; 4 = maximum weight). High values correspond to high importance, i.e. if a parameter has a value of wi = 4, it is the most important. The
Trap Index (TI) for each trap type (T ) was calculated as:
( )
6 1ˆ
T T i i ip
TI
g
w
==
∑
The highest score of TI corresponds to the optimal trap method in terms of both Efficacy and Efficiency.
Results
Mark-recapture
On the whole, 65 captures of 40 individuals (10 males, 30 females) of O. eremita were performed (Table 1). Beetles were present in 33% (38/116) of sampled hollow trees. Of 25 recaptures, 12 were carried out in the same tree as the previous capture, whereas 13 took place in a different tree. The female captures outnumbered males captures (P = 0.0002, Fisher’s exact test). The longest period elapsed between the first and the last capture was 19 days for males and 17 for females. Of the recaptured males, 50% were recaptured only once, 20% twice and 30% three times. Of the recaptured females, 66% were recaptured only once, 17% twice, 10% three times and 7% four times. The mean time between recaptures was 4.8 days for males and 4.2 days for females.
Capture methods and population assessment
25
Table 1 Summary of mark-recapture data obtained during the study
of Osmoderma eremita in Central Italy with different capture methods (BCWT = Black Cross Window Traps; IAT = Interception Air Traps; PT = Pitfall Traps; VES = Visual Encounter Surveys)
Method Marked beetles (♂/♀) Capture events (♂/♀) BCWT 4/10 4/19 IAT 0/2 0/3 PT 2/17 5/22 VES 4/1 9/3 Capture methods
Estimated large-scale probabilities of occupancy was low (ψ = 0.29). Model selection statistics (Table 2) provided a strong evidence that occupancy probabilities were influenced by sampling method (s) [summed weights for ψ, θ, ps model = 0.997]. All the capture methods were consistently poor at detecting O. eremita with model-averaged detection probabilities ≤ 0.10 in the top model (Table 3). BCWT and PT performed better [model averaged p̂BCWT = p̂PT = 0.04,
SE(p̂BCWT) = SE(p̂PT) = 0.01] than VES and IAT [model averaged p̂VE
= 0.02, SE(p̂VE) = 0.01; model averaged p̂IAT = 0.01, SE(p̂IAT) = 0.00]
(Table 3).
Population size estimates
The null hypothesis that the population was not closed was rejected (Pearson correlation coefficient: N = 11, rP = -0.53, P < 0.005). The
assumption of equal catchability was accepted (GOF test: G = 3.50, df = 2, P > 0.05).
The population size estimates with closed population models were reported in Table 4, and were similar for the Craig (1953) and the Otis et al. (1978) models. In most cases (6 out of 7) the best-fitting Otis model was M0 (Table 5), indicating that capture histories
were not affected by phenomena of trap-happiness or trap-shyness. Using the Craig (1953) and the M0 Otis et al. (1978) models the total
population size was estimated to be 60 (range = 44-76) and 57 individuals (range = 47-78), respectively. The estimated number of
CHAPTER 2
26
adults per tree was 0.5 both by Craig (1953) and M0 Otis et al. (1978)
models.
The survey-specific population estimates were different using Cormack-Jolly-Seber model for open populations (Jolly 1965; see also Southwood 1978) (Table 6), and the mean population size was 22 individuals. The considerable differences in the survey-specific population estimates (Fig. 2) suggest that assumption of closed population may not be really solid in this case of study. The estimated number of adults per tree was 0.2 by Cormack-Jolly-Seber model (Jolly 1965; see also Southwood 1978).
Table 2 Summary of model selection statistics for the models of
Osmoderma eremita capture data during the season 2009. K
represents the number of parameters in the model and −2Log (L) is twice the negative log-likelihood value. Small sample Akaike Information Criteria (AICc) were calculated for each model, conservatively using the number of detection arrays (sample station sites) as the effective sample size (S = 116). Relative AICc values and Akaike weight, w, are reported for each model (∆AICc represents the difference in AICc value relative to the top model, Burnham & Anderson 2002). Detection probabilities may vary among method (s) or sampling occasion (t)
Model K -2Log (L) ΔAICc w
ψ, θ, ps 6 597.35 0.00 0.997 ψ, θ, p 3 614.99 11.64 0.003 ψ, θ, ps+t 31 568.63 21.28 0.000 ψ, θt, ps 31 569.20 21.85 0.000 ψ, θ, pt 28 586.42 33.07 0.000 ψ, θt, p 28 587.13 33.78 0.000 ψ, θt, ps+t 56 564.17 66.82 0.000 ψ, θt, pt 53 582.27 78.92 0.000
Capture methods and population assessment
27
Table 3 Osmoderma eremita detection probability estimates p̂ and
associated standard errors (in parenthesis) are given for the multi-method models (w = Akaike’s weight for each model)
Model w p̂BCWT (SE) p̂IAT (SE) p̂PT (SE) p̂VE (SE)
ψ, θ, ps 0.997 0.04 (0.01) 0.01 (0.00) 0.04 (0.01) 0.02 (0.01) ψ, θ, p 0.003 0.03 (0.01) 0.03 (0.01) 0.03 (0.01) 0.03 (0.01) ψ, θ, ps+t 0.000 0.09* (0.31) 0.02* (0.16) 0.10* (0.31) 0.06* (0.28) ψ, θt, ps 0.000 0.06 (0.02) 0.01 (0.01) 0.07 (0.02) 0.04 (0.01) ψ, θ, pt 0.000 0.08* (0.30) 0.08* (0.30) 0.08* (0.30) 0.08* (0.30) ψ, θt, p 0.000 0.05 (0.01) 0.05 (0.01) 0.05 (0.01) 0.05 (0.01) ψ, θt, ps+t 0.000 0.10* (0.32) 0.03* (0.16) 0.11* (0.32) 0.07* (0.29) ψ, θt, pt 0.000 0.09* (1.55) 0.09* (1.55) 0.09* (1.55) 0.09* (1.55)
*Parameter estimate reported is the mean value among the 26 detection probability estimates for each detection method
CHAPTER 2
28
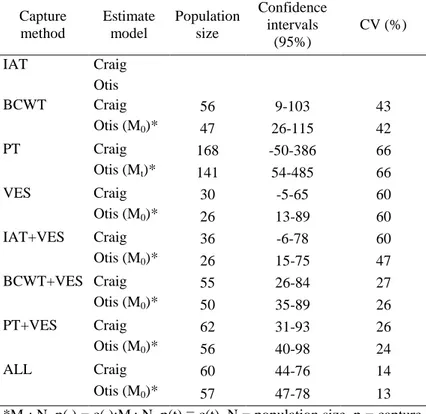
Table 4 Population size estimated by the Craig (1953) and the Otis et
al. (1978) models, using captures and recaptures data of Osmoderma
eremita from different capture methods (ALL = data combined from
all capture methods; CV = coefficient of variation) Capture method Estimate model Population size Confidence intervals (95%) CV (%) IAT Craig Otis BCWT Craig 56 9-103 43 Otis (M0)* 47 26-115 42 PT Craig 168 -50-386 66 Otis (Mt)* 141 54-485 66 VES Craig 30 -5-65 60 Otis (M0)* 26 13-89 60 IAT+VES Craig 36 -6-78 60 Otis (M0)* 26 15-75 47 BCWT+VES Craig 55 26-84 27 Otis (M0)* 50 35-89 26 PT+VES Craig 62 31-93 26 Otis (M0)* 56 40-98 24 ALL Craig 60 44-76 14 Otis (M0)* 57 47-78 13
*M0: N, p(.) = c(.);Mt: N, p(t) ≡ c(t). N = population size, p = capture
probability, c = capture probability of a marked animal; (.) indicates constant probability and (t) time dependent probability
Capture methods and population assessment
29
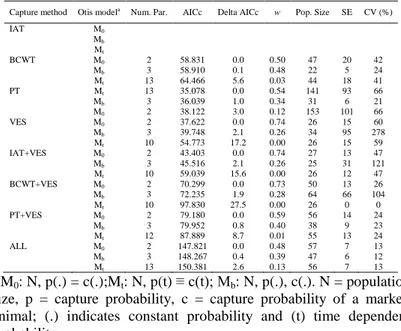
Table 5 Comparison of the three Otis et al. (1978) models that were
used to estimate the population size of Osmoderma. eremita. The models for each capture method (ALL = data combined from all capture methods) are ranked by the Akaike’s Information Criterion corrected for small-size samples (AICc) (Num. Par. = number of parameters computed; Delta AICc = difference between the models;
w = model weight; SE = standard error; CV = coefficient of
variation)
Capture method Otis modela
Num. Par. AICc Delta AICc w Pop. Size SE CV (%)
IAT M0 Mb Mt BCWT M0 2 58.831 0.0 0.50 47 20 42 Mb 3 58.910 0.1 0.48 22 5 24 Mt 13 64.466 5.6 0.03 44 18 41 PT Mt 13 35.078 0.0 0.54 141 93 66 Mb 3 36.039 1.0 0.34 31 6 21 M0 2 38.122 3.0 0.12 153 101 66 VES M0 2 37.622 0.0 0.74 26 15 60 Mb 3 39.748 2.1 0.26 34 95 278 Mt 10 54.773 17.2 0.00 26 15 59 IAT+VES M0 2 43.403 0.0 0.74 27 13 47 Mb 3 45.516 2.1 0.26 25 31 121 Mt 10 59.039 15.6 0.00 26 12 47 BCWT+VES M0 2 70.299 0.0 0.73 50 13 26 Mb 3 72.235 1.9 0.28 64 66 104 Mt 10 97.830 27.5 0.00 26 0 0 PT+VES M0 2 79.180 0.0 0.59 56 14 24 Mb 3 79.952 0.8 0.40 38 9 23 Mt 12 87.889 8.7 0.01 55 13 24 ALL M0 2 147.821 0.0 0.48 57 7 13 Mb 3 148.267 0.4 0.39 47 6 12 Mt 13 150.381 2.6 0.13 56 7 13 a M0: N, p(.) = c(.);Mt: N, p(t) ≡ c(t); Mb: N, p(.), c(.). N = population
size, p = capture probability, c = capture probability of a marked animal; (.) indicates constant probability and (t) time dependent probability
CHAPTER 2
30
Table 6 Population size estimates of Osmoderma eremita derived by
applying the Cormack-Jolly-Seber model (Jolly 1965; see also Southwood 1978), using captures and recaptures data from the whole data set (SE = standard error; CV = coefficient of variation)
Control days Proportion of recaptures Marked animals in population Population estimate SE CV 1 0 2 0.25 6 24.0 15.5 65 3 0.50 8 16.0 6.3 40 4 0.33 10 30.0 20.2 67 5 0.50 12 24.0 16.1 67 6 0.63 10 16.5 7.0 42 7 0.29 13 43.8 37.1 85 8 0.33 0.0 9 0.25 7 28.0 27.3 97 10 0.57 11 19.3 16.8 87 11 12 0.67
Fig. 2 Osmoderma eremita survey-specific population estimates
(solid line), from the middle of June to the first week of August, and their 95% confidence intervals (dotted lines) obtained by the Cormack-Jolly-Seber model (Jolly 1965; see also Southwood 1978), using captures and recaptures data from the whole data set
Capture methods and population assessment
31
Trap index
The scores (g) for each parameter (i) of Efficiency are reported in Table 7. As our study area was located on a mountain with a steep slope, reachable only on foot, in the choice of the trap we were interested in minimizing the size of the trap (i = 3), the construction time in field (i = 4) and the time to check and restart traps in the field (i = 5). To these first three parameters, we assigned the maximum value of weight (w3 = w4 = w5 = 4). A relatively high value of weight
was assigned to the damage occurred to the traps (i = 6; w6 = 3).
Least importance was assigned to the parameters linked to the costs of materials (i = 1; w1 = 2) and to the construction time before the
field work (i = 2; w2 = 1). Calculating the Trap Index value for each
trap method (TIT), the ranking was: TIPT = 0.16, TIBCWT = 0.09, TIIAT
= 0.02.
Table 7 Efficiency measures of the trap methods used in the study of
Osmoderma eremita. The methods are ranked in relation to each
other and the ranking is based on experience from the study. Low rank corresponds to high efficiency, i.e. low cost, short time, low sensibility, etc
Parameters (i) Trap method (t) BCWT IAT PT 1 Material costs 3 2 1 2 Time construction prior the field 2 3 1
3 Dimensions 2 3 1
4 Time construction in field 3 1 2 5 Time to check 3 2 1 6 Sensitivity to damage 1 3 2
Total 14 14 8
CHAPTER 2
32
Discussion
Mark-recapture
Osmoderma eremita was present only in a small number of the
hollow trees sampled in the study area (38 out of 116), and a maximum of 5 individuals were captured from the same hollow tree. A lower number of captures were registered in comparison to Sweden (Ranius 2000, 2001, 2007; Larsson and Svensson 2009, 2011), where hollow trees are usually aggregated in stands, each with a potential metapopulation (sensu Levins 1969) of interconnected local populations occupying individual trees (Ranius 2000, 2007). In our study trap catch of O. eremita at a particular hollow tree did not reflect a local population, and the assemblage of hollow trees did not correspond to a metapopulation structure. Thus, a single O. eremita population in central Italy is widespread on the landscape, and includes beetles from more than one hollow trees.
Capture methods
The basic occupancy parameter, ψ, corresponds to species occurrence at large scale and was low (0.29). As ψ is an estimate of the probability that a randomly select site of the study area is occupied (MacKenzie et al. 2004), this implies that this beetle species may have some non-negligible probability to be not revealed at the sample unit (hollow tree). Thus, although using a high number of differently designed traps, it is difficult to detect the presence of O. eremita in areas where the population is small and widespread on the landscape.
Our modelling approach suggests that there was a strong evidence of detection probability differences among the four detection methods (Table 2). All the capture methods seem poorly reliable in detecting O. eremita (Table 3). Probably the low model-averaged detection probabilities (Table 3) are influenced also by the population status of the species, other than the ability of each method in catching beetles. However, the IAT and VES seem to be not reliable methods to assess the presence of the species.
Population size estimates
The population size estimates of O. eremita, using the various capture methods, were different to each other and showed a high
Capture methods and population assessment
33
variability in their coefficient of variation (Table 4). Despite the use of attractants, the number of captures by IAT was too low and we were not able to calculate the population size with this capture method. Using only captures from the VES method were obtained underestimates of the population size, and using only PT captures were obtained overestimates, respect to estimates calculated from the whole set of data obtained by all methods. According to the precautionary principle in conservation biology, it is better to under- than overestimate the population size (Tikkamäki and Komonen 2011), but the only use of the VES method is not sufficient for a reliable assessment of the population status for O. eremita. The overestimates obtained by the PT were probably due to the captures carried out in the last part of the study period, when O. eremita showed a reduced flying activity (Chiari et al. unpubl. data) and a tendency to be captured while walking inside the cavities. The influence of time on PT captures, is supported by the best-fitting Otis model for this method, that was Mt (Table 5). Probably, the
numerous captures at the end of the study period lead to obtain overestimates with wide confidence intervals as if there was still a large number of beetles to capture. BCWT gave the most reliable estimates of population size in comparison to those obtained with the entire data set, but with a higher coefficient of variation. Population size estimates with BCWT or PT associated with VES are both very similar to those obtained with the entire data set and have a relatively small coefficient of variation. In conclusion, to reach a good assessment of the population status of O. eremita, it is enough sampling by BCWT or PT, both associated with VES.
Using the whole data set, the best fitting Otis model was M0.
Even usingdata from each capture method, and from trap method combined with VES, M0 was the model that best explained the
pattern of capture histories, except for the PT data set (Table 5). Therefore, despite the use of pheromone and manipulation of the beetles, the capture histories were not affected by phenomena of trap-happiness or trap-shyness. The only influence of attractants on the data was revealed by the difference in sex captures (Table 1), that probably reflected the sex-related behavioural differences in response to pheromone, rather than true differences in the number of males and females. In fact, males emit pheromones as a characteristic scent to attract females (Svensson et al. 2009), and the sex ratio for this species should be 1:1, as evidenced by Ranius (2001) in Sweden.