Analisi di uno scenario di flow-‐blockage
Ivan Di Piazza
Report RdS/2013/027
ANALISI DI UNO SCENARIO DI FLOW-‐BLOCKAGE
Ivan Di Piazza (ENEA) Settembre 2013
Report Ricerca di Sistema Elettrico
Accordo di Programma Ministero dello Sviluppo Economico -‐ ENEA Piano Annuale di Realizzazione 2012
Area: Produzione di energia elettrica e protezione dell'ambiente
Progetto: Sviluppo competenze scientifiche nel campo della sicurezza nucleare e collaborazione ai programmi internazionali per il nucleare di IV Generazione
Obiettivo: Sviluppo competenze scientifiche nel campo della sicurezza nucleare Responsabile del Progetto: Mariano Tarantino, ENEA
Index
1. Introduction and literature review ... 3
2. Numerical Models and methods ... 5
2.1 General Considerations ... 5
2.2 Numerical Methods ... 7
2.3 Turbulence Models ... 7
3. Flow Blockage in the hexagonal wrapped ALFRED FA ... 7
3.1 ALFRED FA CFD Model ... 7
3.2 ALFRED FA RESULTS ... 14
3.2.1 Nominal unperturbed solution ... 14
3.2.2 Central blockage: stationary solutions (C1, C2, C11, C12, C13) ... 18
3.2.3 Central blockage: transient solutions (C28, C29, C30) ... 23
3.2.4 Discussion on the relevant engineering parameters ... 24
4. Conclusions ... 26
1. Introduction and literature review
The flow blockage accident in a Fuel Assembly (FA) of a nuclear reactor consists in a partial or total occlusion of the flow passage area in a fuel sub-assembly. This leads in general to a reduced heat transfer between the FA and the coolant (compared with the heat transfer taking place in nominal conditions) potentially causing a temperature peak in the clad which can eventually lead to the fusion of the clad itself. While a partial blockage at the fuel assembly foot may be dangerous for the integrity of the FA, a modeling of the phenomena can be investigated and assessed by an integral system code in order to devise proper mitigation actions.
The most likely internal blockage in a grid-spaced bundle is at the lower spacer grid, and, if the spacer grid is positioned in the active region, a remarkable effect can be evidenced and a possible damage can occur.
In principle, in the latter case, two different effects can be distinguished:
A local effect due to the stagnation-recirculation/wake region downstream of the blockage, with a local minimum of the heat transfer and a clad temperature peak;
A global effect due to the lower mass flow rate in the blocked subchannels; this effect leads to an increase of the bulk fluid temperature with respect to the ‘unblocked’ regions and a consequent peak in the clad temperature at the end of the active region.
In Figure 1, a very conceptual representation of the flow blockage accident is shown. The flow passes the obstacle and a recirculation region with relatively low velocities ensues just downstream of the blockage. This flow pattern leads to the phenomenology described above as a local effect and a global effect.
As a consequence of the above considerations, the most critical (and conservative) case to be considered from the safety point of view is that of a blockage at the beginning of the active zone, where the local effect is present, and the global effect is maximum because the entire active length is available to heat up the bulk temperature of the coolant in the blocked subchannels.
In this report, numerical analysis will be presented of flow blockage in Heavy Liquid Metal cooled reactors fuel assemblies. Due to the crucial role of the heat transfer in the stagnation-recirculation/wake region in this context, the turbulence in this region must be carefully assessed. In fact, in the case where the turbulence thermal diffusion overcomes the molecular diffusion, the clad temperature peak downstream the blockage is largely independent of the nature of the fluid, i.e. by the Prandtl number. On the opposite, if the recirculation region is a ‘stagnation’ region with low turbulent heat transfer, the physical nature of the coolant, and in particular the Prandtl number, plays the major role in the establishment of the peak temperature. From the literature, it is not very clear which of the two phenomena is the most important, although some simplified theories assume that the turbulence dominates downstream the blockage and therefore the temperature peak is independent by the Reynolds and the Prandtl number. Probably, a systematic comparison between different coolants has not yet been performed; therefore any preliminary conclusions may not have sufficient basis.
In any case, in References, the literature specifically for flow blockage in liquid metal cooled bundles has been reported, i.e. sodium and lead, being the flow blockage phenomena in light water reactors a quite different matter because of the unity Prandtl number.
For the heavy liquid metal cooled GEN-IV reactors studied in these years by the scientific community, the flow blockage accident must be considered as one of the reference accidents, and probably the most dangerous for the core integrity. In fact, most of the know accident occurred in the LBE cooled fast reactors of the Alpha-class Russian nuclear submarines ‘, are apparently caused by flow blockage accident [1], [2].
An interesting review on flow blockage phenomena in LMFBR fuel assemblies is given in [3]. The paper gives a quite complete review of the investigations on flow blockage in sodium reactors and keeps into account all the technical and scientific development of ‘60s and ‘70s on sodium cooled fast reactors. The review especially refers to experimental and analytical investigations performed in United States and Germany, the authors develop an analytical approach to predict the flow blockage effects.
The blockages at the foot of a fuel assembly may have significant effects in the fuel assembly if coolant mass flow rate is significantly reduced and would then be easily detectable in the case of closed FA.
The effect of blockage on reactor safety depends in principle on several factors: size and location of the blockage, nature of the coolant, fuel pin power, and coolant velocity in the assembly. In closed FA, blockages in flow channels will increase the hydraulic resistance and reduce the flow rate.
Experimental data on Clinch River Breeder Reactor (CRBR), the Fast-Flux test facility (FFTF), and the German Sodium-cooled fast Reactor (SNR) are provided in the review. CRBR and FFTF have 217 fuel pins each assembly and are wire-wrapped spaced, while SNR FA consists of 169 pins in a triangular lattice, grid-spaced, and enclosed in a hexagonal wrap. The SNR is particularly interesting
for our purposes, because the reference configurations for a Lead Fast Reactor Demonstrator are grid-spaced.
With the typical approach of the ‘70s, Kirsch [4] developed a simplified theory to describe the thermo-fluid dynamic phenomena downstream the blockage. The basic assumption is that turbulent diffusion dominates both for momentum and for energy, and thus the molecular heat transfer is negligible. With this hypothesis, the author shows that for sufficiently high Reynolds and Peclet numbers, the dimensionless temperature distribution in the wake is independent of the Reynolds and the Prandtl number, i.e. by the flow and the nature of the fluid. Comparison between experimental results in sodium and water seems to partially confirm these conclusions with a difference between the two fluids of 25%. This difference is probably due to the residual influence of the coolant. Therefore, according to the author, it could be possible to have a ‘universal’ dimensionless temperature profile
function of the fraction of the flow area blocked. From this point of view, the main difference
between sodium and lead as coolant is the possible onset of boiling in sodium due to the lower boiling temperature (890 °C) with positive reactivity feedback and power excursion. In lead, with a boiling temperature of 1740 °C, this scenario is unlikely in the case of flow blockage.
It could be interesting to confirm or disconfirm these conclusions by CFD numerical simulations, i.e. by the direct solution of the Navier-Stokes equations. The only way to numerically investigate the flow blockage in realistic configurations is by the use of turbulence models, being DNS or LES not
feasible at Reynolds numbers 105 typical of the fuel assemblies. The controversial point is the ability
of the turbulence models to describe the turbulent heat transfer for liquid metal, but probably this issue has been too much emphasized in the last years, and the same turbulence models developed for unity Prandtl number fluids like ‘water’ can be largely used to compute turbulent heat transfer in low Prandtl number fluids with the same level of accuracy as in water. Moreover, the velocity fluctuations have the same nature in all the fluids, and thus the turbulence level in the wake region can be predicted for liquid metals with the same accuracy as in water. This latter prejudice justifies further theoretical studies [5, 6] in support of experimental results in the ‘80s, when computational tools were already available. Not so many CFD studies appeared in the 90’s and 00’ on the flow blockage in Liquid Metal cooled fast reactors, probably because of the decreasing importance of these kinds of reactors. In the last years, due to the growing interest in the developing of GEN-IV prototypes and Demonstrators, the interest in sodium-cooled and lead-cooled bundles is high again. Nevertheless, only a small number of CFD studies appeared in the literature and sometimes these studies adopted simplified models for the bundle (porous media) and the focus was on the whole reactor [7]. Generally, system codes like RELAP are commonly adopted by the safety analysts to compute flow blockage in reactor Fuel Assemblies [8], although the local nature of the phenomena involved does not fully justify this common practice.
2. Numerical Models and methods
2.1 General Considerations
From the arguments in section 1, it is evident that the flow blockage is basically a local phenomenon, and the main issue to investigate is the thermal-hydraulic behavior of the region downstream of the obstacle because it determines the clad temperature peak. For this reason, a local fully detailed CFD
analysis has been carried out in order to assess the impacts of a flow blockage. The viscous sub-layer
has been resolved with several points in all the simulations presented here. A value of y+1 is
guaranteed in the whole domain.
From a physical point of view, the reactivity feedback due to the temperature variation in the domain has not been considered at this stage. A constant power distribution has been considered as well, neglecting the axial power profile typical of the nuclear reactors. In addition, spacer grids have not been modeled being not very relevant for the phenomena to investigate.
The computational domain includes the active region, the non-active region upstream and downstream and the FA plenum. The wrap of the FA is modeled as well and a bypass flow is considered; the thermal conduction in the pin clad is kept into account.
Constant thermo-physical properties have been assumed for Lead at 450°C, according to Table 1. For the clad material (Ti1515) and the wrap material (T91), constant physical properties have been considered at 450 °C according to Table 2 and Table 3.
Table 1 Physical properties of Lead at 450 °C.
[kg/m3] Density 10503
[m2/s] Kinematic viscosity 1.9·10-7
k [W/mK] Thermal Conductivity 17.15
cp [J/kgK] Specific heat at constant pressure 145.9
Pr Prandtl number 0.01697
[1/K] Thermal expansion coefficient 1.137·10-4
Table 2 Physical properties of Ti1515 (Clad material) at 450 °C.
[kg/m3] Density 7800
k [W/mK] Thermal Conductivity 20.2
cp [J/kgK] Specific heat at constant pressure 565
Table 3 Physical properties of T91 (Wrap material) at 450 °C.
[kg/m3] Density 7600
k [W/mK] Thermal Conductivity 28.3
cp [J/kgK] Specific heat at constant pressure 600
The buoyancy term has been explicitly included in the momentum equation, due to the potential role of the local buoyancy in promoting heat transfer in the wake region. The exact production term in the kinetic energy equation has been included as well. Fully convergence has been reached in all the simulations presented in this paper.
2.2 Numerical Methods
The general purpose code ANSYS CFX 13 [9] was used for all the numerical simulations presented in this paper. The code employs a coupled technique, which simultaneously solves all the transport equations in the whole domain through a false time-step algorithm. The linearized system of equations is preconditioned in order to reduce all the eigenvalues to the same order of magnitude. The multi-grid approach reduces the low frequency error, converting it to a high frequency error at the finest grid level; this results in a great acceleration of convergence. Although, with this method, a single iteration is slower than a single iteration in the classical decoupled (segregated) SIMPLE approach, the number
of iterations necessary for a full convergence to a steady state is generally of the order of 102, against
typical values of 103 for decoupled algorithms. For the transient calculation, the CFL=1 criterion has
been adopted leading to a time step ~ 1 ms.
2.3 Turbulence Models
The SST (Shear Stress Transport) k- model by Menter [10] is extensively used in this paper. It is
formulated to solve the viscous sub-layer explicitly, and requires several computational grid points
inside this latter. The model applies the k- model close to the wall, and the k- model (in a k-
formulation) in the core region, with a blending function in between. It was originally designed to provide accurate predictions of flow separation under adverse pressure gradients, but has since been applied to a large variety of turbulent flows and is now the default and most commonly used model in CFX-13 and other CFD codes. This structural feature of the model to predict in a good way flow separation and recirculation gives a good confidence in applying the model to compute flow blockage in fuel subassemblies. The turbulent Prandtl number in the case of lead has been fixed to 1.1, according to the suggestion of the literature [11] and to the author’s experience [12].
3. Flow Blockage in the hexagonal wrapped ALFRED FA
3.1 ALFRED FA CFD Model
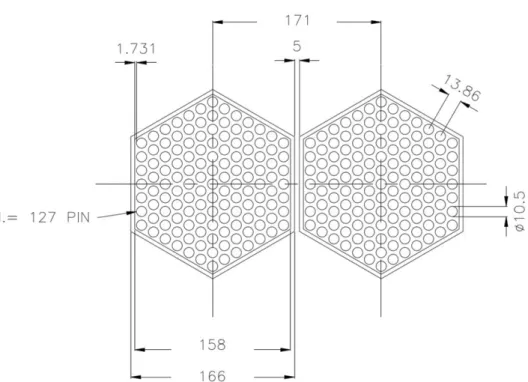
The Fuel Assembly of the ALFRED Lead cooled reactor has been considered here as the reference configuration to investigate. The fuel assembly is a wrapped hexagonal lattice bundle with 127 rods, grid-spaced, with rod diameter d=10.5 mm, pitch to diameter ratio p/d=1.32 and an active length L=0.6
m. The total thermal power of the reactor is Q~300 MW.
A sketch of the fuel assembly seen from the top is shown in Figure 2, while in
Table 4 the main geometrical and physical parameters for the ALFRED FA are reported. Figure 3 reports a lateral view sketch of the ALFRED Fuel Assembly.
A flow blockage at the beginning of the active region has been considered here as the most critical case, for the reasons discussed in section 1.
For the correct description of the physical phenomena involved, the choice of the correct computational domain and boundary conditions is crucial. A wrong or superficial choice would lead to inaccurate or non-physical results. Almost the entire FA has been modeled, without any symmetry planes and including the clad and wrap thermal structures and the bypass flow.
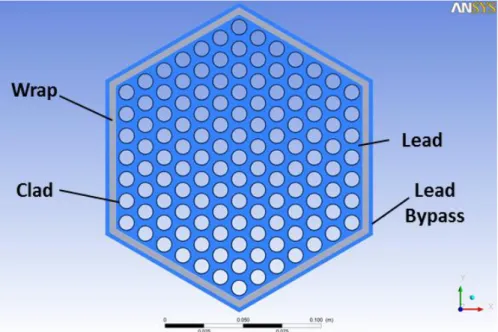
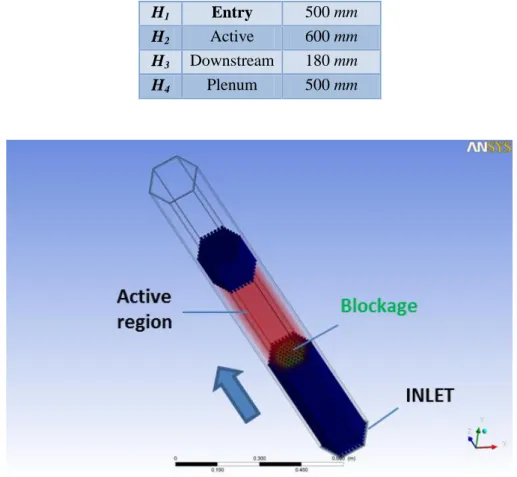
A sketch of the computational domain seen from the top is shown in Figure 4. The computational domain reproduces azimuthally the entire fuel sub-assembly, and periodic or symmetry boundary conditions are not needed. The model includes: the lead inside the FA, the pin clad, the FA wrap and the lead bypass. Symmetry boundary conditions are applied on the external side of the lead bypass. A 3D view of the computational domain modeled is shown in Figure 5. In the axial streamwise direction, the model includes: the entry active region, the active region, the downstream non-active region and the FA plenum. This latter allows to study the mixing phenomena and the detectability of the blockage. The streamwise vertical length of the different portion of the domain are summarized in Table 5.
The blockage is located at the beginning of the active region as shown in Figure 6.
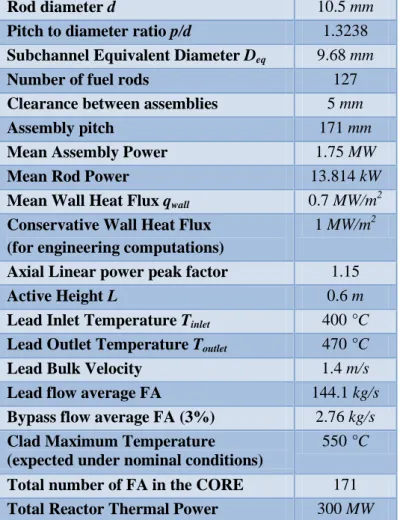
Table 4 Basic Geometrical and Thermal-hydraulic parameters of the DEMO ALFRED Core.
Rod diameter d 10.5 mm
Pitch to diameter ratio p/d 1.3238
Subchannel Equivalent Diameter Deq 9.68 mm
Number of fuel rods 127
Clearance between assemblies 5 mm
Assembly pitch 171 mm
Mean Assembly Power 1.75 MW
Mean Rod Power 13.814 kW
Mean Wall Heat Flux qwall 0.7 MW/m
2
Conservative Wall Heat Flux (for engineering computations)
1 MW/m2
Axial Linear power peak factor 1.15
Active Height L 0.6 m
Lead Inlet Temperature Tinlet 400 °C
Lead Outlet Temperature Toutlet 470 °C
Lead Bulk Velocity 1.4 m/s
Lead flow average FA 144.1 kg/s
Bypass flow average FA (3%) 2.76 kg/s
Clad Maximum Temperature (expected under nominal conditions)
550 °C
Total number of FA in the CORE 171
Total Reactor Thermal Power 300 MW
Figure 4 Computational domain for the CFD: top view.
Table 5 Main streamwise dimensions of the computational model of the ALFRED FA.
H1 Entry 500 mm
H2 Active 600 mm
H3 Downstream 180 mm
H4 Plenum 500 mm
For the unperturbed case without blockage, a total FA mass flow rate of
m
0=144.1 kg/s, constant temperature (Tinlet=400 °C), boundary conditions have been imposed at the inlet coherently with thenominal data of
Table 4 corresponding to the average FA, while pressure boundary conditions have been imposed at
the outlet. At the internal pin wall in the active region, a constant heat flux qwall=1 MW/m
2
has been imposed. This value represents a value corresponding to the highest power FA, and thus the analysis is conservative from an engineering point of view. The shape axial peaking factor (1.15) in the active region has not been considered at this preliminary stage of the design of the FA.
Moreover, a bulk volumetric source term has been evaluated from neutronic data and considered in the active part of the domain, to correctly keep into account the gamma power release. The power density imposed in the different portion of the domain are summarized in Table 6.
Table 6 Power density due to the gamma release in the FA.
Lead (FA) 10 MW/m3
Wrap 15 MW/m3
Lead (Bypass) 10 MW/m3
For the cases with flow blockage, inlet mass flow rate boundary conditions have been imposed
coherently to preliminary RELAP5 computations for different area blockage fraction . For an open
element, a blockage does not induce any flow variation in the FA, i.e. the average velocity far upstream of the blockage remains unperturbed. On the opposite, for wrapped elements like the one under investigation here, a blockage increases the hydraulic resistance of the element itself, and the mass flow rate through the element is reduced according to the fraction of the area blocked. It has to be noted that the reduction of mass flow rate is not linear with the reduction of pass-through area, therefore the value of mass flow rate used for the simulation has been provided by preliminary RELAP5 computations [13].
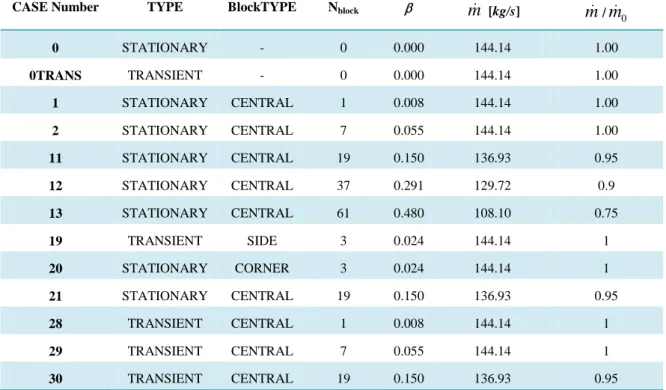
In Table 7, the computational test matrix has been reported with the following fields: case number, simulation type (Stationary/Transient), Block Type (Central, Side, Corner), Number of subchannel
blocked Nblock, blocked area fraction , inlet FA mass flow rate
m
, ratio between the mass flow ratem
and the unperturbed valuem
0=144.1 kg/s.Table 7 Test matrix adopted for the flow blockage computations in the ALFRED FA
CASE Number TYPE BlockTYPE Nblock
m
[kg/s]m
/0
m
0 STATIONARY - 0 0.000 144.14 1.00 0TRANS TRANSIENT - 0 0.000 144.14 1.00 1 STATIONARY CENTRAL 1 0.008 144.14 1.00 2 STATIONARY CENTRAL 7 0.055 144.14 1.00 11 STATIONARY CENTRAL 19 0.150 136.93 0.95 12 STATIONARY CENTRAL 37 0.291 129.72 0.9 13 STATIONARY CENTRAL 61 0.480 108.10 0.75 19 TRANSIENT SIDE 3 0.024 144.14 1 20 STATIONARY CORNER 3 0.024 144.14 1 21 STATIONARY CENTRAL 19 0.150 136.93 0.95 28 TRANSIENT CENTRAL 1 0.008 144.14 1 29 TRANSIENT CENTRAL 7 0.055 144.14 1 30 TRANSIENT CENTRAL 19 0.150 136.93 0.95The computational mesh is multi-blocks fully structured with a resolution close to the wall such to
achieve a y+ of the order of 1 for the nominal FA mass flow rate
m
0. These features guarantee highaccuracy to the model and minimize the discretization error and allow to integrate turbulence model
equations down to the viscous sublayer. The total number of nodes is around 21.5·106, with 160 nodes
in the axial direction. A mesh independence study has been carried out, but it is not reported here, confirming that the used mesh provides results that are largely mesh independent.
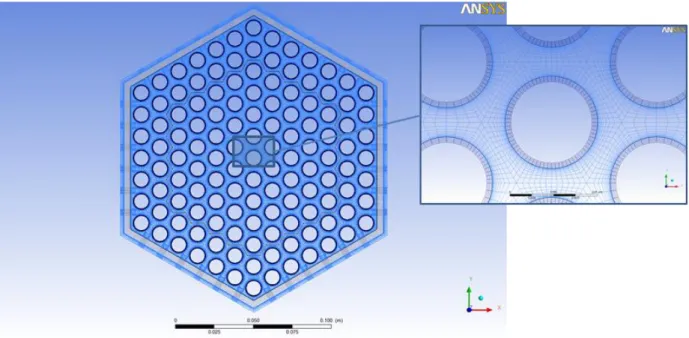
Figure 7 reports the inlet view of the computational mesh adopted, with a zoom on a pin and a subchannel. Figure 8 reports the computational mesh at the outlet section, while Figure 9 is a perspective view of the active region.
Figure 8 Computational mesh adopted: FA outlet.
Figure 9 Computational mesh adopted: perspective view of the rods. Figure 7 Computational mesh adopted: FA inlet.
3.2 ALFRED FA RESULTS
3.2.1 Nominal unperturbed solution
The nominal unperturbed solution without any blockage is analyzed as a reference to check if the model provides reasonable results and to have the baseline to evaluate the effect of the blockage. The case has been conventionally named case 0 (see Table 7).
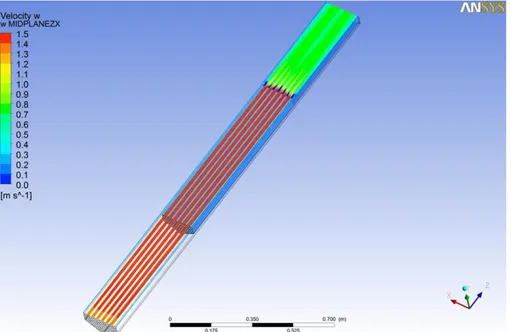
Figure 10 shows the w vertical velocity contours in a longitudinal transversal plane ZX of the computational domain. It is remarkable that the flow becomes hydro-dynamically fully developed well before the beginning of the active region, and it confirms that the mechanical entry length is less than 10 hydraulic diameters. The other remarkable features are the mixing phenomena at the beginning of the plenum region, see the zoom view in Figure 11.
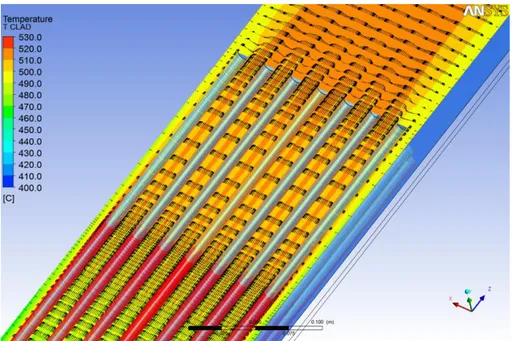
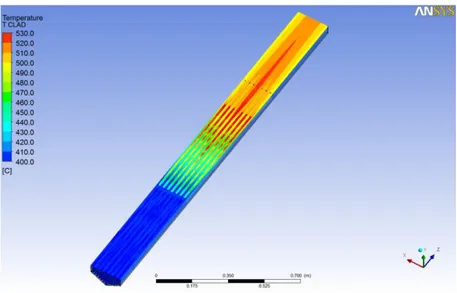
Figure 12 shows the temperature contours in the fluid and in the thermal structures in the same longitudinal transversal plane ZX. The overall vertical temperature gradient is clearly visible and the outlet bulk temperature is about 503 °C as it is expected from a simple thermal balance based on the imposed heat flux and mass flow rate. Temperatures up to 530°C have been reached at the end of the active region in the clad. Figure 13 shows a zoom view of the temperature contours in the same ZX plane with the velocity vector superimposed.
Figure 14 shows the vertical velocity contours in the XY plane in the middle of the active region, where the small hydrodynamic boundary layers close to the pins can be observed. In the proximity of the wrap, the contour shape is deformed due to the no-slip effect of the wall, both in the side and in the corner regions, with bulk values of 0.8-1 m/s in the side subchannels compared to 1.5-1.6 m/s in the internal ones.
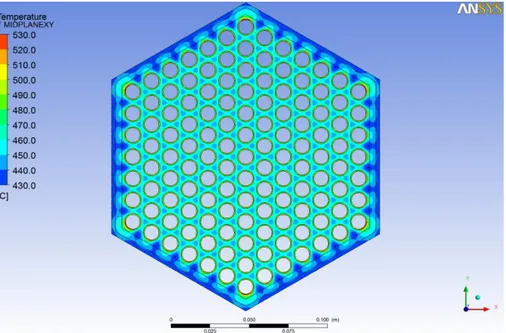
Figure 15 shows the temperature contours in the XY plane in the middle of the active region. The central channel-wall temperature difference is of the order of ~50°C, while the bulk-wall temperature
difference is ~40 °C with heat transfer coefficients based on this difference HTC~2.4·104 W/m2K and
Nusselt numbers Nu~14. These data are coherent with the Nusselt numbers expected in liquid metals for the present Peclet number Pe~1200.
In Figure 15, a residual thermal coupling between subchannels with a non-uniform azimuthal wall temperature distribution can be clearly observed. The most relevant effect is the presence of the typical cold fluid regions in the subchannels close to the FA wall. This is an effect of the almost adiabatic conditions at the wall which imply a smaller power per unity mass flow rate in these subchannels with respect to the standard central subchannels. Another relevant feature is the presence of clad hot regions in the corner due to the lower heat transfer coefficient in the corner. This leads to an azimuthal temperature difference of ~50 °C in the clad of the corner pins with associated deformation and stresses.
Figure 10 Streamwise velocity contours in the symmetry ZX plane.
Figure 12 Temperature contours in the symmetry ZX plane.
Figure 13 Temperature contours in the symmetry ZX plane with superimposed velocity vectors: zoom view
Figure 14 Streamwise velocity contours in the XY plane in the middle of the active region.
3.2.2 Central blockage: stationary solutions (C1, C2, C11, C12, C13)
Several stationary solutions have been computed with different degrees of central blockage.
For case 1 of Table 7 (1 subchannel blocked), Figure 16 shows the streamwise velocity distribution in the ZX midplane. From an hydrodynamic point of view, the perturbation on the flow caused by the blockage is local with a small recirculation region downstream the blockage and a slightly reduced mass flow rate in the blocked subchannel. Figure 17 shows the temperature field in the same ZX midplane. The dominant effect is an integral effect due to the reduced mass flow rate in the blocked subchannel. This leads to a hot subchannel with the associated mixing phenomena in the plenum region, and the maximum clad temperature at the end of the active region in the blocked subchannel.
Figure 16 Streamwise velocity contours in the ZX midplane for case 1.
Figure 18 shows the streamwise velocity distribution in the ZX midplane for case 2 of Table 7 (7 subchannels blocked). From an hydrodynamic point of view, there is wake/recirculation region downstream the blockage and a reduced mass flow rate in the blocked subchannels. Figure 19 shows the temperature field in the same ZX midplane. The dominant effect is the integral effect due to the reduced mass flow rate in the blocked subchannels. This leads to hot subchannels with the associated mixing phenomena in the plenum region, and the maximum clad temperature at the end of the active region in the blocked subchannels.
Figure 18 Streamwise velocity contours in the ZX midplane for case 2.
Figure 19 Temperature contours in the ZX midplane for case 2.
For case 11, the number of subchannels blocked is 19, i.e. three ranks, and the blocked area factor
β~0.15. Figure 20 shows the streamwise velocity contours in the ZX midplane. A large recirculation
region develops downstream of the blockage. The toroidal vortex is shear-induced by the flow in the non-blocked peripheral subchannels, see zoom view in Figure 20. The recirculating vortex
downstream the blockage is elongated with an aspect ratio ~2-2.5. The central descending velocity is of the order of 0.8-1 m/s and guarantees good cooling conditions in the central pins of the blocked area downstream of the blockage. This fact is evidenced in Figure 21, where the temperature contours in the same XZ midplane are represented for case 11.
Figure 20 Streamwise velocity contours in the ZX midplane for case 11.
The maximum clad temperature downstream the blockage is not located in the central pins of the blocked region, but at the center of the toroidal recirculating vortex; therefore in the ZX midplane two maxima can be evidenced. Another temperature maximum is located at the end of the active region in the central pin. This maximum is due to the lower mass flow rate in the blocked subchannel and it can be view as an integral effect. In case 11, the clad temperature maxima downstream the blockage and at the end of the active region are of the same order, i.e. ~740 °C.
Figure 21 Temperature contours in the ZX midplane for case 11.
For case 12, with 37 subchannels blocked (4 ranks), blocked area factor β~0.29, qualitatively similar phenomena can be evidenced,. Figure 22 and Figure 23 show the streamwise velocity and temperature
contours for the ZX midplane. For this larger blockage, from the heat transfer point of view, the dominant phenomena becomes the recirculating vortex downstream of the blockage, where temperatures around 1000 °C are reached in the coolant.
Figure 22 Streamwise velocity contours in the ZX midplane for case 12.
Figure 23 Temperature contours in the ZX midplane for case 12.
Figure 24 and Figure 25 show the streamwise velocity and temperature contours for the ZX midplane for case 13, 37 subchannels (5 ranks) blocked, blocked area factor β~0.48. In this case almost 50% of the flow passage area is blocked, and a large recirculation shear-induced toroidal vortex develops downstream of the blockage section. The maximum clad temperature in the stagnation points in the vortex center is ~1500 °C.
As final remark, it can be noticed that on the maximum clad temperature the integral fluid dynamic effect due to the reduced mass flow rate in the blocked subchannel is dominant for small blockages
(β<0.1), with the clad absolute maximum temperature located at the end of the active region in the central blocked pin. For large blockages (β>0.2), the dominant phenomena is the recirculation vortex and the clad absolute maximum temperature is located downstream the blockage in the center of the vortex (stagnation point) in the peripheral pins of the blockage. In this case the maximum at the end of the active region is present but it is less important.
Figure 24 Streamwise velocity contours in the ZX midplane for case 13.
3.2.3 Central blockage: transient solutions (C28, C29, C30)
Starting from the stationary unperturbed solution case 0, some transient calculations have been carried out to verify the correctness of the stationary solutions in case of blockage. In particular, case 28, case 29, and case 30 of Table 7 refer to 1, 7 and 19 subchannels blocked respectively, and must be compared with the corresponding stationary cases 1, 2 and 11.
The monitoring points in the following graphs are located in the central subchannel of the FA, at different vertical coordinate z: P1 in the middle of the active region, P2 at the outlet of the active region, P3 at the end of the rod, P4 at the outlet section of the FA.
Figure 26 shows the streamwise velocity time behavior in some monitoring points for case 28
(Nblock=1). The time-dependent simulation actually starts at t~1.5 s, from unblocked Initial Condition
case 0 see the blue line in the figures. Figure 27 shows the temperature time dependent behavior in the
same monitoring points; Pmax shows the maximum temperature in the clad. Some relevant
considerations yield:
The hydrodynamic and thermal time scales are similar and of the order of 1-1.5 s in this case (small blockage); the maximum clad temperature is ~580 °C and this confirms results from stationary simulation case 1.
Figure 26 Streamwise velocity w against time in some monitoring points for case 28 (Nblock=1).
Figure 28 and Figure 29 show the same quantities as Figure 26 and Figure 27 for case 29 (Nblock=7). In
this case the time-dependent simulation actually starts at t~2.7 s from unblocked Initial Condition case 0, see the blue line in the figures. Hydrodynamic and thermal time scales are of the order of 1.5-2.0 s, and the maximum clad temperature is of the order of 650 °C.
Figure 28 Streamwise velocity w against time in some monitoring points for case 29 (Nblock=7).
Figure 29 Temperature against time in some monitoring points for case 29 (Nblock=7).
3.2.4 Discussion on the relevant engineering parameters
From a safety point of view, the most important parameter to monitor and detect is the maximum clad temperature. Table 8 shows the maximum clad temperatures in the recirculation region downstream
the blockage (Tmax,loc) and at the end of the active region (Tmax,end) for the stationary cases simulated.
As it was already stated, for small blockages (β<0.1) the absolute maximum clad temperatures is located at the end of the active region, while for the highest levels of blockage (β>0.2) it is located in the recirculation region downstream the blockage. From Table 8, it can be evidenced that maximum clad temperatures larger than 1000 °C can be reached for blockage area fraction β>0.3 (37 subchannels).
Regarding detectability of the blockage, a simple method could adopt thermocouples in the plenum
region of the FA. Table 8 reports the maximum transversal temperature drop Tout at the outlet section
of the modeled FA for each case. This quantity depends on the degree of blockage and on the mixing phenomena in the plenum region of the FA. The mixing phenoman can be correctly predicted by CFD
and therefore the value of Tout can be considered realistic. It is interesting to notice that small
blockages (cases 1, 2) are not easy to detect because the temperature drop does not differ very much from the unblocked case. Large blockages (cases 11, 12 ,13) with β >0.15 in principle could be detected because the temperature drop in the section reaches 100 °C or more.
Table 8 Maximum temperatures for several cases at different degree of blockage.
CASE Number TYPE BlockTYPE Nblock
m
[kg/s]m
/0
m
Tmax,loc [°C] Tmax,end [°C] Tout [°C] 0 STATIONARY - 0 0.000 144.14 1.00 442 563 18 1 STATIONARY CENTRAL 1 0.008 144.14 1.00 450 580 21 2 STATIONARY CENTRAL 7 0.055 144.14 1.00 584 605 55 11 STATIONARY CENTRAL 19 0.150 136.93 0.95 734 722 108 12 STATIONARY CENTRAL 37 0.291 129.72 0.9 1030 820 135 13 STATIONARY CENTRAL 61 0.480 108.10 0.75 1550 1250 1404. Conclusions
A CFD analysis by fully resolved RANS simulations has been carried on fluid flow and heat transfer in the case of flow blockage in heavy liquid metal cooled fuel assemblies. The hexagonal closed ALFRED FA have been considered for the study. The model includes the different FA regions (entry, active, follower, plenum), the conjugate heat transfer in the clad and the wrap, the bypass and power released by gamma. All the pins of the FA have been modeled and no special symmetry planes have been considered.
Two main effects can be distinguished in a flow blockage: a local effect in the wake/recirculation region downstream the blockage and a global effect due to the lower mass flow rate in the blocked subchannels; the former effect gives rise to a temperature peak behind the blockage and it is dominant for large blockages (β>0.2), while the latter effect determines a temperature peak at the end of the active region and it is dominant for small blockages (β<0.1).
The blockage area has been placed at the beginning of the active region, so that both overmentioned phenomena can fully take place. The mass flow rate at the different degree of blockage has been imposed from preliminary system code simulations.
Results indicate that a blockage of ~30% leads to a maximum clad temperature around 1000 °C, and this condition is reached in a characteristic time of 2 s without overshoot.
CFD simulations indicate that Blockages >15% could be detected by putting some thermocouples in the plenum region of the FA.
6. References
[1] A.V. Zrodnikov, V.I. Chitaykin, B.F. Gromov, O.G. Grigoryv, A.V. Dedoul, G.I. Toshinski,
Y.G. Dragunov, V.S. Stepanov, Use of Russian Technology of ship reactors with lead-bismuth coolant in nuclear power, Russian Federation Report XA0056274, 2000.
[2] J.M. Warden, M. Mount, N.M. Lynn, Possible Criticalities of the Marine Reactors Dumped in
the Kara Sea, Proc. 3rd International conference on the radioactivity in the arctic, Thomso, Norway,
June 1-5, 1997.
[3] J.T. Han, M.H. Fontana, Blockages in LMFBR Fuel Assemblies – A Review, Proc. Winter
Annual ASME meeting, November 27, 1977.
[4] D. Kirsch, Investigation on the Flow Temperature Distribuion Downstream of Local Coolant
Blockages in Rod Bundle Subassemblies, Nucl Eng Des, 31, pp.266-279, 1974.
[5] G.A. Klein, A. Sesonske, Heat Transport and Recirculating Flow Distribution Behind a
Normal Blockage, with Application to LMFBRS, Nucl Eng Des, 68, pp.385-395, 1981.
[6] J.D. Hooper, D.H. Wood, Flow Recovery from a Single Subchannel Blockage in a
Square-Pitched Rod Array, Nucl Eng Des, 74, pp.91-103, 1982.
[7] R.K. Maity, K. Velusamy, P. Selvaraj, P. Chellapandi, Computational fluid dynamic
investigations of partial blockage detection by core-temperature monitoring system of a sodium cooled fast reactor, Nucl Eng Des, 241, pp.4994-5008, 2011.
[8] Q. Lu, S. Qiu, G.H. Su, Flow Blockage Analysis of a channel ina a typical material test reactor
core, Nucl Eng Des, 239, pp.45-50, 2009..
[9] ANSYS CFX Release 13 User Manual.
[10] F. R. Menter, Two-equation eddy-viscosity turbulence models for engineering applications,
AIAA J, 32, pp.269-289, 1994.
[11] X. Cheng, N.I. Tak, CFD analysis of thermal-hydraulic behavior of heavy liquid metals in
sub-channels, Nucl Eng Design, 236, pp.1874-1885, 2006.
[12] M. Scarpa, CFD Thermal Hydraulic Analysis of HLM cooled rod bundles, Master Thesis
Univ. of Pisa, Italy, 2013.