ANALISI E VALUTAZIONI DI INCIDENTI
SEVERI IN LWR
(ANALYSES AND EVALUATION OF SEVERE
ACCIDENT IN LWR)
CONTENTS
1. INTRODUCTION ... 9
2. FUKUSHIMA DAICHII UNIT 1 SENSITIVITY AND UNCERTAINTY ANALYSIS ... 11
2.1 MELCOR Code ... 11
2.2 RAVEN software tool ... 11
3. BWR FUKUSHIMA DAIICHI UNIT I SEVERE ACCIDENT MODEL ... 12
3.1 Boiling Water Reactors NPP description ... 12
3.2 Fukushima Daiichi NPP site layout ... 13
3.3 The accident ... 14
3.4 Sequence of events at Fukushima Daiichi Unit 1 ... 15
3.5 MELCOR nodalization approach ... 16
3.6 CORE Model ... 18
3.7 Thermal hydraulic model ... 21
3.8 Containment model ... 23
4. RAVEN – MELCOR coupling development ... 24
4.1 Variables and sampling ... 26
5. RESULTS... 27
6. UNMITIGATED LOSS OF FEED WATER TRANSIENT ANALYSIS IN A GENERIC PWR THREE LOOPS DESIGN LIKE of 900 MWe ... 30
6.1 Unmitigated LFW - Loss of feedwater transient ... 30
7. MELCOR nodalization ... 30
7.1 RPV – Reactor Pressure Vessel ... 31
7.1.1 Core ... 32
7.1.2 Upper Plenum ... 33
7.2 Hot Legs, Pressurizer, Steam Generator, Cold Leg ... 34
7.3 Secondary System ... 36
7.4 Containment ... 36
7.5 Natural Circulation Flows ... 37
7.5.1 HL Flow Rates and a Discharge Coefficient ... 37
7.6 Core Degradation Modelling... 39
7.6.1 Core blockage model ... 39
7.7 Vessel Lower Head Failure and Debris Ejection ... 39
7.8 Reactor SCRAM ... 39
8. Steady State Results ... 40
9. RESULTS... 42
10. Conclusions ... 47
11. ABBREVIATIONS ... 48
ABSTRACT
This report presents the activity performed in the framework of LP1 (Sviluppo Competenze Scientifiche nel Campo della Sicurezza Nucleare), Objective B (Safety Assessment e Valutazioni D'impatto) task B2 (Valutazioni di Rischio e Scenari Incidentali) Topic 2 (Calcolo Integrale di Scenari Incidentali) of the PAR 2017, ADP ENEA-MiSE. In relation to the BWR reactors, the analysis of the transient that took place in Unit 1 of the Fukushima Daiichi reactor (following the earthquake and tsunami that occurred on 11 March 2011) was carried out with MELCOR code. An uncertainty analysis, using the RAVEN software, was developed in order to characterize the uncertainty of the code in predicting vessel and drywell pressure, selected as figures of merit of the analysis, during the selected transient and identify the input parameters that have a major influence on them. In relation to the PWR reactors, a unmitigated transient due to a postulated loss of feed water of the steam generator in a generic PWR 900 MWe was analyzed with the MELCOR code. It is to underline a complete revision of the core and vessel nodalization in order to have a more detailed prediction of the degradation phenomena.
1. INTRODUCTION
After the Fukushima accident, the interest of each country using nuclear energy as a part of its national energy mix has been more focused on severe accident [1-7] mitigation strategies. Several severe accident management analyses have been performed to analyze the accident progression, the core damage, the grace period and the fission product release demonstrating the accident management strategy adequacy.
When a postulated event determines an unmitigated transient, due to postulated several concurrent malfunctions, the core cooling could be not enough to maintain the fuel and flow channel geometry and the core and the related structural materials could start their degradation and consequent relocation phenomena along the core and the lower plenum. In these scenarios the core material and the cooling flow paths could lose their original geometry, well known in term of core cooling capability, and the new configuration is characterized by a mixture of molten corium and debris with a consequent geometry determining an uncertain core cooling capability. Then the evolution of the severe accident starts and will evolve considering the different postulated extreme boundary conditions and mitigation actions that are postulated to do not succeed during the accident evolution.
Considering the complexity and mutual different interacting phenomena along a severe accident progression and the possible source term release to the environment, the research on severe accidents is fundamental in order to characterize the main phenomena determining the transient evolution of the plant and to support SAM assessment. Within this regard a key role is done by the State-of-Art severe accident codes (as ASTEC [8], MAAP [32], MELCOR [9], etc), [10] that storing all the knowledge developed in the last decades from the experimental activities, permit the prediction of the transient behaviour of a plant, during a severe accident, and qualitatively and quantitatively can support the assessment of SAM.
These codes storing all the knowledge developed in the last decades from the experimental activities, permit the prediction of the transient progression of the modeled plant, during a postulated severe accident, characterizing the main severe accident phenomena taking place in the Reactor Pressure Vessel (RPV), the Reactor Cavity (RC), the Containment (PCV), and the confinement buildings typical of LWRs. Several models/correlations have been implemented in these State-of-Art severe accident codes and have to be set by code-user during input-deck development.
In relation to the code model/correlations implemented in the State-of-Art severe accident codes, even though several experimental campaigns in the field of severe accident phenomena [13-17] have been performed and provided valuable “assessment database [18]” as references to assess severe accident simulation tools, the analyses of the current State-of-the-Art shows that there is the need to reduce some uncertainties still present [19] and a consequent investigation of phenomena/processes, up to day not investigated in detail in geometric prototypical experimental facility with prototypical material, should be addressed.
Considering the need to reduce some uncertainties still present and considering the reached level of development and maturity of severe accident codes and their application on SAMG assessment the discussion and application of severe accident progression analyses with uncertainty (uncertainty is used as a measure of the error made with the code in prediction plant behavior) estimation is currently a key topic in the BEPU framework.
In term of research and development on severe accidents, ENEA is involved in the maintenance of a nuclear safety culture in order to have a high level technical point of view to support independent Italian national evaluations. Infact, though nuclear energy is not part of Italian energy mix, several NPPs are at the Italian border areas. Therefore, Italian capability to analyse possible postulated plant accident progressions is of strategic interest for our national emergency preparedness strategy. Infact these analyses are the basis for technical-scientific prediction of potential risk scenarios, planning of response activity and possible prevention in order to minimize damage in the event of potential contamination of Italian territory. Within this regards uncertainty estimation with the probabilistic method are in progress to support DBA [12] and BDBA [11] analyses.
1.1 Probabilistic Method to Propagate Input Uncertainty
In general the sources of uncertainty can be grouped as a) code uncertainty (e.g. approximation in the conservative equation and in the closure models and correlations) b) representation uncertainty (nodalization effect), c) scaling (the code are validated against scaled down facilities), d) plant uncertainty (e.g. initial and boundary conditions), e) user effect .
Several methodologies have been developed in the past to perform Uncertainty Analysis. In particular this uncertainty methodologies can be grouped in a) methods to propagate input uncertainty, divided in probabilistic (e.g. CSAU, GRS, IPSN, etc.) and deterministic methods (e.g. AEAW, EDF-Framatome, etc.); and b) method to extrapolate output uncertainty (e.g. UMAE) [98].
The probabilistic method to propagate the input uncertainty [95] is, in brief, based on a random sampling of the input uncertain parameters selected by the user; a set of N code runs having in the input a combination of the uncertain parameters is created and solved with the selected code and then, by using regression analysis, it is computed the effect of the input parameters uncertainty on the results uncertainty. The main advantages of this method are that the number of code runs does not depend on the number of input uncertain parameters and it is not necessary a prior Phenomena Identification and Ranking Table (PIRT) that is a long process. The number of code runs N depends on the probability content and on the confidence level set by the user and on the number of Figure of Merits (FOMs) selected for the analysis and it is computed using the Wilks formula [96-97]. Each input uncertain parameter should be defined by its range of variation and its Probability Density Function (PDF); this means that even if the exact value of a parameter is uncertain, some values are more likely to be close to the real one than others. This is one of the main task to be tackled because the evaluation of the correct PDF for each parameter it is not a trivial task and a careful study is required. The selection of the most suitable PDF for each parameter depends mainly on the physical quantity and on the availability of reduced-scale or full-scale measured data. If data are available, it is possible to build a histogram and to derive the PDF [12]. A comprehensive overview of PDF derivation and types is provided in [99].
2. FUKUSHIMA DAICHII UNIT 1 SENSITIVITY AND UNCERTAINTY ANALYSIS
Sapienza University of Rome together with ENEA plans to conduct sensitivity and uncertainty analyses on the Fukushima Daiichi unit 1 plant with the MELCOR code. The MELCOR model to be used was developed for previous deterministic safety analyses reported in [29], [30] and [31]. In order to perform this sensitivity and uncertainty study Sapienza University of Rome has developed a new Python interface to couple the MELCOR code with the RAVEN (Reactor Analysis and Virtual control ENviroment) software tool. The goal of this study is to evaluate the effects of some selected parameters on the melt progression behavior of the core and show the capabilities of the coupling between RAVEN and MELCOR performing statistical analysis to estimate the range of evolution of severe accident scenarios.
2.1 MELCOR Code
MELCOR [33][34] is a fully integrate, engineering-level computer severe accident code able to simulate the thermal-hydraulic phenomena in steady and transient condition and the main severe accident phenomena characterizing the RPV, the reactor cavity, the containment, the confinement buildings typical of LWR and the source term estimation. It has been developed at Sandia Laboratories (SNL) for the U.S. Nuclear Regulatory Commission..
The code is based on the “control volume” approach. MELCOR can be used with the Symbolic Nuclear Analysis Package (SNAP) [35] in order to develop the nodalization and for the post processing data by using its animation model capabilities.
MELCOR has a modular structure and it is composed of an executive driver and a number of major modules, or packages, that together model the major systems of a reactor and their interactions.
The Core (COR) package models the relocation of core and lower plenum structures during melting and debris formation and ejection into the reactor cavity consequently the reactor vessel failure. This package also calculates the thermal-hydraulic response of core internal structures, considering energy transfer to and from Control Volume (CVH) and Heat Structure (HS) packages.
The Control Volume Hydrodynamics (CVH) and Flow Path (FL) packages model the thermal-hydraulic behavior of liquid water, water vapor and gases. The CVH input defines the initial state of each volume, requiring geometry and composition. FL package is instead concerned with connections between control volumes, through which control volume masses may flow. The Radionuclide (RN) package: models the release of fission products from fuel and debris, and aerosol dynamics with transport through flow paths and deposition on structure surfaces. Boundary conditions, like fluid parameters, structures surface temperatures and source terms are provided by other MELCOR packages. It is also possible to consider the wash-off of radionuclides deposited on heat structures from the drainage of water films and the aerosol removal by safety features.
The Control Function (CF) package where user can define functions of variables that can be used by other packages in the code. There is a series of available types of control functions that can have a several number of uses, some of which contains a difficult control logic; it is for example used to control the opening of a valve, or the pump head associated with a flow path. It is also important to underline that control functions (CF) or tabular functions (TF) can be associated with CVH and FL packages, in order to simulate for example sources and sinks of mass or energy, valves, pumps, etc.
2.2 RAVEN software tool
RAVEN (Reactor Analysis and Virtual control ENviroment) is a software tool, developed at the Idaho National Laboratory (INL), that acts as the control logic driver and post-processing tool for different applications [37]. RAVEN has been developed to perform parametric and probabilistic analysis based on the response of complex system codes, in order to quantify the safety margins related to safety-related events [38]. The initial development of RAVEN has been focused on providing dynamic risk assessment capability to RELAP-7 [94], however the modular software structure made possible the coupling with other any system codes.
RAVEN is composed of three main software systems that can operate either in coupled or stand-alone mode:
Graphical User Interface Control Logic System
Probabilistic and Parametric framework
The control logic system is currently available for RELAP-7 only, but Sapienza University of Rome plans to extend this feature also to the MELCOR code.
The two basic elements of RAVEN useful to perform a sensitivity or uncertainty analysis are: Distributions: necessary to produce sampling of the input parameters and initial conditions,
based on their probabilistic distribution. A large library of probability distribution functions is available in RAVEN: Bernoulli, Binomial, Exponential, Logistic, Lognormal, Normal, Poisson, Triangular, Uniform, Weibull, Gamma, and Beta. All distributions are also available in their truncated form when this is mathematically feasible.
Sampler: necessary to connect a set of variables to their corresponding distributions and produces a sequence of points in the input space. There are three main classes of samplers: blind samplers, dynamic event tree samplers, and adaptive samplers [39].
3. BWR FUKUSHIMA DAIICHI UNIT I SEVERE ACCIDENT MODEL 3.1 Boiling Water Reactors NPP description
Boiling water reactor is characterized by a closed, direct steam cycle loop (Figure 3-1), using water as coolant and as moderator to control reactivity. The working fluid boils in the reactor core and drives turbines to generate electricity. The steam is then condensed, cooled by the condenser tubes, filled with water taken from a heat sink. The water is finally pumped back to the reactor building in the Reactor Pressure Vessel (RPV) as feed water.
Figure 3-1: BWR Plant [40]
Fukushima Daiichi Nuclear Power Plant is composed by 6 units which cover the evolution of BWR technology during the 12 years from the construction of Unit 1 in 1967 until the complete operability of Unit 6 in 1979. After Unit 1, which was a BWR/3 design, Units 2-5 were BWR/4 while Unit 6 was a BWR/5 design.
Description Unit 1 Unit 2 Unit 3 Unit 4 Unit 5 Unit 6 Reactor type BWR/3 BWR/4 BWR/4 BWR/4 BWR/4 BWR/5 Electrical output (MWe) 460 784 784 784 784 1100 Thermal output (MWth) 1380 2381 2381 2381 2381 3293 Commercial operation start March 1971 July 1974 March 1976 October 1978 April 1978 October 1979
Table 3-1: Fukushima Daiichi Nuclear Power Plant Specifications
The main differences between BWR types regard Recirculation Loops, Reactor Isolation Pressure and Inventory Control, Emergency Core Cooling Systems and Containment.
The containment of a BWR is a pressure suppression containment. It is composed by a wetwell, a drywell and a vent system.
The detail of the main emergency systems of Fukushima Daiichi BWRs is reported in [41] and [46].
3.2 Fukushima Daiichi NPP site layout
The site was located 220 km north of Tokyo, on the Pacific coast of Fukushima Prefecture.
Before the construction of the NPP, the site elevation was about 35 m referring to the average sea level at Onahama port (“OP” level); consequently, a great excavation plan was necessary, as shown in Figure 3-2.
Figure 3-2: Cross section of the Fukushima Daiichi construction site [41]
The plant and building of Units 1-4 were built at an elevation of 10 m, in order to provide an acceptable and stable bedrock foundation. Considerations and security features against tsunami were present in the Establishment Permit (EP), the Japanese equivalent of the safety analysis report. Tsunami events were considered in the tidal water level for plant design, influencing NPP’s project and construction. At the beginning the design basis tide level was OP +3.122 m, and referring to this value the Nuclear Power Plant was projected. This initial EP design value was re-evaluated several times during years, whose countermeasures are summarized in the following table.
Year Tsunami height evaluation Countermeasure
1996 Establishment permit OP +3.122m (observed height resulting from Chilean tsunami in 1960)
-
2002 Japan Society of Civil Engineers (JSCE) assessment method. OP +5.7m
Raise elevation of pumps Make buildings watertight 2007 Disaster Prevention Plan by Ibaraki Prefecture Government
approx. OP 4.7m
Unnecessary
2007 Disaster Prevention Plan by Fukushima Prefecture Government approx. OP 4.7m
Unnecessary
2009 Latest bathymetric and tidal data on the basis of the JSCE assessment method. OP +6.1 m
Raise elevation of pumps
Table 3-2: Fukushima Daiichi Tide Level’s evaluation [42]
After the last evaluation in 2009 the NPP could face a tide water level of OP +6.1 m (lower than the 14 m tsunami wave occurred during the accident).
At the end of construction works, the Nuclear Power Plant had six different reactors, two of which, Unit 5 and 6, were separated from the other four. Following a simplified plan of Fukushima Daiichi NPP [42].
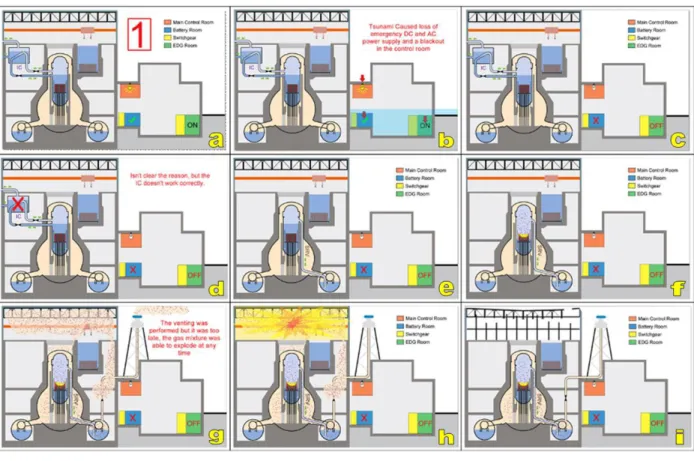
Figure 3-3: Layout of Fukushima Daiichi NPP [42] 3.3 The accident
On March 11 2011, at 14:46, the Great East Japan Earthquake and its consequences caused an extreme situation which carried to the severe nuclear accident at Fukushima Daiichi Nuclear Power Plant, owned by the electric company TEPCO (Tokyo Electric Power Company). When the accident occurred the Unit 1, 2 and 3 were in normal operation, while Units 4 to 6 were stopped, under periodical inspections. After the beginning of the earthquake, SCRAM (emergency shut-down system) was immediately provided in all operating Units. However, the earthquake damaged the electricity
transmission system between the NPP and external facilities, causing the total loss of off-site electricity (Station Black Out-SBO). From this point Emergency Core Cooling Systems started operating through emergency diesel generators, providing heath removal from nuclear reactors. The tsunami generated by the earthquake flooded in the NPP’s site, making totally unavailable the seawater pumps, diesel generators and the DC powered facilities, projected, with all the other systems, to face a design basis tide water level of 6.1 m; in particular, Units 1, 2 and 4 lost all power, while Unit 3 only AC power, and later on March 13 lost direct current.
The damages of the tsunami were not only to power supplies, but also to buildings, machineries and equipment installations, causing an extremely difficult access and movement within the plant, precluding the immediate and continuous injection of water through alternative systems.
3.4 Sequence of events at Fukushima Daiichi Unit 1
At 14:47 of 11 March 2011, after the earthquake, acceleration sensors initiated the automatic reactor scram. Emergency Diesel Generators (EDGs) started automatically at 14:48 in response of loss of all off-site power, restoring AC power.
Meanwhile the RPV was isolated through the closing of Main Steam Line Isolation Valves (MSIVs). Consequently, the reactor pressure increased due to the continuous steam generation, until both loops of the isolation condenser system automatically started. The IC is designed to have capacities to remove decay heat by heat exchange at 5 minutes after the scram by its one subsystem. Therefore, under the current operation conditions (longer than 5 minutes after the SCRAM and simultaneous operation of two subsystem), more decay heat is removed that necessary. The operation of both isolation condenser loops lowered the reactor pressure and temperature so rapidly that the operators manually stopped them, in accordance with procedures, in order to prevent thermal stress on the reactor pressure vessel. Afterwards, only one of the loops was used by the operators to control the cooling rate in a range prescribed by the procedures. The reactor pressure was controlled by manually repeating the start-up and shutdown of the IC subsystem-A.
It should be noted that the IC automatic start-up pressure is set lower than the lowest SRV activation pressure, therefore the reactor coolant inventory in the reactor doesn’t decrease, as long as the IC is in operation.
Maneuvering actions such as the starting up of the suppression chamber (S/C) in the cooling mode of the containment cooling system (CCS) were also being taken in parallel for cold shutdown of the reactor.
At 15:36 a tsunami wave 14 m high reached the site, flooding the plant and damaging EDGs located in the basements of the Turbine Building (TB) and the Control Building (CB), causing the total loss of AC power at 15:38 Station Blackout-SBO).
All coolant capabilities were lost and all displays of monitoring instruments and various display lamps in the Main Control Room went out due to the station black out caused by tsunami.
Approximately from 16:42 to 17:00 of 11 March 2011, part of the DC power supplies was temporarily recovered.
Concerned about the water inventory left in the IC shell side tank, at 18:25 the operators closed the isolation valve outside the containment on the return pipe. Post-accident surveys of the water in the IC shell side tank revealed that the water level indicator of subsystem-A had been 65% (normal level is 80%) and water in the tank had been sufficient. If the isolation valve had not been closed at 18:25 on March 11 ractor cooling by the IC might have been continued.
Local measurements (in the reactor building) at 20:07 indicated that the reactor was still near the operating pressure of 70 bar (7 MPa), which prevented water injection by alternative methods that would only be possible below 8 bar (0.8 MPa).
Meanwhile, the reactor pressure became low enough to allow alternative water injection. An alternative cooling method, that is, freshwater injection from the fire engines into the Unit 1 reactor to restore core cooling, started at 04:00 on 12 March, about 12.5 hours after the station blackout. Water injection from a single one-tonne truck continued intermittently for approximately 5.5 hours with the
truck having to return to the freshwater tank periodically to be refilled. At the same time, work on establishing a direct line from the tank continued. Later, just over 17.5 hours after the station blackout, continuous freshwater injection into Unit 1 started directly from the tank.
The measurement of Unit 1’s containment pressure at 04:19 on 12 March showed that pressure in the containment had decreased since the last measurement (at 02:45) without any operator action and without an established vent path, indicating that some unintentional containment pressure relief had occurred through an unknown path. Furthermore, the radiation levels measured at the main gate shortly afterwards showed an increase. This was also an indication of some uncontrolled radioactive release from the primary containment.
Because of the higher pressure in the reactor system the suppression pool was vented out (as per picture g of Figure 3-4). The venting was started too late and the atmosphere within the containment reached a too high hydrogen gas concentration. This caused at 15:36 on March 12, the explosion of the reactor building allowing radioactive materials to be released into the environment (as per picture h of Figure 3-4). Less than an hour after the explosion, radiation dose along the site boundary had reached 1.015 μSv/hr. Later, on March 12, the operators started to inject seawater into the reactor through the core spray system in order to cool the reactor; boron was then added to the water to control the reactor criticality.
This situation continued over the next several days as site personnel attempted to restore electrical power to the unit (as per picture i of Figure 3-4). Off-site power was restored to Unit 1 on March 20, nine days after the event.
Figure 3-4: Fukushima Daiichi Unit 1 - accidental sequence. 3.5 MELCOR nodalization approach
In order to develop the Fukushima unit 1 MELCOR nodalization [43], following the SANDIA approach reported in the Fukushima Daiichi Accident Study (SAND2012-6173) [44], the nodalization
has been based on the Peach Bottom reactor (different power but similar reactor). The references used to develop the BWR Peach Bottom nodalization are [43] and [45].
Starting from this model, the Fukushima Daiichi Unit 1 input was built with the data reported in [46] and applying a reasonable scaling factor for each component, as pointed out in the following table, if the data are not available.
DATA UM Peach Bottom Fukushima Daiichi 1
BWR type - BWR4-MARK1 BWR3-MARK1 Thermal output MW 3514 1380 R inner vessel m 3.2 2.4 RPV wall thickness m 0.164 0.16 RPV lower head thickness m 0.21 0.2 Heigh vessel m 22.2 20 Radius lower head m 3.188 2.391 Length FAs m 4.35 4.35 Active length m 3.66 3.66 NS mass kg 33866 17730 2 UPPER PLATE mass kg 24144 12640 SS mass kg 46000
CORE PLATE mass kg 14998 7852 2 CR housing mass kg 12041 6304 2 CRGTs mass kg 30000 CRs mass kg 9722.205 5090 3 Zircaloy mass kg 61700 32330 Steel mass kg 121180 63500 Poison mass kg 1785 935
Table 3-3: Peach Bottom and Fukushima Daiichi 1 Power Plants specifications
Reactor core
Length of active fuel 366 mm Hydraulic equivalent diameter 3.44 m Total amount of uranium 68 t Steam flow rate 2400 t/h Core temperature 558 K Averaged uranium enrichment STEP2 (8x8): 3.4
9x9: 3.6 wt% Burnup (STEP2)-Averaged 39.5 GWD/t Burnup (9x9)-Averaged 45.0 GWD/t
Fuel (STEP2)
Diameter of pellet 10.4 mm Outer diameter of cladding tube 12.3 mm Thickness of cladding (zirconium liner) 0.86(0.1) mm
Fuel assembly (STEP2)
Number of FA 68 mm Number of fuel rod
in one FA 8x8 – 4 (water rod) - Material of channel box Zircaloy-4 - Fuel (9x9) Diameter of pellet 9.4 mm Outer diameter of cladding tube 11 mm Thickness of cladding (zirconium liner) 0.70(0.1) mm
Fuel assembly
Number of FA 332 - Number of fuel rod
in one FA 9x9 – 9 (water channel) - Material of channel box Zircaloy-4 - Control blade Control material B4C - Configuration Cross shape - Number of control blade 97 -
Pitch 305 mm
Table 3-4: Unit 1, Fuel information [46] 3.6 CORE Model
The core geometry was slightly modified compared to the previous one, in particular the lower plenum nodalization has been modified.
Moreover, following the MELCOR best practices [47] the thickness of the gas gap between fuel pellets and cladding to simulate fuel swelling.
The core axial and radial division is necessary to define different “Core cells” in which the code requires to specify masses of fuel (UO2), supporting structures (SS), non-supporting structures (NS) and related adjacent core channel and core bypass control volumes. Core cells individuate exclusively volumes related with the lower plenum and inside the core shroud. It is important also to underline that bottom of RPV has been taken as the reference level.
The axial core division can be done by splitting into two different regions, one below the bottom of active fuel (BAF) and one above (top of active fuel, TAF).
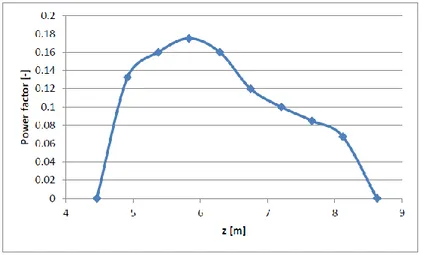
The first one (see Table 3-5) has been divided into 13 levels. The transition from spherical to cylindrical vessel shape has been set at +2.76585 m.
The division of the active core region is based on the reference [46], which calculates average axial and radial peaking factors that must be inserted in cells containing fuels. Consequently following the reference, in order to use verified power peaking factors, the active core region has been divided into 10 levels, from the Bottom of active fuel (BAF), deduced by the top of active fuel (+9.1543 [1]) minus the active fuel length (3.66 m), to the top of the core (assumed 0.5 m above TAF). It is important to notice that the last axial level does not contain fuel and consequently its axial peaking factor has been set equal to zero.
Number Bottom of the Level Level thickness Axial peaking factor
1 0.0 0.25908 0 2 0.25908 0.25908 0 3 0.51816 0.25908 0 4 0.77724 0.25908 0 5 1.03632 0.25908 0 6 1.2954 0.49015 0 7 1.78555 0.6145 0 8 2.4 0.36585 0 9 2.76585 0.49015 0 10 3.256 0.49015 0 11 3.74615 0.49015 0 12 4.2363 0.49015 0 13 4.72645 0.49015 0 14 5.2166 0.2777 0 15 5.4943 0.4575 0.705882353 16 5.9518 0.4575 1.103562552 17 6.4093 0.4575 1.088649544 18 6.8668 0.4575 1.082021541 19 7.3243 0.4575 1.08533554 20 7.7818 0.4575 1.08699254 21 8.2393 0.4575 1.06876553 22 8.6968 0.4575 0.77879039 23 9.1543 0.51 0.0
Table 3-5: MELCOR CORE Nodalization
Figure 3-5: Axial relative power factor
The radial division is based on the reference [48], which provides radial peaking factors of core radial sections identified by the number of FAs contained, but without providing any information about dimensions. Consequently, since MELCOR requires radius of the radial rings division, an equivalent diameter of the total area of FAs associated with one peaking factor has been determined. The square lengths of channel boxes are unknown, consequently Peach Bottom channel box dimensions are assumed both for 8x8 and 9x9 FAs.
Number of FAs Total Area of FAs Outer Radius Peaking Factor
Radial Ring 1 100 2,884775 0.884 0.35 Radial Ring 2 100 6,046625 1.25 0.3 Radial Ring 3 100 9,395525 1.531 0.225 Radial Ring 4 100 12,74443 1.768 0.125 Radial Ring 5 0 0 1.972 0 Radial Ring 6 0 0 2.4 0
Table 3-6: MELCOR Radial Nodalization
An equal distribution of material in the active part has been set.
The 5th radial ring simulates the outer bypass region, the annular region between the active core and the internal surface of the core shroud, while the 6th radial ring simulates the downcomer region. In these two regions there aren’t fuel rod, but only refrigerant. So this portion of the core, has a strong discontinuity with respect to the most inner rings, where there are the fuel rods, and other structural materials. The outer radius of the Fukushima reactor (2.4 m) has also been used to estimate the thickness of the cylindrical wall and the hemispherical shell of the vessel (data not reported in the references). Starting from the thickness of the reference reactor, and using the correlation of Mariotte has been estimated, for example, a thickness value of the hemispherical shell of the vessel of 0.165 m instead of 0.22 m. This parameter has a great importance both in terms of heat exchange (as the thickness increases, clearly increases the thermal resistance), both for the influence that would have on a possible resistance to breaking in incidental simulations.
Figure 3-6: Fukushima Unit 1 Axial & Radial Core Nodalization (made with SNAP)
The SS failure model selected is the “Stress Based”, inserting SS number and inner/outer diameter.
Particular attention was dedicated to the modeling of lower head of the core. The detailed nodalization of the lower part of the core, allowed to optimally simulate the spherical head profile behavior. The default heat transfer coefficients are used in the current model, they are order-of-magnitude parameters that should be varied in sensitivity studies to determine their impact on lower head heat transfer and failure. The default failure temperature (1273.15 K) is instead an approximate value for the transition to plastic behavior for steel. This temperature value is then considered with the structure thickness and load to evaluate its failure. However, since BWR penetrations are thinner than LH, the debris ejection preferably occurs through penetrations open areas.
3.7 Thermal hydraulic model
The detailed thermal hydraulic nodalization is reported in [31]. The MELCOR nodalization was designed to have a reasonable computational time and a realistic prediction of the phenomena involved during the transient assuring a reliable and accurate transient simulation.
The control volumes adjacent to core cells have been splitted in order to better simulate local heat transfer process for a wide range of fluid conditions and structure surface temperatures. Core nodalization is always much finer than the CVH nodalization, each hydrodynamic volume contains two core cells. In earlier versions of MELCOR, limitations in several models made it difficult to perform calculations using a fine CVH nodalization with one control volume for each core cell or each small number of core cells. MELCOR 1.8.4 or later versions of the code include improvements in the dT/dz model and incorporates a core flow blockage model (in the FL package). These make such calculations more practical, although some penalty in terms of increased CPU time requirements should still be expected.
The RPV MELCOR nodalization, made by using SNAP and shown in Figure 3-7, comprises the lower plenum, the core, the core bypass, the upper core plenum, the standpipes, the steam separator, the steam dome, the upper downcomer, the middle downcomer, the lower downcomer and the steam
line. The 2 external recirculation loops are modelled separately, while the jet pumps are modeled with two equivalent jet pumps.
Figure 3-7: Fukushima Unit 1 - Thermal Hydraulic model (made with SNAP)
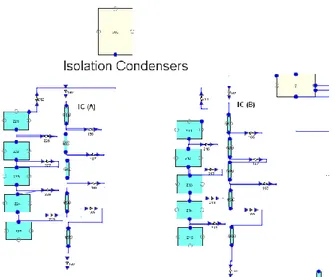
The Unit 1 of Fukushima NPP have two ICs for removing the decay heat when the main isolation valve (MSIV) is closed and the main condenser is isolated. This passive system were originally designed to prevent over pressure in the RPV without activation of the SRV.
Figure 3-8: Isolation condenser circuit [49]
When the pressure is higher than 7.13 MPa the IC goes in operation and continues more than 15 seconds, while the SRV activation pressure is about 7.27 MPa.
Considering the heat removal capacity of the two ICs after the reactor scram, in order to avoid thermal stress due to cold water inflow in the RPV, the line valves opening is adjusted in order to have a temperature change of the RPV less than 55 °C/hr (operator manual states) [1]. For time a short step problem, a detailed nodalization was implemented with five volumes and five junctions for each side, instead the one volume per side initial nodalization. With this nodalization, a time step of about 0.1 s is possible without any problem.
Figure 3-9: Isolation Condenser Model (made with SNAP) 3.8 Containment model
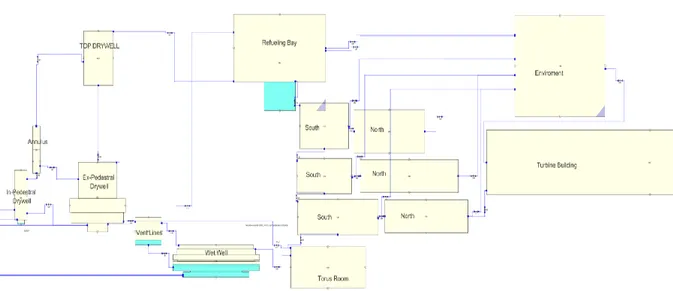
The primary and the secondary containment are modeled with the following nodalization, as represented in Figure 3-10.
The primary containment of the Mark-I design is modeled with of six separate regions: Drywell-In-pedestal; Drywell-Ex-pedestal; Drywell-Top; Drywell-Annulus; Vent pipes; Wetwell.
The secondary containment is modeled with nine separate regions: Torus room South 135 level North 135 level South 165 level Remain 165 level South 195 level Remain 195 level Refueling Bay Turbine Building.
Figure 3-10: Fukushima 1 Containment nodalization (made with SNAP)
The containment passive heat structures are modeled, in particular for the evaluation of the aerosol deposition.
4. RAVEN – MELCOR coupling development
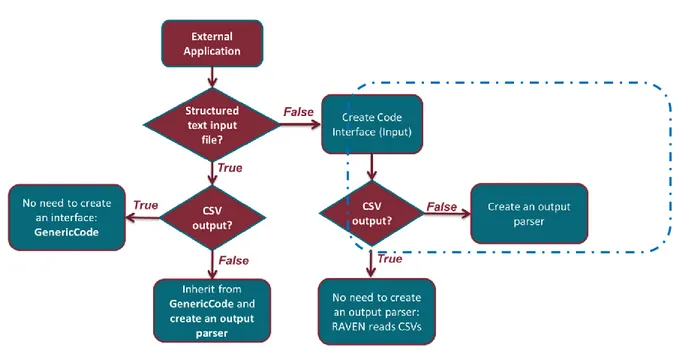
A Python interface has been developed to allow the interaction between RAVEN and MELCOR. The Python interface allows to perturb all the parameters accessible through the MELCOR input deck. In such a way RAVEN is capable of investigating the system response as well as the input space using Monte Carlo, Grid, or Latin Hyper Cube sampling schemes, but its strength is focused toward system feature discovery, such as limit surfaces, separating regions of the input space leading to system failure, using dynamic supervised learning techniques.
The interface has three manly functions, interpret the information coming from RAVEN, translate such information in the input of the driven code and manipulate output datafile to create a database. To deal with the first two functions the “GenericCode interface” module (already implemented in RAVEN) has been coupled with a module that runs MELGEN and MELCOR executable. To allow RAVEN storing output data coming from MELCOR, a Python output parser has been developed.
Figure 4-1 – Coupling External Application with RAVEN
The aim of this parser is to convert the PTF binary file generated by MELCOR into a single CSV file. The Python struct module has been used to read the binary plot file allowing MELCOR data handling and conversion in CSV format.
To overcome the handling of large datafiles the interface allows to create a CSV file with only variables required by the users. So is possible to obtain an HDF5 database which comprises variables from all MELCOR packages (CVH, FL, COR, RN etc.) and perform analysis on the specified variables. Figure below shows the procedural framework used for the uncertainty quantification. A MELCOR input deck is used as template, the chosen parameters are specified as string with special characters. In such a way RAVEN can identify such parameters and replace the string with values sampled from a specified distribution. Consequently N-MELCOR input decks are generated. Once the HDF5 database has been generated statistical analysis of the output sets can be performed.
4.1 Variables and sampling
A set of 7 parameters have been chosen to perform this uncertainty study in order to test the implemented code coupling between RAVEN and MELCOR. The parameters treated in this analysis are the recirculation pump seals leak flow area, plant parameter not available to the code user, and 6 MELCOR modeling parameters chosen in the list of modeling parameters and sensitivity coefficient investigated in [50]. To facilitate uncertainty analyses and sensitivity studies, MELCOR code allows code-users to modify some important parameters model directly through code input as Sensitivity Coefficient (SC). The parameters selected are listed in the Table 4-1.
Once all the variables have been selected a sampling strategy needs to be employed. The sampling strategy is used to perturb the input space in relation to variable distributions. In this analysis the Monte Carlo sampling strategy has been performed setting a limit of 600 calculations. The Monte Carlo method is one of the most-used sampling methodology because doesn’t use a structured discretization of the input space but cumulative probability and probability distribution function to compute the different values of the concerned variables.
Variable Description RAVEN Distribution
Area_Seal Recirculation pump seals leak flow area Triangular
Mode: 0.12 𝐸−3 [𝑚2]
Min: 0.06 𝐸−3 [𝑚2]
Max: 0.4 𝐸−3 [𝑚2]
vfall Velocity of falling debris Triangular Mode: 0.1 [𝑚/𝑠] Min: 0.05 [𝑚/𝑠] Max: 1.2 [𝑚/𝑠] hdblh Heat transfer coefficient from debris to lower head Triangular
Mode: 1000[W/𝑚2 𝐾 ]
Min: 50 [W/𝑚2 𝐾]
Max: 1100[W/𝑚2 𝐾 ]
SC1132(1) Core Component Failure Parameters - Temperature to which oxidized fuel rods can stand in the absence of unoxidized Zr in the cladding.
Normal
Mean: 2700 [𝐾] Sigma: 120 [𝐾] SC1141(2) Core Melt Breakthrough Candling Parameters - Maximum
melt flow rate per unit width after breakthrough
Triangular
Mode: 0.083 [𝐾𝑔/𝑠] Min: 0.01 [𝐾𝑔/𝑠] Max: 1.0 [𝐾𝑔/𝑠] SC1502(2) Minimum Component Masses - Minimum total mass of
component subject to the maximum temperature change criterion for timestep control
Normal Mean: 5 [𝐾𝑔] Sigma: 1.0 [𝐾𝑔] SC1250(1) Conduction Enhancement for Molten Components -
Temperature above which enhancement is employed
Normal
Mean: 2800 [𝐾] Sigma: 150.0 [𝐾]
5. RESULTS
Results have been statistically analyzed through the RAVEN BasicStatistic post-processor. A dynamic statistical analysis has been performed setting time as pivot parameter.
To give a better visualization of uncertainty the 0.05, 0.5 and 0.95 quantiles have been selected. Figure 5-1 and Figure 5-2 show quantiles and expected value (0.5 quantile) of predicted drywell and wetwell pressure, respectively. In the early stage of the accident, the gradual increase of pressure is due to steam ejection from recirculation pumps seal leak. In-vessel Hydrogen production process, due to massive Zircalloy oxidation, starts about 2,22 hours after the reactor SCRAM. The Hydrogen reaches the drywell and wetwell containment together with steam through leaks from RPV, causing a pressure peak in the primary containment at about 3,33 hours.
Pressure continues to increase until 0.84 MPa when a break in the drywell is simulated causing steam and non-condensables flowing in the secondary containment buildings. The wetwell venting valves were opened about 23 h 30 min after the earthquake and the containment pressure started to decrease. The venting was modeled by opening a flow path from the top of the wetwell to the environment for this time period, as reported in the TEPCO documents [46]. It is to underline that the results of the calculated data coupled with the related uncertainty band envelope mostly of the TEPCO plant data available related to the drywell and wetwell pressure (Figure 5-1 and Figure 5-2
respectively).
Figure 5-1 - Drywell Pressure predicted by MELCOR
From the analyses of the calculated data, lower head failure and debris ejection from the vessel take place between 7 and 17 hours after the scram. This event influences the wetwell and drywell behavior as reported in Figure 5-1 and Figure 5-2.
To describe the correlation between the variables, the Pearson’s coefficient has been used. It is defined between -1 and 1 and measures the strength of the linear relationship between two variables. In Figure 5-3 is possible to see the strong correlation between the recirculation pump seal leak area and the pressure in the drywell containment. The strong positive relationship highlights that as the leak area increases the pressure in containment increases, as expected. Therefore, the lower head failure uncertainty is mainly related to the pump seal leak area uncertainty while the MELCOR modeling parameters and sensitivity coefficient, under investigation in this uncertainty application (Vfall, hdblh, SC1132, SC1141, SC1502, SC1250), have a low ranked influence.
Figure 5-3 - Drywell containment pressure Pearson coefficient
The results of statistical analysis results for pressure in RPV is shown in Figure 5-4. The first notable depressurization is caused by the IC operation in the first hours after the SCRAM. The large pressure drop is predicted between 4 and 5.8 hours and it is associated with gas ejection from RPV.
Also in this case the Pearson correlation coefficients have been employed to detect the main variables that affect the transient. Figure 5-5 shows that the area of seal leak is strongly correlated with the RPV pressure trend, in particular in the first 6 hours after the reactor SCRAM. However, in this case the trend is strongly negative, in fact an increase in leak area will cause a decrease in RPV pressure, as expected. Therefore, the RPV pressure is mainly related to the pump seal leak area uncertainty while the MELCOR modeling parameters and sensitivity coefficient, under investigation in this uncertainty application (Vfall, hdblh, SC1132, SC1141, SC1502, SC1250), have a low ranked influence. It is to underline that the results of the calculated data coupled with the related uncertainty band contains mostly of TEPCO plant data available related to the RPV pressure (Figure 5-4). A statistical comparison, as in [55], will be carried out in the continuation of this research.
6. UNMITIGATED LOSS OF FEED WATER TRANSIENT ANALYSIS IN A GENERIC PWR THREE LOOPS DESIGN LIKE of 900 MWe
The aim of the present work is the analysis of an unmitigated LFW – Loss of Feed Water sequence in a generic PWR 3-loops 900MWe type reactor. Since the transient is postulated unmitigated and the actions of the operator are assumed to fail, it is a BDBA and evolves as a Severe Accident. The analysis focuses mainly in the characterization of the thermal hydraulic behavior, the in-vessel phenomena, the core degradation and corium behavior in the lower head.
The study of such a complex sequence, involves many fields of study like thermal-hydraulic, source term, core degradation, etc. requiring powerful analytical tools. In this work has been used severe accident code MELCOR 2.2, with user's interface SNAP (Symbolic Nuclear Analysis Package).
This work is a continuation of the PAR 2015 and 2016 activity, ADP ENEA-MiSE. A new and more detailed MELCOR thermal hydraulic nodalization of the PWR has been developed in order to reproduce the accident scenario. Moreover, dealing with the MELCOR best practices, some input parameters have been changed to better represent the plant response to the severe accident.
The reference reactor considered for this analysis is a generic PWR three loops design like of 900 MWe, western type. The main reference plant design parameters are capted from [5][6][7] [51].
6.1 Unmitigated LFW - Loss of feedwater transient
This accident is caused by postulated equipment failures that lead to simultaneous unavailability of the Main Feed Water System (MFWS) and the Emergency Feed Water System (EFWS). Since the transient is postulated unmitigated and the actions of the operator are assumed to fail,it is a BDBA that can evolve as a severe accident if significant core degradation takes place.
Unmitigated loss-of-feed water transient is a high-pressure scenario with decreased capacity of heat removal from the SGs with both primary and secondary circuits still intact.
The SGs will be suddenly drying, and the reactor will scram due to the low SGs level. The RCS heats up and its pressure rises to the set pressure of the PRZ safety valves. The RCS empties and remains at high pressure until core uncover and melt occur. Core melt can thus occur while the RCS is pressurized. This poses a short-term threat for containment of the radioactivity released during core melt (ejection of corium into the containment during pressure-induced rupture of the vessel, resulting in “direct heating” of the containment, SG tube breaks).
Since LPI and HPI are not available, the passive discharge of the accumulators is the only inflow water entering the core to compensate the loss of water coolant. The containment sprays are available.
7. MELCOR nodalization
In the framework of severe accident research activity developed by ENEA, funded by the Italian Ministry of Economic Development (Accordo di Programma ENEA-MiSE), a MELCOR nodalization of a generic PWR of 900 MWe [68], [69] has been developed, by using SNAP, based on public information’s available from the scientific technical literature [68], [69], [70], [71], [72], [73].
This work is an extension of the PAR 2015 and 2016 activity, ADP ENEA-MiSE: a more detailed MELCOR thermal hydraulic nodalization of the PWR have been developed in order to reproduce the accident scenario. Moreover, dealing with the MELCOR best practices, some input parameters have been changed to better represent the plant response to the severe accident, following the Best Practice Guidelines given in SOARCA [74].
In particular, this new control volume hydrodynamic nodalization, compared to previous one on which is based, has following mains differences:
- Single CVH core volume splitted in five concentric ring and five axial level; - Single CVH upper plenum splitted in five concentric ring and two axial level; - Single CVH hot leg splitted in upper and lower halves and in mid length;
- Single CVH SG ascending side is splitted in 3 parts SG inner plenum and 2 halves CVHs U-tube ascending side;
- Single CVH SG descending side is splitted in SG outlet plenum and 2 halves CVHs U-tube descending side;
- A CVH is added to pressurizer SRVs to check valves temperature;
These changes are described below. Together with, also flow paths and heat structures have been updated to better reproduce accident scenario and control functions are added to better simulate plant control system, thermal hydraulic behavior, accident scenario and phenomena.
The MELCOR model consist of 114 control volumes, 217 flow paths and 131 heat structures.
7.1 RPV – Reactor Pressure Vessel
MELCOR model include representation of RPV component as core, lower plenum, upper plenum, upper head, downcomer, bypass region. They are all build up in CVH - Control Volume Hydrodynamics package, responsible for modelling the thermal-hydraulic behavior of liquid water, water vapor, and gases in MELCOR, giving boundary conditions to all other packages.
Core and lower plenum structures, including their thermal response and relocation during degradation, melting, slumping, and debris formation, are modelled in COR package.
The bottom of RPV has been taken as the reference level.
7.1.1 Core
Core is represented by five concentric rings of hydrodynamic control volumes and core structures (Figure 7-3, Figure 7-4 - Core CVH nodalization
). Each ring is divided into five vertical hydrodynamic control volumes and ten core axial levels, coupled two by two with one CVH control volume. Each of the five core rings and ten core levels models the response and relative power of the included fuel assemblies, giving a more accurate and continuous representation of the local fuel collapses and subsequent degradation.
The sixth outer region, models the bypass region between the core shroud around the fuel and the core barrel.
A matrix of axial and radial flow paths simulates two-dimensional flow patterns in the core region during natural circulation. In each flow path in the core and lower plenum nodalization the flow blockage model is activated and then changes in flow resistance during core degradation.
7.1.1.1 Power factors
The 157 fuel assemblies are divided in COR package into 5 radial ring regions. Axial core region included in COR package goes from axial level 8 to 17. Active region is of 3.66m and goes from axial level 9 to 16, with outermost parts modelled as non-active regions of fuel elements [69].
Figure 7-3 - Core COR package nodalization 7.1.2 Upper Plenum
Upper plenum has same 5-ring nodalization scheme of core’s CVH extended upward, divided into two axial levels with radial flow between each ring. Axial levels are divided at the hot legs simmetry axis height to separate natural circulation flow outward to the hot legs versus the returning flow (Figure 7-5).
Gas or water can flow through the control rod guide tubes between the upper plenum and the upper head. The leakage pathways between the downcomer and the upper plenum and from the downcomer to the upper head are also represented.
Figure 7-5 - Upper Plenum, Upper Head nodalization
7.2 Hot Legs, Pressurizer, Steam Generator, Cold Leg
The Hot Legs (HL) and SGs need to be modeled in detail (Figure 7-6) because they must simulate conditions ranging from normal operating conditions, single-phase liquid and two-phase accident conditions, and single-phase gas natural circulation conditions, as discussed later. The related HS are made of Carbon Steel, with an internal liner of Stainless Steel.
Figure 7-6 - Loop 1 nodalization visualization made by using SNAP
HLs are split in upper and lower halves and in mid length to permit counter-current natural circulation flows. Possible HL creep failure is calculated by Larson-Miller lifetime damage model, opening flow path connection with containment.
PRZ is connected with loop 1 HL with a side-mounted surge line. PRZ has 3 SRV – Safety Relief Valves connected with PRT – Pressurized Relief Tank spargers, connected in turn by a rupture disk to containment atmosphere.
Optional MELCOR pool scrubbing logic (SPARC) was enabled in the flow path representing spargers, removing radionuclide aerosols and vapors from a gas as it flows through a pool of water.
SG tube bundles are split in ascending and descending U-tube side, each one split in two halves with same purpose of HL split.
SG inlet plenum to outlet plenum data is taken from [28]. Flow paths between ascending and descending CVHs are tuned to match the results obtained in [77] in natural circulation condition.
SGTR – SG Tube Rupture is calculated by Larson-Miller lifetime damage model, opening flow path connection with SG riser, with a 100% SG tube flow area of 3.07 ∙ 10−4m2.
7.3 Secondary System
MELCOR model of secondary system include 3 loops Feed Water Tank (FWT), feed water line, SG riser/cavity, SG downcomer, SG steam line, SG steam header (Figure 7-7).
Boundary conditions are used to represent the turbine pressure and feedwater flow to allow direct calculation of the nominal, full-power steady state operating conditions.
SG Secondary side is modelled with two CVH representing riser and downcomer, the former thermally coupled with U-tube primary side. Water level at 100% power is set at about 41.5% of SG narrow range [75]. Each steam line has 3 SRVs, connecting environment, set to open at proper pressure.
Figure 7-7 - Secondary System nodalization 7.4 Containment
The containment is divided into a total of ten control volumes, representing the basement sump, two reactor cavity zones, reactor pit, the loops cubicle, the PRZ cubicle, the PRZ relief tank cubicle, the annular zone, the pool zone and the upper dome.
The walls, floors and ceilings in the containment are modelled as heat conducting structures. The structures will absorb and release heat during the course of an accident. Fission products can deposit on any structures. However, gravitational settling only occurs on horizontal structures.
The major walls include the outer walls of the containment that are shared with the environment with an internal carbon steel liner and air annular space, and containment basement.
The reactor cavity and pit are represented using special physics models for core-concrete interactions (CCI). The concrete floor is a Standard concrete CORCON generic, with an ablation temperature of 1550 K and an initial temperature of 390 K. The reactor cavity is represented with a flat-bottom cylindrical. If reactor cavity fail radially, reactor pit will receive overflowing material.
There is a Refueling Water Storage Tank (RWST) filled with a water volume at 350 K, used by CSS - Containment Spray System as water reservoir.
7.5 Natural Circulation Flows
MELCOR is a lumped parameter system analysis codes, able to predict the thermal-hydraulic behavior of the entire RCS over extended periods of time. In order to simulate potential three-dimensional fluid phenomena along the severe accident progression, considering the expected flow conditions determined from experimental correlations and/or suitable multidimensional code predictions, the following nodalization approaches have been used:
- In the reactor core, the crossflow junctions between rings, provide an approximation of the multidimensional flow;
- To model HL countercurrent single-phase flow, the HLs were divided into top and bottom halves: the top half provided the flow path for hot vapor to move from the reactor vessel to the SGs, while the cooler vapor flowed from the SGs back to the reactor vessel through the bottom half of the HL pipe. Because the HL flows are artificially separated, some of the interactions between the hot and cool vapor like mixing and heat transfer are not modelled but are taken into account with system code modelling parameters, discussed below. This also separates pipe heat structures, so that large temperature gradients can occur between the top and bottom of the pipe, with no heat transfer between them;
- The SG tubes were also separated into two groups, one to allow the hot vapor to flow from the inlet plenum toward the outlet plenum, while the remainder provided the path for flow from the outlet plenum to return to the inlet plenum.
- The SG inlet plenum modelling was also changed from a single control volume to simulate the mixing that occurs. Most of the plenum volume was contained in a mixing volume that allowed the hot vapor from the HLs and the cool vapor from the SG tubes to mix. While the mixing volume provided most of the flow to the hot SG tubes and to the bottom of the HL, there were also smaller volumes used to allow hot vapor from the top of the HL to pass directly to the hot flowing SG tubes, and to allow cool vapor returning to the inlet plenum from the SG tubes to flow directly to the bottom of the HL.
7.5.1 HL Flow Rates and a Discharge Coefficient
In general, the prediction of the natural circulation flow rates in the HL and SG tube bundle is fundamental to characterize system code transient prediction. So, the mass flow in the HL and the SG tube bundle must be accurate predicted by the code.
The proposed approach establishes the HL flow rates in a system code model using a discharge coefficient Cd [82]. This method is adapted from a paper by Leach and Thompson [83] that uses
scaling arguments to establish that the flow rate is proportional to a densimetric Froude number1. For application to the system code model for a HL from Figure 7-8, the following assumptions are made i.e. for loop 1(same assumptions are made for others loops) [77]:
1
- the hot density 𝜌ℎ, is obtained from cell 2205 that feeds the upper HL. The flow conditions
entering the HL from cell 2205 are assumed to represent the average conditions in the upper plenum. Similarly, the properties of the flow from the inlet plenum to the lower HL are used to determine the cold density 𝜌𝑐. A mass-weighted cold density is obtained from the flows entering the lower HL from inlet plenum volumes 104 and 105. The density difference and average density are computed from these values.
- the full HL diameter is used in the correlation (not the smaller diameter of the individual upper and lower pipes).
- the volumetric flow rate, 𝑞, is determined by dividing the mass flow rate by the average density. A net mass flow from the vessel to the SG is used, and this value is obtained at the junction between volumes 102 and 122, FL 327.
Figure 7-8 - Active nodalization of Loop 1 HL and SG inlet plenum during natural circulation conditions
Flow-loss coefficients can be adjusted to ensure q equation is satisfied.
Figure 7-9 shows the results of mass flow rates during natural circulation phase in the accident transient progression.
7.6 Core Degradation Modelling
The core melt progression modelling options have been set to be consistent with current best-practices guidelines [74]. The fuel rod cladding ruptures at relatively low temperature (i.e., modelled at 800°C in MELCOR) and 55 releases fission gases from the fuel-cladding gap. As the fuel temperature increases, an oxide shell forms on the outer surface of the fuel cladding. Since the oxide shell has a higher melting temperature than the unoxidized Zircaloy inside of the fuel rod, the Zircaloy on the interior of the cladding will become molten once the temperature rises above the melting temperature. The molten Zircaloy flows through cracks in the cladding and relocates downward, which leaves a thin Zircaloy oxide shell holding the fuel pellets. Following the relocation of the molten Zircaloy, the local power due to Zircaloy oxidation ceases. The subsequent local thermal response is governed by decay heat and any relocation of molten material from above.
The calculated failure rod collapse mechanisms include: - failure collapse due to melting the oxidized shell; - failure collapse of the supporting structure;
- time-at-temperature model that calculates the failure collapse of the oxidized Zircaloy shell holding the fuel rods;
7.6.1 Core blockage model
A “flow blockage” model was added to account for redistribution of flow through a reactor core as a result of changed flow resistance, reduction of area, or even a total blocking of flow, within various parts of the core when intact geometry is lost and a debris bed or pool forms.
The distinction between particulate debris above and below the blockage is maintained by adding the former to the “intact” (as distinct from “conglomerate”) portion of the molten pool component [87]. Therefore, the relocating particulate debris is thermally equilibrated with the existing molten pool.
7.7 Vessel Lower Head Failure and Debris Ejection
MELCOR models heat transfer between lower head, molten pools, debris and penetrations, with a two-dimensional radial and azimuthal conduction through the vessel wall [74].
Lower Head Failure – LHF has modelled only with gross creep rupture, measured to be the most likely in the SNL LHF tests [90]. The lower head creep rupture model uses the code’s default settings. A Larson-Miller parameter is calculated using a one-dimensional temperature profile through the lower head. A cumulative strain is calculated using a lifetime rule and failure occurs with an 18% strain. Penetration failure is not modelled as a mechanism for vessel failure, setting a failure temperature of the penetrations (TPFAIL) of 9999 K [74].
Upon vessel failure, molten and solid debris are assumed to discharge simultaneously. 7.8 Reactor SCRAM
Once LFW occur, SGs water levels go down. When SGs level decreases to 25% of SG narrow range, reactor SCRAM takes place and also the turbine is isolated via MSVI valves. Below (Figure 7-10 and Figure 7-11) reactor power versus time and control function SCRAM logic are shown. LFW takes place at 0s, SG level fall below 25% at 22 s, so reactor SCRAM will be at the same time.
Figure 7-10 - Reactor power / SCRAM control function
Figure 7-11 - Reactor power vs time 8. Steady State Results
Initial conditions of transient are given by a steady state MELCOR calculation, performed for 3000s. After a stabilization period, about 1000s, variation versus time of all parameters are negligible. Values are in general agreements with reference operational status.
Based on level 1 PSA deterministic analysis, an assessment is made for steady state qualification with following reference value[7] [51][52][69] (Table 8-1):
Reference
value MELCOR Acceptable error Actual error Reactor thermal power (MWth) 2775 2775 0.50% 0.00% Primary coolant flowrate (Kg/s) 13734 13700 1.00% 0.25% HL Pressure (bar) 155.1 155.1 0.10% 0.00% Core Inlet Temperature (K) 564.85 563.8 1.00% 0.19% Core Outlet Temperature (K) 601.75 598.3 1.00% 0.57% Feedwater temperature (K) 499.85 499.85 1.00% 0.00% Steam pressure turbine inlet (bar) 57.8 57.8 1.00% 0.55% Steam temp turbine inlet (K) 543 546 1.00% 0.86% Steam flowrate turbine inlet (Kg/s) 1517 1530 0.10% 0.00% Heat-transfer area in a SG (𝑚2) 4746 4746 2.00% 0.00%
Containment free volume (𝑚3) 50400 50400 0.50% 0.00%
Table 8-1 - Steady State qualification
Figure 8-2 – Cold Legs mass flow rate 9. RESULTS
Unmitigated LFW is assumed to take place at reactor full power. This scenario is implemented in MELCOR using the following initiator events and limiting conditions:
Time = 0 s Main feed water loss
Time = 0 s Auxiliary feed water unavailable
HPIS and LPIS, low and high-pressure safety injection unavailable during the whole transient
SCRAM take place when SG liquid level falls below 25% narrow range. MSIV – Mean Steam Isolation Valve close at SCRAM. RCPs tripped when low secondary side SG liquid minimum level is reached. The main event description table is reported below.
Event Description Time
Seconds hh:mm Initiating event LFW – Loss of Feedwater 0 0s Reactor SCRAM MSVI close 22 22s First SGs SRV opening 30 30s RCPs trip 3154 00:52 SG dryout 3320 00:55 PRZ SRV opens 3696 01:01
PRZ relief tank rupture disk opens 5170 01:26 Start of fuel rods uncover 5584 01:33 Start of containment sprays 6902 01:55 Start of fuel heatup 7580 02:06 First fission product gap releases 10642 02:57 Start of candling (ring 1) 12683 03:31 Start of particulate debris formation (ring 1) 12765 03:32 Start of failure of supporting structures 13666 03:47 Start of natural circulation in loop n1 15160 04:12 Creep rupture failure of the loop n1 HL 16350 04:32 Containment at design pressure 16360 04:32 Accumulators start discharging 16360 04:32 Isolation of accumulators 16430 04:33 Vessel lower head failure by creep rupture 31262 08:41 End of calculation 36600 10:10
![Figure 3-1: BWR Plant [40]](https://thumb-eu.123doks.com/thumbv2/123dokorg/5606418.67960/12.893.107.628.732.1013/figure-bwr-plant.webp)
![Figure 3-2: Cross section of the Fukushima Daiichi construction site [41]](https://thumb-eu.123doks.com/thumbv2/123dokorg/5606418.67960/13.893.121.593.674.932/figure-cross-section-fukushima-daiichi-construction-site.webp)
![Figure 3-3: Layout of Fukushima Daiichi NPP [42] 3.3 The accident](https://thumb-eu.123doks.com/thumbv2/123dokorg/5606418.67960/14.893.237.658.590.963/figure-layout-fukushima-daiichi-npp-accident.webp)
![Table 3-4: Unit 1, Fuel information [46] 3.6 CORE Model](https://thumb-eu.123doks.com/thumbv2/123dokorg/5606418.67960/18.893.110.788.139.941/table-unit-fuel-information-core-model.webp)