IAHR 2020 – ABSTRACT BOOK 473
6th IAHR Europe Congress, June 30th – July 2nd, 2020, Warsaw, Poland
Evaluation of a combined sediment yield and solid transport system in a small
alpine catchment
Francesca BERTENI1, Giovanna GROSSI2 1,2 Università degli Studi di Brescia, DICATAM, Italy
[email protected] [email protected]
ABSTRACT
Sediment yield and solid transport are often evaluated through mathematical models, since field data are rarely available. In this preliminary analysis, the sediment yield for an analysed rainfall event was estimated in the Guerna catchment (Italy), in order to create a combined sediment yield and solid transport system at the small basin scale. Sediment yield was estimated using the MUSLE equation in a GIS environment. Found values were used to set the input sediment load in the HEC-RAS model of the Guerna creek to simulate sediment transport. Results are comparable to measured values for another case study with similar features.
1. Introduction and study site
Erosion, transfer and deposition of soil particles are the subject of recent research in several fields of the earth sciences, as the result of the continuous increase in hydrogeological risk. A knowledge of these phenomena is important to predict sediment yields from local erosion rates and to provide estimates of on-site rates of erosion or soil degradation (Walling, 1983). The study area is the Guerna watershed, a small alpine basin (31 km2)
located in north central Italy. The average slope of the basin is about 50%, the maximum elevation is 1332 m a.s.l. and the minimum is 185 m a.s.l.
2. Methods
2.1. The MUSLE model
The MUSLE model was used because it takes into account specific runoff, which is highly correlated to sediment yield. This model was applied to many different basins around the world, in various land-use scenarios (Sadeghi et al., 2014).The sediment yield for the Guerna catchment for the 04/09/2011 high rainfall event was estimated in a GIS environment, using the MUSLE equation, and for the 7 sub-basins identified in this catchment. The MUSLE model (Williams, 1975) was implemented by solving the following equations:
ܻ௦=ܴௗܭ ܮܵ ܥ ܲ (1)
ܴௗ=଼ଽ.ೢ (ܳ ܸ).ହ (2)
where ܻ௦ – sediment yield [t ha-1], ܭ – soil erodibility factor [t ha h ha-1 MJ-1 mm-1] calculated using Romkens
et al. (1986) and the grain size distribution curve of the samples (determined by wet-sieving and sedimentation), ܮܵ – topographic factor [-] calculated using Moore and Burch’s equation (1986) and Nearing’s formula (1997) , ܥ – cover-management factor [-] and ܲ – supporting practices factor [-] calculated using the land use map, ܴௗ – event runoff factor [t ha-1 (unit of ܭ)-1], ܣ
௪ – watershed area [ha], ܳ – peak flow rate of
the flood event at outlet of the watershed [m3 s-1] and ܸ – volume of runoff event at outlet of the watershed
[m3]. Using the rainfall data of the event, the SCS-CN method (SCS, 1972) and the time-area routing scheme,
the hydrograph at the outlet of the basin was created in order to find ܳ and ܸ values. Both ܴௗ and ܭ factors were considered uniform in the Guerna catchment, unlike the other factors.
2.2. Version 5.0.7 of the River Analysis System (HEC-RAS)
A HEC-RAS model was developed for the Guerna creek in order to simulate sediment transport, in quasi-unsteady flow. The geometry of the cross sections was known and Manning’s coefficient n (0.03-0.05 s m-1/3)
was established by using photographs taken during the on-site investigation. Sediment transport was simulated using Wilcock and Crowe transport function (Wilcock and Crowe, 2003) because it is widely used to model sediment transport in heterogeneous sand-gravel mixtures, such as those present in the study area. The grain
474 IAHR 2020 – ABSTRACT BOOK
size distribution curve was determined by wet-sieving in three different points of Guerna creek bed and it was used to define bed gradation in the HEC-RAS model. In order to create a combined sediment yield and solid transport system, the sediment yield estimated using the MUSLE equation for the 7 identified sub-basins was used to set the input sediment load in the HEC-RAS model.Accordingly, the contributes of the 7 sub-basins were subtracted from the computed sediment yield of the entire Guerna catchment and the remainder was divided by the number of the other internal cross sections in the Guerna creek to obtain the sediment load input. Hydrographs at the outlet of the 7 sub-basins were used in the HEC-RAS model as input flow series. Finally, the contributes of the 7 sub-basins were subtracted from the volume of runoff calculated at the outlet of the Guerna catchment and the remainder was divided by the number of internal cross sections to obtain the uniform lateral flow input.
3. Results and discussion
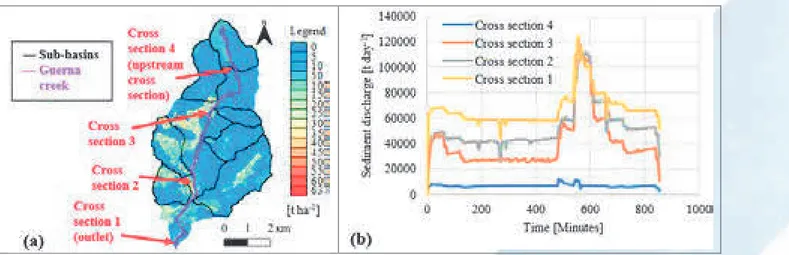
Through the application of the MUSLE model, the map of computed sediment yield in the study area was built (see Fig.1(a)) for the 2011 flood event; the mean specific and total annual values (ܻ௦_= 32.5 t ha-1 and
ܻ௦ି௧௧_= 98880 t respectively) for the whole catchment were computed as well. The simulation of the sediment
discharge was performed for 4 different cross sections of the HEC-RAS model (see Fig.1(a) and Fig.1(b)) showing a mean value of 6632 t day-1 at the upstream cross section and 66810 t day-1 at the outlet.
Fig. 1. Panel (a) shows Guerna catchment map of computed sediment yield (Ys) for the 2011 flood event applying MUSLE model, the 7 sub-basins and the position of the 4 cross sections analysed in the HEC-RAS model. Panel (b) shows the simulation of the sediment discharge.
Simulated sediment discharge values can be considered satisfactory, when compared to the field results for the 14/09/1994 flood event in the Rio Cordon catchment, a small area of 5 km2, located in northeastern Italy and
with similar geomorphological features (Lenzi et al., 2004).
4. Conclusion
An assessment of the sediment yield using the MUSLE equation, as input material into the HEC-RAS model of the Guerna creek, was conducted: the goal was the simulation of sediment transport. Even if this is only a preliminary analysis, results can be considered satisfactory because they are comparable to the field values obtained for another case study, with similar geomorphological characteristics. Future developments concern the improvement of the calibration process using field data in order to validate the achieved results, both in the MUSLE and in the HEC-RAS model, to make them usable by local water resources managers.
References
Lenzi MA, Mao L, Comiti F (2004) Magnitude-frequency analysis of bed load data in an Alpine boulder bed stream, Water Resour. Res., 40, W07201
Moore I, Burch G (1986) Physical basis of the length-slope factor in the universal soil loss equation, S.S.S.A.J., 50, 1294-1298 Nearing MA (1997) A single, continuous function for slope steepness influence on soil loss, S.S.S.A.J., 61(3), 917-919
Romkens MJM, Prased SN, Poesen JWA (1986) Soil erodibility and properties, Trans. 13th congress of the Int. Soc. of Soil Sci.,
Hamburg, Germany 5, 492-504
Sadeghi SHR, Gholami L, Khaledi Darvishan A, Saeidi P (2014) A review of the application of the MUSLE model worldwide, Hydrolog. Sci. J., 59:2, 365-375
Soil Conservation Service (SCS) (1972) National Engineering Handbook, Section 4, Hydrology Walling DE (1983) The sediment delivery problem, Journal of Hydrology, 65, 209-237
Wilcock PR, Crowe JC (2003) Surface-based Transport Model for Mixed-Size Sediment, J. Hydraul. Eng. (ASCE), 129(2), 120-128 Williams JS (1975) Sediment-yield prediction with universal equation using runoff energy factor, In: Present and prospective technology for predicting sediment yield and sources, Sediment-Yield Workshop, USDA, ARS.S-40, U.S. Department of Agriculture, Agricultural Research Service, 244-252 pp.