Edited by: Marcello Mastrorilli, Consiglio per la Ricerca in Agricoltura e l’Analisi dell’economia Agraria (CREA), Italy Reviewed by: Mark Laing, University of KwaZulu-Natal, South Africa Carmen Arena, University of Naples Federico II, Italy *Correspondence: Alessandra Fracasso [email protected]
Specialty section: This article was submitted to Crop Science and Horticulture, a section of the journal Frontiers in Plant Science Received: 03 March 2017 Accepted: 19 May 2017 Published: 31 May 2017 Citation: Fracasso A, Magnanini E, Marocco A and Amaducci S (2017) Real-Time Determination of Photosynthesis, Transpiration, Water-Use Efficiency and Gene Expression of Two Sorghum bicolor (Moench) Genotypes Subjected to Dry-Down. Front. Plant Sci. 8:932. doi: 10.3389/fpls.2017.00932
Real-Time Determination of
Photosynthesis, Transpiration,
Water-Use Efficiency and Gene
Expression of Two Sorghum bicolor
(Moench) Genotypes Subjected to
Dry-Down
Alessandra Fracasso *, Eugenio Magnanini, Adriano Marocco and Stefano Amaducci Department of Sustainable Crop Production, Università Cattolica del Sacro Cuore, Piacenza, Italy
Plant growth and productivity are strongly affected by limited water availability in drought prone environments. The current climate change scenario, characterized by long periods without precipitations followed by short but intense rainfall, forces plants to implement different strategies to cope with drought stress. Understanding how plants use water during periods of limited water availability is of primary importance to identify and select the best adapted genotypes to a certain environment. Two sorghum genotypes IS22330 and IS20351, previously characterized as drought tolerant and drought sensitive genotypes, were subjected to progressive drought stress through a dry-down experiment. A whole-canopy multi-chamber system was used to determine the in vivo water use efficiency (WUE). This system records whole-canopy net photosynthetic and transpiration rate of 12 chambers five times per hour allowing the calculation of whole-canopy instantaneous WUE daily trends. Daily net photosynthesis and transpiration rates were coupled with gene expression dynamics of five drought related genes. Under drought stress, the tolerant genotype increased expression level for all the genes analyzed, whilst the opposite trend was highlighted by the drought sensitive genotype. Correlation between gene expression dynamics and gas exchange measurements allowed to identify three genes as valuable candidate to assess drought tolerance in sorghum.
Keywords: drought stress tolerance, whole canopy water use efficiency, gene expression dynamics, gas exchange, Sorghum bicolor
INTRODUCTION
Drought and problems related to water supply will be exacerbated under the current climate change scenario (ICPP, 2014). Efforts to increase water productivity in agriculture are essential to support an increasing demand for food, feed and energy. Breeding crops for high water use efficiency (WUE) could be a solution to secure adequate water for agriculture and to address food security (Hall and Richards, 2013), pursuing the slogan “more crop per drop” (Monaghan et al., 2013).
WUE does not have a single precise definition (Bacon, 2009) and its scale and unit of measurement vary greatly following the point of view of physiologists and agronomists (Condon et al., 2002). At single leaf level, WUE can be defined as the ratio between net assimilation and transpiration (instantaneous WUE) or as the ratio between net assimilation and stomatal conductance (intrinsic WUE). At canopy or field level, it is calculated as the yield of harvested product achieved from the water available to the crop through precipitation and/or irrigation (Condon et al., 2002). Lack of significant correlation between WUE measured at leaf level and WUE measured at whole canopy level has been reported (Tomás et al., 2012) and it was attributed to the inadequacy of single-leaf measurements to represent the spatial variability occurred at the whole-canopy level, or to the inadequacy of single-leaf measurements to take into account nocturnal water loss and respiration (Escalona et al., 2012), and changes in dry matter partitioning among different sinks (e.i. shoot or root) (Tomás et al., 2014). In addition, punctual single-leaf measurements are inadequate to represent the temporal variability that occurs along the day and during the entire crop growing period. For these reasons, we choose to investigate the instantaneous WUE at canopy level using an automated multi-chamber whole-canopy system that allows for continuous monitoring of net photosynthetic (Pn) and transpiration (E) rate. Numerous researches have been carried out on trees using whole-canopy gas exchange systems (Dragoni et al., 2005; Intrigliolo et al., 2009; Rodrigues et al., 2016), but very few are reported on field crops (Timlin et al., 2006; Cantore et al., 2009; Cabrera-Bosquet et al., 2011) and none on sorghum.
Sorghum bicolor (Moench) is a C4 multipurpose crop valuable for food, feed, fiber and fuel production (Paterson et al., 2005), and well adapted to drought-prone environments due to its deep and dense root system (Stone et al., 2001), its thick leaf wax (Cannon and Kummerow, 1957), its osmotic adjustment (Dugas et al., 2011) and its high photosynthetic efficiency under drought (Zegada-Lizarazu et al., 2012). For this sorghum was also recently considered as a sustainable crop for biogas production in marginal environments (Amaducci et al., 2016).
Breeding for improved WUE crops was pursued also at molecular level. For example, wheat plant transformed with HVA1 gene from barley showed modified WUE (Sivamani et al., 2000); the same approach was used to transform rice plants with the salt and drought tolerant gene HARDY from Arabidopsis (Karaba et al., 2007) in order to improve WUE. In addition, in Arabidopsis was also identified on chromosome 2 a QTL for WUE and assigned to the ERECTA gene (Masle et al., 2005).
In the present study CO2 and water vapor gas exchange
of two sorghum genotypes IS20351 and IS22330, previously characterized as drought sensitive and drought tolerant respectively (Fracasso et al., 2016b), were continuously monitored for 2 weeks in 2015. Whole-canopy instantaneous WUE (wcWUEi) was calculated as the ratio between
whole-canopy Pn and E from the onset of water stress until the end of the experiment (11th leaf). The expression trend of five drought related genes was monitored every 4 h on plants that had been subjected to severe drought stress for 7 days. The objective of the present study was: (a) assess the diurnal gas exchange
dynamics of two sorghum genotypes, explore the variation in Pn, E, and wcWUEiunder increasing drought stress and confirm
the strategies adopted by the sorghum genotypes to cope with drought stress; (b) establish which gene could better explain the variation in Pn, E, and wcWUEiencountered during the day and
which gene could be used as a proxy for drought tolerance and a potential candidate for genetic improvement in sorghum.
MATERIALS AND METHODS
Plant Material, Growth Conditions, and
Experimental Design
Two sorghum genotypes, belonging to the durra race and characterized as drought sensitive and drought tolerant in a previous study (Fracasso et al., 2016b), were cultivated in 2015 in a dry-down pot experiment. The genotypes, IS20351 and IS22330, are part of the germoplasm collection of CIRAD and were provided by the CRB-T (Centre de Resources Biologiques Tropicales) CIRAD Montpellier. Germination of seeds was carried out in Petri dishes at 25◦
C and in dark conditions for 3 days. Germinated seeds were planted in plastic pots (0.016 m3 capacity), filled with a base layer of sand to guarantee drainage and 8 kg of a soil mixture (topsoil and zeolite 3:1 in volume). Each pot was planted with five germinated seeds, that were thinned to one healthy plant per pot when the 4th leaf appeared.
The plants were grown in a growth chamber with 13 h of light and 27–23◦
C day-night temperature until the 7th leaf appeared on the main stem. At this stage the leaf area (LA) of each plant was calculated every week following the procedure described in Fracasso et al. (2016a). To perform whole-canopy WUEi
determination, the plants were then moved in a greenhouse under LED lamps. Light intensity under each LED lamp was measured with a ceptometer (AccuPAR LP80, Decagon Devices, USA) and decreased from 1,500 micromoles PPFD at 20 cm from the LED lamp, to 700 micromoles at 60 cm from the LED lamp with a light extinction coefficient, calculated according the Lambert and Beer Law, of 7.33.
Six plants for each genotype were randomly assigned to a well-watered (WW) or to a water-stressed (WS) treatment. All the plants were kept above 0.7 FTSW values until the 39th DAE (day after emergence) by supplying manually a daily amount of water calculated following the gravimetric method. Starting on the 40th DAE a progressive water deficit was imposed to the WS plants withholding irrigation. Water deficit was represented as the Fraction of Transpirable Soil Water (FTSW) calculated as in
Luquet et al. (2008):
FTSW = ASWC TTSW =
SWC − WP FC − WP
Where Total Transpirable Soil Water (TTSW) content was determined as the difference between the Soil Water Content (SWC) at Field Capacity (FC) and that at Wilting Point (WP). Both FC and WP were determined in a preliminary experiment (data not shown). FC was the soil water content left in the soil after complete drainage of excess water while WP was the residual water left in the soil after sorghum plants were grown until
complete wilting. ASWC was the Available Soil Water Content, calculated subtracting the soil water content at WP from the actual soil water content SWC. During the experiment six pots were weighed by an automated weigh system.
On the 38th DAE, the top of the pots was covered with PVC bags. A little slit was cut at the bottom of the plastic bag to allow the sorghum plant to grow through it. The slit was sealed with adhesive packing tape around plant collars to avoid evaporation losses from the soil surface. The plants were put inside the multi-chamber gas-exchange apparatus for gas exchange measurements on 44th DAE. The dry-down phase was followed by 7 days in which FTSW in the soil was keep stable at 0.15, providing the daily transpired water to WS plants at the end of each day. On 60th DAE, after seven days at 0.15 FTSW, leaf samples from three biological replicates were collected at 4 h intervals from 6 a.m. to 6 p.m. 2 g of leaf tissue from the last two fully opened leaves were immediately frozen in liquid nitrogen for qRT-PCR analysis.
The Multi-Chamber Gas Exchange System
Whole-canopy photosynthesis and transpiration were determined with a self-assembled multi-chamber gas exchange apparatus. It consists of 12 cylindrical chambers made of flexible plastic polyethylene with polymethylmethacrylate tops (allowing 93 and 87% of light transmission respectively and no alteration of light spectrum). The volume of the chambers is variable and during the present experiment was 0.157 m3
± 0.06 (0.8 m height, 0.5 m diameter). A CIRAS-DC double channel absolute CO2/H2O infrared gas analyser (PP-System,
Amesbury, MA) combined to a CR1000 datalogger wired to an AM16/32B Multiplexer (Campbell Scientific, Logan, UT) are used to analyse air at the inlet and outlet of each chamber following a program described in Poni et al. (2014). Air is drawn from outside the greenhouse at 3 m above ground, it is forced, with two centrifugal blowers (Vorticent C25/2M Vortice, Milan, Italy), through a buffer tank (0.44 m3 capacity) to ensure the stability of inlet CO2concentration and then it is
blown to the chambers through 50 mm diameter rigid plastic pipes. Air sampling is switched from one chamber to another at programmed time intervals using a set of solenoid valves (model 177 B04/Z610, Sirai, Bussero, Italy). The air flow rate of each chamber is controlled by a baffle and measured at least 50 cm downstream the baffle itself with a digital manometer (Testo 510, Farnell, Lainate, Italy) according to a flow-restriction method (Osborne, 1977). A 22 mm inner-diameter ring was inserted inside the 50 mm pipe in order to achieve the flow restriction; the pressure drop of 9 mm water column, measured upstream and downstream from the ring, corresponded to 0.0028 m3s−1.
Two additional rotary vane pumps (model G 6/01-K-LCL; Gardner, Denver Thomas, Pucheim, Germany) with 33.3 cm3s−1 of flow rate were added before CIRAS-DC to speed the air flushing inside the sampling tubes and ensure the complete air exchange inside the CIRAS-DC when AM16/32B Multiplexer switches from one chamber to another one.
The ambient (inlet) air temperature and the air temperature of each chamber (outlet) were measured by shielded
external/internal (1/0.2 mm) diameter PFA-Teflon insulated type-T thermocouples (TC). The system was connected to an external laptop computer for checking and downloading data from the datalogger support software package LoggerNet (Campbell Scientific, Logan, UT).
The Whole-Canopy Gas Exchange
Measurements
Whole-canopy net photosynthetic rate (Pn) and transpiration rate (E) values were measured continuously, 24 h per day, using the multi-chamber system for the entire duration of the experiment, from the 44th DAE to the 59th DAE. The flow rate fed to the chambers was set at 0.0028 m3s−1 and kept constant throughout the entire duration of the experiment. The polyethylene chambers had a volume of 0.157 m3 ±
0.06, so the complete volume air change occurred at an interval of ∼60 s. Pn (µmol s−1 m−2) and E (mmol s−1 m−2) were calculated from flow rates and CO2 and water vapor
differentials using the formula provided inLong and Hällgren (1985).
RNA Extraction and Real-Time Reverse
Transcription-PCR Analysis
Leaf tissues were ground to a fine powder with liquid nitrogen using sterile mortars and pestles. RNA extraction was performed on 100 mg of plant material using TRIZOL reagent (EuroGold Trifast, EuroClone Ltd., Torquay, UK), purification was performed using RNA CleanUp protocol (Qiagen, Hilden, Germany) and treating the samples with RNase-Free DNase (Invitrogen, Carlsbad, CA) to avoid genomic DNA contamination during RNA purification. The concentration of total RNA fraction in each sample was estimated by spectrophotometric assay using Qubit 1.0 fluorometer (Invitrogen, Carlsbad, CA, USA). The cDNA was synthesized from total RNA following the iScript cDNA Synthesis Kit (Bio-Rad, Richmond, CA) and used for quantitative real-time PCR. Real-time PCR (CFX96TM Real-Time PCR machine; Bio-Rad Lab-oratories, Inc., Hercules, USA) was performed on the samples, and relative gene expression was determined using the 2−11Ct Ct method (Livak and Schmittgen, 2001).
The amplification reaction was optimized in a final volume of 20 µl containing 20 ng cDNA, 10 µl of 2X iQ SYBR Green Supermix (Bio-Rad, Richmond, CA) and 4 µM of each primer. The amplification was carried out according to the following protocol: 95◦
C for 3 min (1 cycle), 95◦
C for 15 s, 60◦
C for 1 min (39 cycle), melting curve analysis, with an increase in temperature of 0.5◦
C per s from 65 to 95◦
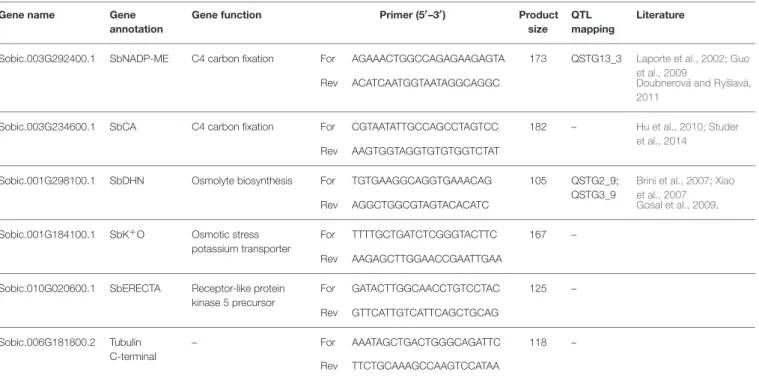
C. Three technical replicates were carried out for each of the three biological replicates tested at each stress condition for all the genotypes. Expression analysis was performed on five genes identified as potential targets of stomatal control and as responsible of photosynthesis (Pasini et al., 2014). Tubulin gene was used as reference gene to normalize relative quantification (Table 1). Expression ratio sand fold change (FC) were calculated using the 2−11Ct method.
TABLE 1 | Gene name, annotation, function, primer sequences, and product size, QTL mapping and references reported in literature of genes used in quantitative real-time PCR.
Gene name Gene
annotation
Gene function Primer (5′–3′) Product
size QTL mapping
Literature
Sobic.003G292400.1 SbNADP-ME C4 carbon fixation For AGAAACTGGCCAGAGAAGAGTA 173 QSTG13_3 Laporte et al., 2002; Guo et al., 2009
Rev ACATCAATGGTAATAGGCAGGC Doubnerová and Ryšlavá,
2011
Sobic.003G234600.1 SbCA C4 carbon fixation For CGTAATATTGCCAGCCTAGTCC 182 – Hu et al., 2010; Studer
et al., 2014
Rev AAGTGGTAGGTGTGTGGTCTAT
Sobic.001G298100.1 SbDHN Osmolyte biosynthesis For TGTGAAGGCAGGTGAAACAG 105 QSTG2_9;
QSTG3_9
Brini et al., 2007; Xiao et al., 2007
Rev AGGCTGGCGTAGTACACATC Gosal et al., 2009.
Sobic.001G184100.1 SbK+O Osmotic stress potassium transporter
For TTTTGCTGATCTCGGGTACTTC 167 –
Rev AAGAGCTTGGAACCGAATTGAA Sobic.010G020600.1 SbERECTA Receptor-like protein
kinase 5 precursor For GATACTTGGCAACCTGTCCTAC 125 – Rev GTTCATTGTCATTCAGCTGCAG Sobic.006G181800.2 Tubulin C-terminal – For AAATAGCTGACTGGGCAGATTC 118 – Rev TTCTGCAAAGCCAAGTCCATAA
STATISTICAL ANALYSIS
One-way ANOVA was carried out and, when the F-test was significant, mean separation was performed by the t-test at P < 0.05 and P <0.01. Degree of variation around means is given as standard error (SE).
RESULTS
Characterization of Drought Dynamics and
Whole-Canopy Gas Exchange
FTSW decreased for the water stressed (WS) plants after irrigation was with-held (40th DAE) and, when 0.15 FTSW was reached (52nd DAE), FTSW was kept constant to 0.15 for 7 days (Figure 1A).
The multi-chamber system ran continuously for 2 weeks from the 44th DAE to the 59th DAE.
The system recorded the air temperature entering (inlet) and leaving (outlet) the chambers. Mean daily temperature of inlet air was 23.7◦
C; mean daily temperature of outlet air was 25.4◦
C and 25.3◦C at the outlet of chambers hosting WW and WS plants respectively (Figure 1B). Air temperature was used to calculate air VPD from the 44th DAE to the 59th DAE as reported in
Figure 1B.
Mean daily Pn for WW IS20351 and WW IS22330 plants was constant for the entire duration of the experiment (Figures 2A,B). In both genotypes, Pn under WS conditions decreased proportionally to the decrease of FTSW, starting from the 49th DAE (Figures 2A,B). On average, Pn in the drought tolerant genotype IS22330 was significantly lower than Pn in the sensitive genotype IS20351 under both WW
and WS conditions (p < 0.05). A similar trend was also observed for E (Figures 2C,D). Under WW conditions, the drought tolerant genotype IS22330 had lower E compared to the drought sensitive IS20351 (1.85 and 2.44 mmol m2 s−1 for IS22330 and IS20351 respectively, p < 0.01). Under
WS conditions, from the 49th DAE to the 59th DAE, E decreased linearly for both genotypes, by about 22% (1.44 mmol m2s−1) and 27% (1.77 mmol m2s−1) for IS22330 and IS20351 respectively.
Whole-canopy instantaneous WUE (wcWUEi) expressed as
Pn/E ratio (µmol CO2/ mmol H2O) was similar for both
genotypes and water treatments at the beginning of the experiment and it became statistically different between water treatments (p < 0.05) only under limiting FTSW (0.15 FTSW). In IS20351, wcWUEiwas higher in WS plants than in WW plants
from the 55th DAE onwards (Figure 2E, p < 0.05), while in IS22330 wcWUEistarted to be significantly different between WS
and WW plants from the 53rd DAE (Figure 2F, p < 0.01). On average wcWUEiunder WS conditions was 10.0 and 11.1 µmol
CO2/mmol H2O for IS20351 and IS22330 respectively.
Diurnal variation of air VPD, temperature, Pn, E and wcWUEi
reported in Figure 3 is representative of three moments of the dry-down experiment: before the water stress occurred (0.70 FTSW for WS plants, 44th DAE, Figures 3A–D), at 0.45 FTSW (47th DAE, Figures 3E–H) and at 0.15 FTSW (59th DAE,
Figures 3I,L–N). Diurnal direct and diffuse light was constant for the entire duration of the experiment, from 7 a.m. to 7 p.m., when LED lights were on.
Before drought stress occurred (0.70 FTSW, 44th DAE) Pn was constant throughout the day and had similar values in both genotypes and water treatments (Figure 3B). Daily E increased
FIGURE 1 | Fraction of transpirable soil water (FTSW) dynamics, air temperature and air VPD recorded during the dry-down experiment carried out on two Sorghum bicolorgenotypes. (A) The FTSW dynamics is presented in function of the day after plant emergence (DAE); the empty circles represent the plants under water stress (WS) while the full circles the well-watered (WW) plants. Vertical dotted lines indicate the date in which hourly Pn, E and wcWUEiwere analyzed. Mean of 3 ± SE. (B) Air temperature of inlet, and outlet of WW and WS plants, and air VPD. Mean 3 ± SE.
during the day reaching its maximum at 3 p.m. (Figure 3C) when the maximum air VPD occurred (Figure 3A). wcWUEi
decreased progressively throughout the day without significant differences between treatments and genotypes (Figure 3D).
On the 47th DAE (0.45 FTSW) starting from 1 pm, the WS plants of the drought sensitive genotype IS20351 reduced Pn by 26% compared to the WW IS20351 plants (Figure 3F, p < 0.01). Pn of WS IS22330 plants was not reduced compared to WW IS22330 plants (Figure 3F) and it was stable during the day. The daily trend of E was the same recorded on the 44th DAE with differences in the absolute values due to the lower FTSW (Figure 3G). At 0.45 FTSW, E of WS IS20351 plants decreased on average by 24% compared to WW IS20351 plants; the decrease
in E of WS IS20351 plants started from 12 p.m. and lasted until 6 p.m. (p < 0.01). At the same level of FTSW, E of WS IS22330 plants did not decrease compared to WW IS22330 plants; the E daily trend was constant throughout the day from 7 a.m. to 7 p.m. (Figure 3G). wcWUEiat 0.45 FTSW was 24% higher than
WUEirecorded at 0.70 FTSW on the 44th DAE (p < 0.1), but
no differences between treatments or genotypes were identified (Figure 3H).
After 7 days at 0.15 FTSW (59th DAE), Pn of WS plants was on average reduced by 35% in IS20351 and by 40% in IS22330 compared to the WW plants (p < 0.01). The Pn reduction started for both the genotypes from 9 a.m. (Figure 3L) when VPD started to increase (Figure 3I, p < 0.01). E was largely affected at low
FIGURE 2 | Net photosynthetic rate, transpiration rate and whole-canopy WUEirecorded during the experiment for the two genotype IS20351 and IS22330 under well-watered (WW) and water-stressed (WS) conditions. (A,B) net photosynthetic rate (Pn, µmol m−2s−1) recorded from 44th DAE to 59th DAE for IS20351 and IS22330 respectively; (C,D) transpiration rate (E, mmol m−2s−1) recorded from 44th DAE to 59th DAE for IS20351 and IS22330 respectively; (E,F) whole-canopy WUEi(wcWUEi, µmol CO2/ mmol H2O) recorded from 44th DAE to 59th DAE for IS20351 and IS22330 respectively. The red symbols represent the plants under water stress (WS) while the blue circles the well-watered (WW) plants. Symbols with highlighted black outline are statistically significant (p < 0.05). Mean of 3 ± SE.
FTSW and it decreased: by 45 and 47% with respect to WW conditions respectively for IS20351 and IS22330 (Figure 3M). Daily course of E was different for WS plants of IS20351 and IS22330: in the drought sensitive genotype IS20351 E increased from 12 p.m. to 6 p.m. (Figure 3M, p < 0.01) following the VPD trend, while in the drought tolerant genotype IS22330 E was stable throughout the day (Figure 3M). As a consequence, at 0.15 FTSW (59th DAE), the difference in wcWUEibetween WS
and WW plants was statistically significant (Figure 3N, p < 0.05) for both genotypes. Furthermore, the difference in wcWUEi of
WS plants was also significant between the two genotypes being wcWUEi11.28 and 13.21 µmol CO2/mmol H2O respectively for
IS20351 and IS22330 (p < 0.05).
Gene Expression Dynamics
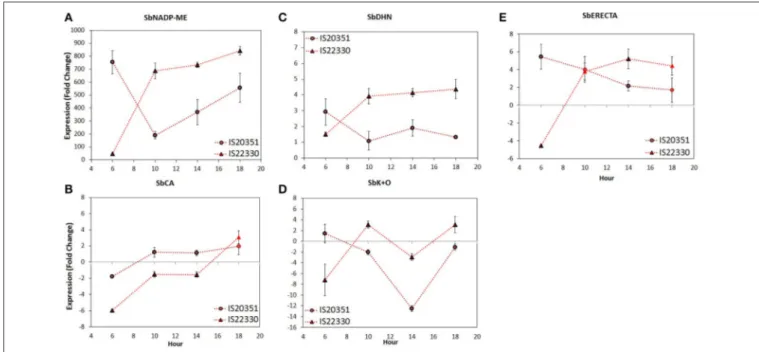
Previous transcriptomic analysis of sorghum under drought stress and control conditions (Pasini et al., 2014; Fracasso et al., 2016a,b) identified five candidate genes differentially expressed under stress. Their names, annotations, functions and information about co-localization with QTL for drought tolerance are described in Table 1. Expression of these five candidate genes under WS and WW conditions was analyzed using Q-PCR. The gene expression analysis, carried out following the 2−11Ctmethod, revealed during the day two different gene
expression profiles for IS20351 and IS22330 (Figure 4). These profiles could be grouped in two main clusters: (i) in the first one, gene expression profiles increased during the day (it was observed
FIGURE 3 | Daily air VPD and air temperature (A,E,I), net photosynthetic rate (B,F,J), transpiration rate (C,G,K), and whole-canopy WUEi(D,H,L) recorded at 0.70 (44th DAE), 0.45 (47th DAE) and 0.15 FTSW (59th DAE) for the two genotype IS20351 (circles) and IS22330 (triangles) under well-watered (WW) and water-stressed (WS) conditions. The red symbols represent the plants under water stress (WS) while the blue circles the well-watered (WW) plants. Symbols with highlighted black outline are statistically significant (p < 0.05).
mainly for the drought tolerant genotype IS22330); (ii) in the second one, gene expression profiles decreased during the day (represented mainly by the drought sensitive genotype IS20351). The only exception to this trend was represented by SbCA that increased its expression during the day in both genotypes.
The SbNADP-ME expression profile of IS22330 showed an abrupt increase from 6 a.m. to 10 a.m., followed by a slight increase until 6 p.m. (p < 0.01). For IS20351 an abrupt decrease between 6 a.m. and 10 a.m. was followed by a linear increase from 10 a.m. to 6 p.m. (Figure 4A, p < 0.05).
The expression profile of SbCA, that were similar for both genotypes, increased slightly from 6 a.m. to 10 a.m. and from 2
p.m. to 6 p.m. (p < 0.05), while it was stable between 10 a.m. and 2 p.m. (Figure 4B, p < 0.05).
The SbDHN expression profile increased for the drought tolerant IS22330 from 6 a.m. to 10 a.m. (p < 0.05) and then remained stable for all the day. In the drought sensitive genotype IS20351, SbDHN expression profile decreased from 6 a.m. to 10 a.m. (p < 0.05) and then it remained stable for all the day. The expression values of IS20351 were 2-times lower than values for IS22330 (Figure 4C).
The expression profile of SbK+O increased abruptly from 6 a.m. to 10 a.m. in the drought tolerant genotype IS22330 (p < 0.01), it decreased at 2 p.m. and increased again at 6
p.m. (Figure 4D, p < 0.05). In the drought sensitive genotype IS20351 a slightly decrease was observed from 6 a.m. to 10 a.m. followed by an abrupt decrease at 2 p.m. and an increase at 6 p.m. (Figure 4D, p < 0.05).
The SbERECTA expression profile abruptly increased from 6 a.m. to 10 a.m. in IS22330 and then it remained stable until 6 p.m. (Figure 4E, p < 0.01). On the other hand, in IS20351 a slightly decrease of SbERECTA expression was observed along the day from 6 a.m. to 6 p.m. (n.s.).
On average the expression of SbNADP-ME, SbDHN, SbK+O, and SbERECTA in the drought tolerant IS22330 was higher than in the sensitive genotype IS20351 (p < 0.05). The only exception was represented by SbCA for which gene expression in the drought sensitive genotype IS20351 was higher than in the drought tolerant IS22330. A Pearson correlation matrix between gene expression and physiological data of Pn, E and wcWUEi
recorded on 59th DAE was calculated separately for the two genotypes (Table 2). Positive and strong correlations between physiological data and gene expression were found in the drought tolerant genotype IS22330, whilst negative correlations were found for the drought sensitive IS20351. In particular SbNADP-ME, SbDHN, and SbERECTA were highly positively correlated with Pn and E in IS22330 whilst they were negatively correlated in IS20351 (Table 2). In IS22330 SbDHN and SbERECTA positively correlated with SbNADP-ME. The same correlation was weaker in the sensitive IS20351 (Table 2). The correlation between SbCA and SbNADP-ME, SbDHN, and SbERECTA was positive in the tolerant IS22330 and negative in the sensitive IS20351 (Table 2). The same was observed for the correlation between SbK+O and SbCA and between SbK+O and Pn or E (Table 2).
DISCUSSION
The Discriminating Capacity of the
Whole-Canopy Multi-Chamber System
The high number of measurements that the whole-canopy multi-chamber system records in 1 day (120 for each one of the 12 whole-canopy chambers, one measurement per chamber every 12 min) enabled the identification of relevant physiological parameters. Confirming results obtained with similar systems (Poni et al., 2014; Rodrigues et al., 2016), our system measured effectively the diurnal gas exchange dynamics of both WW and WS plants. Changes in Pn and E induced by air temperature, VPD and soil water availability (FTSW) were continuously and non-destructively measured by the system and gathered in a rich database that was used to confirm the strategies adopted by IS20351 and IS22330 to cope with drought stress, previously hypothesized by Fracasso et al. (2016a,b).
In fact, stress at 0.45 FTSW (47th DAE) induced a decrease in Pn and E only in WS IS20351 plants but not in WS IS22330 plants (Figures 3F,G). This implies that while for IS20351 the value of 0.45 FTSW makes Pn and E sensitive to VPD, for the tolerant genotype IS22330 this value is not yet limiting. This confirms and reinforces results obtained from a previous experiment in which gas exchange were measured at leaf level on the same genotypes
(Fracasso et al., 2016a). According toFracasso et al. (2016a), the threshold value of FTSW, below which E was limited, was higher in the sensitive genotype than in the tolerant one.
The strategy, classified as “pessimistic” according to Jones (1980), adopted by the tolerant IS22330 genotype was evident under severe stress conditions (0.15 FTSW, Figure 3L–N). While E of WS IS20351 plants still increased during the day following the VPD trend (even though to a lower extent compared to E-values recorded at 0.45 and 0.70 FTSW), E of WS IS22330 remained stable with a slight decrease around 11 a.m. (Figure 3M), when VPD started to increase.
Since Pn of WS IS20351 and WS IS22330 plants was similar at 0.15 FTSW, the differences encountered in wcWUEiof WS
IS20351 and WS IS22330 were due to E, that was mainly affected by VPD. Whole-canopy WUEivalues were different from WUEi
calculated at leaf level inFracasso et al. (2016b). While at leaf level WUEi of WS plants decreased according to decreasing
FTSW, at whole-canopy level WUEiof WS plants increased with
the decreasing FTSW. Our results confirm previous findings of Tomás et al. (2012) and the inadequacy of single-leaf measurements to represent the spatial and temporal variability occurred at whole-canopy level. In addition, our results clearly highlighted that, when water shortage become severe (0.15 FTSW), wcWUEiof WS plants is higher than wcWUEiof WW
plants (Figure 3N), which is in contrast to whatPoni et al. (2014)
found in grapevine. The increase in wcWUEiencountered in WS
plants was observed also in other species (Condon et al., 2002; Gilbert et al., 2011; Liu et al., 2016)
Drought Related Proxy Genes
The second objective of this study (b) was to evaluate the gene expression dynamics of five drought related genes, identified in previous experiments (Pasini et al., 2014; Fracasso et al., 2016b), to assess which one explains the larger daily variation of Pn, E, and wcWUEiand therefore to identify a proxy gene for
whole-canopy WUEiestimation. The differences in gene expression and
their correlation with physiological parameters were extremely evident in this experiment (Table 2).
Coding for the NADP-malic enzyme and for a carbonic anhydrase, SbNADP-ME and SbCA are the most important enzymes in the C4cycle involved respectively in the production of
NADPH and in the provision of HCO3−to phosphoenolpyruvate carboxylase (PEPC), the latter involved also in the control of stomata aperture (Hu et al., 2010). Plants transformed with NADP-ME showed increased drought avoidance and soil water conservation (Guo et al., 2009; Doubnerová and Ryšlavá, 2011). The correlation existing between high NADP-ME expression level and low stomatal conductance reported byLaporte et al. (2002), was confirmed in the present study. The drought tolerant genotype IS22330 had, in fact, higher NADP-ME expression level than the sensitive IS20351, that resulted in a lower Pn and E compared to IS20351. CA has been proposed, together with aquaporins family, as responsible for rapid regulation of gm(conductance of mesophyll) (Perez-Martin et al., 2014). CA
activity are directly proportional to gm even if this relation
is species dependent (Gillon and Yakir, 2001). The low gene expression value of SbCA, recorded in the drought tolerant
FIGURE 4 | Gene expression level of SbNADP-ME (A), SbCA (B), SbDHN (C), SbK+O (D), and SbERECTA (E) recorded on 60th DAE at 0.15 FTSW for the two genotype IS20351 (circles) and IS22330 (triangles) under water-stressed (WS) conditions. Symbols with highlighted black outline are statistically significant (p < 0.05). Mean of 9 ± SE for gene expression data.
TABLE 2 | Values of Pearson correlation performed between physiological measurements and gene expression levels recorded every 4 h for the drought sensitive IS20351 and the drought tolerant IS22330 sorghum genotype.
IS20351 Pn E wcWUEi VPD SbNADP-ME SbCA SbDHN SbK+O SbERECTA
Pn – E 0.96 – WUE −0.56 −0.99 – VPD 0.95 0.99 −0.91 – SbNADP-ME −0.79 −0.63 −0.79 −0.64 – SbCA 0.97 0.95 −0.32 0.91 −0.65 – SbDHN −0.90 −0.77 −0.81 −0.71 0.79 −0.91 – SbK+O −0.56 −0.67 0.54 −0.75 0.47 −0.41 0.16 – SbERECTA −0.82 −0.93 0.96 −0.91 0.30 −0.87 0.59 0.57 –
IS22330 Pn E wcWUEi VPD SbNADP-ME SbCA SbDHN SbK+O SbERECTA
Pn – E 0.99 – WUE 0.74 −0.57 – VPD 0.88 0.92 −0.68 – SbNADP-ME 0.96 1.00 −0.90 0.94 – SbCA 0.79 0.88 −0.73 0.76 0.90 – SbDHN 0.97 1.00 −0.97 0.95 1.00 0.87 – SbK+O 0.88 0.87 0.23 0.61 0.83 0.83 0.82 – SbERECTA 0.96 0.98 −0.64 0.98 0.98 0.80 0.99 0.75 –
Different colors indicate the positive (green) or the negative (red) Pearson correlation found.
IS22330 genotype and reflected in the lower Pn and E-values recorded under severe drought stress conditions (0.15 FTSW), makes this gene a potentially useful proxy for drought tolerance
screening. The daily trends of SbNADP-ME and SbCA expression confirmed that the strategy adopted by IS22330 to cope with drought, relies on the accurate control of stomatal openings,
which confirms what was previously hypothesized byFracasso et al. (2016a).
SbDHN is involved in the dehydrin biosynthetic pathway and codes for one of the hydrophilic globular proteins called also late embryogenesis abundant (LEA) proteins. These proteins accumulate in response to drought stress protecting plants by maintaining the cell membrane structure and ion balance (Gosal et al., 2009), or acting as molecular chaperones (Chandra Babu et al., 2004). As recently showed (Fracasso et al., 2016a), SbDHN could be a suitable tools to screen sorghum genotypes for drought tolerance. This is further confirmed in the present study where, under severe drought stress conditions, SbDHN was more expressed in the drought tolerant genotype IS22330 than in the sensitive IS20351, and was more strongly correlated to SbERECTA (with positive correlation) and to whole-canopy WUEi(with negative correlation) in the tolerant IS22330 than
in the IS20351.
The opening of stomata apertures requires the uptake of potassium ions into guard cells. The responsible of this uptake are potassium channels and pumps that have been identified on the cell membrane of the guard cells (Schroeder et al., 1984). Ion release from guard cells causes, on the other hand, the closure of stomata apertures. Other ion channels are involved in the release of ions from guard cells, causing an osmotic efflux of water out of the guard cells and the following cell shrinkage and closure of stomata apertures (Keller et al., 1989; Thiel et al., 1992). The higher expression level of SbK+O, coding for an osmotic stress potassium transmembrane transporter, recorded in the drought tolerant IS22330 compared to the sensitive IS20351, and the stronger correlation of this gene with Pn and E in IS22330 than in IS20351, suggests that the drought tolerant IS22330 is more able to manage water losses through stomata apertures than the sensitive IS20351. The down-regulation of SbK+O at 2 p.m. (Figure 4D), occurred under WS conditions for both genotype at the same time when VPD reached its maximum level, reflects the strong dependence of SbK+O expression to the evaporative demand of the atmosphere. Sorghum plants under WS conditions reduce SbK+O expression level when VPD is maximum.
The daily expression level of a putative leucine-rich repeat receptor-like protein kinase family protein, SbERECTA, homologous to PdERECTA (Xing et al., 2011) and chosen to test its implication in improving WUE also in Sorghum bicolor, was negatively correlated with IS22330 and positively correlated with IS203351 WUEi daily trend. After 10 a.m. this gene was
up-regulated in response to severe stress more in the drought tolerant IS22330 than in the drought sensitive IS20351, allowing to speculate on its role in determining wcWUEi.
CONCLUSIONS
The multi-chamber system proved to be a valuable tool in discriminating continuously and non-destructively the whole-canopy Pn, E, and WUEi of two sorghum genotypes
in response to progressive drought stress. The drought tolerant genotype IS22330, with its low Pn and E under WS conditions, adopts a “pessimistic” strategy, limiting water consumption and achieving overall a wcWUEihigher than the
drought sensitive IS20351. This drought tolerance strategy is pursued through a fine control of stomata apertures involving regulation of K+
channels expression levels (SbK+O) and regulation of C4 cycle gene expression levels (SbNADP-ME and SbCA).
The positive correlation between SbCA expression level and Pn and E indicates that SbCA could be considered a candidate gene for drought tolerance improvement in sorghum. SbERECTA, on the other hand, could be used as a proxy for wcWUEi determination also in sorghum while SbDHN
was confirmed as a valuable candidate to assess drought tolerance in sorghum throughout the day. On the contrary, SbNADP-ME, SbCA, SbK+O, and SbERECTA changed their expression according to VPD. The real-time non-destructive determination of whole-canopy Pn and E, together with wcWUEi
estimation, were useful to accurately identify at what time the destructive sampling had to be done in order to identify significantly different gene expression levels between genotypes and significant correlation with physiological measurements. The best time to carry out a destructive sampling for gene expression analysis, in order to assess drought tolerance in sorghum, is when VPD is maximum.
AUTHOR CONTRIBUTIONS
AF and SA conceived and planned the experiment. EM and AF set up and monitored the canopy gas exchange system. AF performed the experimental work, data analysis and drafted the manuscript. SA and AM revised the manuscript. SA supervised the research. All the authors have read and approved the final manuscript.
FUNDING
This work was supported by grants from European Project “SWEETFUEL-Sweet sorghum: an alternative energy crop,” 7th Framework Programme of the European Union—grant agreement 227422, and from the project BIOSEA, funding by Italian Ministry of Agriculture.
REFERENCES
Amaducci, S., Colauzzi, M., Battini, F., Fracasso, A., and Perego, A. (2016). Effect of irrigation and nitrogen fertilization on the production of biogas from maize and sorghum in a water limited environment. Eur. J. Agron. 76, 54–65. doi: 10.1016/j.eja.2016.01.019
Bacon, M. (2009). Water Use Efficiency in Plant Biology. Hoboken, NJ: John Wiley & Sons.
Brini, F., Hanin, M., Lumbreras, V., Amara, I., Khoudi, H., Hassairi, A., et al. (2007). Overexpression of wheat dehydrin DHN-5 enhances tolerance to salt andosmotic stress in Arabidopsis thaliana. Plant Cell Rep. 26, 2017–2026. doi: 10.1007/s00299-007-0412-x
Cabrera-Bosquet, L., Albrizio, R., Nogués, S., and Araus, J. L. (2011). Dual 13C/18O response to water and nitrogen availability and its relationship with yield in field-grown durum wheat. Plant Cell Environ. 34, 418–433. doi: 10.1111/j.1365-3040.2010.02252.x
Cannon, C., and Kummerow, F. A. (1957). A comparison of plant and grain wax from two varieties of sorghum. J. Am. Oil Chem. Soc. 34, 519–520. doi: 10.1007/BF02638082
Cantore, V., Pace, B., and Albrizio, R. (2009). Kaolin-based particle film technology affects tomato physiology, yield and quality. Environ. Exp. Bot. 66, 279–288. doi: 10.1016/j.envexpbot.2009.03.008
Chandra Babu, R., Zhang, J., Blum, A., David Ho, T. H., Wu, R., and Nguyen, H. (2004). HVA1, a LEA gene from barley confers dehydration tolerance in transgenic rice (Oryza sativa L.) via cell membrane protection. Plant Sci. 66, 855–862. doi: 10.1016/j.plantsci.2003.11.023
Condon, A. G., Richards, R. A., Rebetzke, G. J., and Farquhar, G. D. (2002). Improving intrinsic water-use efficiency and crop yield. Crop Sci. 42, 122–131. doi: 10.2135/cropsci2002.0122
Doubnerová, V., and Ryšlavá, H. (2011). What can enzymes of C4photosynthesis
do for C3plants under stress? Plant Sci. 180, 575–583.
Dragoni, D., Lakso, A. N., and Piccioni, R. M. (2005). Transpiration of apple trees in a humid climate using heat pulse sap flow gauges calibrated with whole-canopy gas exchange chambers. Agric. For. Meteorol. 130, 85–94. doi: 10.1016/j.agrformet.2005.02.003
Dugas, D. V., Monaco, M. K., Olsen, A., Klein, R. R., Kumari, S., Ware, D., et al. (2011). Functional annotation of the transcriptome of Sorghum bicolor in response to osmotic stress and abscisic acid. BMC Genomics 12:514. doi: 10.1186/1471-2164-12-514
Escalona, J. M., Tomàs, M., Martorell, S., Medrano, H., Ribas-Carbo, M., and Flexas, J. (2012). Carbon balance in grapevines under different soil water supply: importance of whole plant respiration. Aust. J. Grape Wine Res. 18, 308–318. doi: 10.1111/j.1755-0238.2012.00193.x
Fracasso, A., Trindade, L. M., and Amaducci, S. (2016a). Drought tolerance strategies highlighted by two Sorghum bicolor races in a dry-down experiment. J. Plant Physiol. 190, 1–14. doi: 10.1016/j.jplph.2015.10.009
Fracasso, A., Trindade, L. M., and Amaducci, S. (2016b). Drought stress tolerance strategies revealed by RNA-Seq in two sorghum genotypes with contrasting WUE. BMC Plant Biol. 16:115. doi: 10.1186/s12870-016-0800-x
Gilbert, M. E., Zwieniecki, M. A., and Holbrook, N. M. (2011). Independent variation in photosynthetic capacity and stomatal conductance leads to differences in intrinsic water use efficiency in 11 soybean genotypes before and during mild drought. J. Exp. Bot. 62, 2875– 2887. doi: 10.1093/jxb/erq461 Gillon, J., and Yakir, D. (2001). Influence of carbonic anhydrase activity in
terrestrial vegetation on the 18O content of atmospheric CO2. Science 291,
2584–2587. doi: 10.1126/science.1056374
Gosal, S. S., Wani, S. H., and Kang, M. S. (2009). Biotechnology and drought tolerance. J. Crop Improv. 23, 19–54. doi: 10.1080/15427520802418251 Guo, P., Baum, M., Grando, S., Ceccarelli, S., Bai, G., Li, R., et al. (2009).
Differentially expressed genes between drought-tolerant and drought-sensitive barley genotypes in response to drought stress during the reproductive stage. J. Exp. Bot. 60, 3531–3544. doi: 10.1093/jxb/erp194
Hall, A. J., and Richards, R. A. (2013). Prognosis for genetic improvement of yield potential and water-limited yield of major grain crops. Field Crop Res. 143, 18–33. doi: 10.1016/j.fcr.2012.05.014
Hu, H., Boisson-Dernier, A., Israelsson-Nordström, M., Bohmer, M., Xue, S., Ries, A., et al. (2010). Carbonic anhydrases are upstream regulators in guard cells of CO2controlled stomatal movements. Nat. Cell Biol. 12, 1–18.
doi: 10.1038/ncb2009
ICPP (2014). Mitigation of Climate Change. IPCC Fifth Assessment Working Group II Report (Yokohama: WHO/UNEP), 32
Intrigliolo, D. S., Lakso, A. N., and Piccioni, R. M. (2009). Grapevine cv. ‘Riesling’ water use in the northeastern United States. Irrig. Sci. 27, 253–262. doi: 10.1007/s00271-008-0140-1
Jones, H. G. (1980). “Interaction and integration of adaptive responses to water stress: the implications of an unpredictable environment,” in Adaptation of Plants to Water and High Temperature Stress, eds N. C. Turner and P. J. Kramer (New York, NY: Wiley), 353–365.
Karaba, A., Dixit, S., Greco, R., Aharoni, A., Trijatmiko, K. R., Marsch-Martinez, N., et al. (2007). Improvement of water use efficiency in rice by expression of
HARDY, an Arabidopsis drought and salt tolerance gene. Proc. Natl. Acad. Sci. U.S.A. 104, 15270–11575. doi: 10.1073/pnas.0707294104
Keller, B., Hedrich, R., and Raschke, K. (1989). Voltage-dependent anion channels in the plasma membrane of guard cells. Nature 341, 450–453. doi: 10.1038/341450a0
Laporte, M. M., Shen, B., and Tarczynski, M. C. (2002). Engineering for drought avoidance: expression of maize NADP-malic enzyme in tobacco results in altered stomatal function. J. Exp. Bot. 53, 699–705. doi: 10.1093/jexbot/53.369.699
Liu, S., Li, H., Lv, X., Ahammed, G. J., Xia, X., Zhou, J., et al. (2016). Grafting cucumber onto luffa improves drought tolerance by increasing ABA biosynthesis and sensitivity. Sci. Rep. 6:20212. doi: 10.1038/srep20212 Livak, K. J., and Schmittgen, T. D. (2001). Analysis of relative gene expression
data using real-time quantitative PCR and the 2(-Delta Delta C(T)) method. Methods 25, 402–408. doi: 10.1006/meth.2001.1262
Long, S. P., and Hällgren, J. E. (1985). “Measurement of CO2 assimilation by
plants in the field and the laboratory,” in Techniques in Bio-Productivity and Photosynthesis, eds J. Coombs, D. D. Hall, S. P. Long, and J. M. O. Scurlock (Oxford, UK: Pergamon Press), 62–93.
Luquet, D., Clément-Vidal, A., Fabre, D., This, D., Sonderegger, N., and Dingkuhn, M. (2008). Orchestration of transpiration, growth and carbohydrate dynamics in rice during a dry-down cycle. Funct. Plant Biol. 35, 689–704. doi: 10.1071/FP08027
Masle, J., Gilmore, S. R., and Farquhar, G. D. (2005). The ERECTA gene regulates plant transpiration efficiency in Arabidopsis. Nature 436, 866–870. doi: 10.1038/nature03835
Monaghan, J. M., Daccache, A., Vickers, L. H., Hess, T. M., Weatherhead, E. K., Grove, I. G., et al. (2013). More ‘crop per drop’: constraints and opportunities for precision irrigation in European agriculture. J. Sci. Food. Agric. 93, 977–980. doi: 10.1002/jsfa.6051
Osborne, W. C. (1977). Fans, 2nd Edn. Oxford: Pergamon Press.
Pasini, L., Bergonti, M., Fracasso, A., Marocco, A., and Amaducci, S. (2014). Microarray analysis of differentially expressed mRNAs and miRNAs in young leaves of sorghum under dry-down conditions. J. Plant Physiol. 171, 537–548. doi: 10.1016/j.jplph.2013.12.014
Paterson, A. H., Freeling, M., and Sasaki, T. (2005). Grains of knowledge: genomics of model cereals. Genome Res. 15, 1643–1650. doi: 10.1101/gr.3725905 Perez-Martin, A., Michelazzo, C., Torres-Ruiz, J. M., Flexas, J., Fernández, J.
E., Sebastiani, L., et al. (2014). Regulation of photosynthesis and stomatal and mesophyll conductance under water stress and recovery in olive trees: correlation with gene expression of carbonic anhydrase and aquaporins. J. Exp. Bot. 65, 3143–3156. doi: 10.1093/jxb/eru160
Poni, S., Merli, M. C., Magnanini, E., Galbignani, M., Bernizzoni, F., Vercesi, A., et al. (2014). An improved multichamber gas exchange system for determining whole-canopy water-use efficiency in grapevine. Am. J. Enol. Vitic. 65, 268–276. doi: 10.5344/ajev.2014.13117
Rodrigues, W. P., Machado Filho, J. A., Rangel da Silva, J., et al. (2016). Whole-canopy gas exchanges in Coffea sp. is affected by supra-optimal temperature and light distribution within the canopy: the insights from an improved multi-chamber system. Sci. Hort. 211, 194–202. doi: 10.1016/j.scienta.2016. 08.022
Schroeder, J. I., Hedrich, R., and Fernandez, J. M. (1984). Potassium-selective single channels in guard cell protoplasts of Vicia faba. Nature 312, 361–362. doi: 10.1038/312361a0
Sivamani, E., Bahieldin, A., Wraith, J. M., Al-Niemi, T., Dyer, W. E., Ho, T. H. D., et al. (2000). Improved biomass productivity and water use efficiency under water deficit conditions in transgenic wheat constitutively expressing the barley HVA1 gene. Plant Sci. 155, 1–9. doi: 10.1016/S0168-9452(99)00247-2 Stone, L. R., Goodrum, D. E., Jaafar, M. N., and Khan, A. H. (2001). Rooting
front and water depletion depths in grain sorghum and sunflower. Agron. J. 93, 1105–1110. doi: 10.2134/agronj2001.9351105x
Studer, A. J., Gandin, A., Kolbe, A. R., Wang, L., Cousins, A. B., and Brutnell, T. P. (2014). A limited role for carbonic anhydrase in C4photosynthesis as revealed by aCa1Ca2 double mutant in maize. Plant Physiol. 165, 608–617. doi: 10.1104/pp.114.237602
Thiel, G., MacRobbie, E. A. C., and Blatt, M. R. (1992). Membrane transport in stomatal guard cells: the importance of voltage control. J. Membr. Biol. 126, 1–18. doi: 10.1007/BF00233456
Timlin, D., Rahman, S. M. L., Baker, J., Reddy, V. R., Fleisher, D., and Quebedeaux, B. (2006). Whole plant photosynthesis, development, and carbon partitioning in potato as a function of temperature. Agron. J. 98, 1195–1203. doi: 10.2134/agronj2005.0260
Tomás, M., Medrano, H., Escalona, J. M., Martorell, S., Pou, A., Ribas-Carbó, M., et al. (2014). Variability of water use efficiency in grapevines. Environ. Exp. Bot. 103, 148–157. doi: 10.1016/j.envexpbot.2013.09.003
Tomás, M., Medrano, H., Pou, A., Escalona, J. M., Martorell, S., Ribas-Carbó, M., et al., (2012). Water-use efficiency in grapevine cultivars grown under controlled conditions: effects of water stress at the leaf and whole-plant level. Aust. J. Grape Wine Res. 18, 164–172. doi: 10.1111/j.1755-0238.2012. 00184.x
Xiao, B., Huang, Y., Tang, N., and Xiong, L. (2007). Over-expression of a LEA gene in riceimproves drought resistance under the field conditions. Theor. Appl. Genet. 115, 35–46. doi: 10.1007/s00122-007-0538-9
Xing, H. T., Guo, P., Xia, X. L., and Yin, W. L. (2011). PdERECTA, a leucine-richrepeat receptor-like kinase of poplar, confers enhanced water
use efficiency in Arabidopsis. Planta 234, 229–241. doi: 10.1007/s00425-011-1389-9
Zegada-Lizarazu, W., Zatta, A., and Monti, A. (2012). Water uptake efficiency and above-and belowground biomass development of sweet sorghum and maize under different water regimes. Plant Soil 351, 56–60. doi: 10.1007/s11104-011-0928-2
Conflict of Interest Statement: The authors declare that the research was conducted in the absence of any commercial or financial relationships that could be construed as a potential conflict of interest.
Copyright © 2017 Fracasso, Magnanini, Marocco and Amaducci. This is an open-access article distributed under the terms of the Creative Commons Attribution License (CC BY). The use, distribution or reproduction in other forums is permitted, provided the original author(s) or licensor are credited and that the original publication in this journal is cited, in accordance with accepted academic practice. No use, distribution or reproduction is permitted which does not comply with these terms.