Alma Mater Studiorum – Università di Bologna
DOTTORATO DI RICERCA IN
MECCANICA E SCIENZE AVANZATE DELL’INGEGNERIA
Ciclo XXVIII
Settore Concorsuale di afferenza: 09/A1 Ingegneria Aeronautica, Aerospaziale e Navale
Settore Scientifico disciplinare: ING-IND/05 Impianti e Sistemi Aerospaziali
DESIGN AND IMPLEMENTATION OF SOFTWARE SOLUTIONS FOR
SATELLITE GROUND SEGMENT,
WITH APPLICATION TO THE ESEO MISSION
Presentata da: Marco Bosco
Coordinatore Dottorato
Relatore
Prof. Vincenzo Parenti Castelli
Prof. Paolo Tortora
Hope for the best, but prepare for the worst.
I
Sommario
Titolo: Progettazione e Sviluppo di Soluzioni Software per il Segmento di Terra di Satelliti, con Applicazione alla Missione ESEO.
Il successo di una missione spaziale dipende non solo dalla buona progettazione e realizzazione del segmento spaziale (piattaforma e payloads) e dalla riuscita del lancio. Infatti, il segmento di terra è fondamentale per poter operare il satellite e quindi portare a termine con successo la missione. Questo lavoro di tesi si concentra proprio sul segmento di terra ed in particolare sulla progettazione e lo sviluppo di soluzioni software necessarie per le varie funzionalità svolte dal segmento di terra.
La prima parte di questo lavoro, che è stata svolta nel primo, secondo e nella prima parte del terzo anno di dottorato, si concentra sul progetto ESEO (European Student Earth Orbiter), una missione microsatellitare sponsorizzata dall’Education Office dell’Agenzia Spaziale Europea (ESA). ESEO sarà lanciato nel 2017 in orbita bassa con lo scopo di scattare immagini della Terra, misurare livelli di radiazione e testare tecnologie spaziali per future missioni satellitari. Lo scopo educativo di questo progetto è quello di fornire agli studenti universitari la possibilità di lavorare in un vera missione satellitare, formandoli per la loro carriera nell’industria spaziale. Il laboratorio di Microsatelliti e Sistemi Spaziali dell’Università di Bologna è coinvolto in questo progetto per lo sviluppo del centro di controllo missione, della stazione di terra primaria per la ricezione dei dati di telemetria e l’invio dei comandi e del ricevitore GPS di bordo. L’oggetto di questo dottorato è stata la progettazione e lo sviluppo dei primi due elementi partendo dall’esperienza acquisita dal laboratorio durante le operazioni del microsatellite ALMASat-1 lanciato nel Febbraio 2012 a bordo del Vega maiden flight. Nel corso di questo lavoro, la stazione di terra è stata ampiamente rinnovata con l’introduzione di una software-defined radio (SDR) e lo sviluppo di nuovo software. Per il centro di controllo missione, si è sviluppato in LabVIEW un sistema di monitoraggio e controllo per ESEO connesso ad un database appositamente progettato in MySQL per la gestione dei dati di telemetria e dei comandi durante le operazioni del satellite. Inoltre è stata instaurata una rete di stazioni di terra che comprende le stazioni di Vigo e Monaco per poter operare al meglio la missione ESEO garantendo una ridondanza a terra per comunicare con il satellite. I requisiti e il design dettagliato del segmento di terra, la descrizione dell’interfaccia di comunicazione tra satellite e terra così
II
come la descrizione del database e delle procedure operazionali sono riportate nella documentazione tecnica che è stata preparata per la preliminary design review (PDR) e critical design review (CDR) del progetto ESEO superate rispettivamente nel Novembre 2013 e Luglio 2015.
Durante il terzo anno, da Maggio a Ottobre 2015, è stata svolto un tirocinio presso EUMETSAT (European Organisation for the Exploitation of Meteorological Satellites) durante il quale si sono sviluppate delle soluzioni software per le stazioni di terra utilizzate per operare satelliti meteorologici in orbita bassa, come Metop e NOAA, e in orbita geostazionaria, come la famiglia dei satelliti Meteosat. In particolare, tre diverse applicazioni sono state sviluppate, testate e rese operative. La prima attività ha riguardato l’integrazione di un sistema di generazione automatica di reports periodici contenenti grafici e tabelle che illustrano alcuni parametri selezionati delle stazioni di terra collocate a Svalbard ed utilizzate per inviare comandi e ricevere telemetria e dati scientifici dai satelliti Metop-A, Metop-B e NOAA-19. Questa applicazione si è rivelata particolarmente utile per gli ingegneri delle operazioni per individuare problemi relativi a queste stazioni. La seconda attività è consistita nello sviluppo di un’applicazione per il calcolo e la visualizzazione dei passaggi dei satelliti in orbita bassa al di sopra di una rete di stazioni di terra. Questa applicazione basata sulla propagazione delle TLE consente di aggiungere una maschera d’orizzonte per ogni antenna, calcolare e risolvere conflitti tra passaggi di più satelliti sulla stessa stazione e calcolare le orbite cieche dei satelliti NOAA per garantire il supporto dalle stazioni EUMETSAT di Svalbard quando possibile. Infine, l’ultima attività ha riguardato lo sviluppo di un simulatore del sistema di monitoraggio e controllo delle stazioni di terra che saranno utilizzate per il programma Meteosat Third Generation (MTG). Il simulatore riproduce tutte le funzionalità svolte dal sistema: autenticazione, richiesta dei parametri di telemetria, registrazione a eventi, richiesta della schedula, invio di comandi immediati e time-tagged.
III
Table of Contents
Sommario ... I List of Figures ... V List of Tables ... VIII List of Acronyms ...IX
1. Introduction ... 1
1.1 Background and Motivation ... 2
1.2 Thesis Outline ... 3
2. Ground Systems and Operations ... 5
2.1 Ground segment engineering process ... 7
2.2 Differences with small spacecraft ground systems ... 9
3. The European Student Earth Orbiter Project ... 11
3.1 Telecommunication System ... 14
3.1.1 Space-to-Ground communication protocol ... 15
3.1.2 Link budget ... 18
3.2 Ground Segment ... 22
3.2.1 Forli Ground Station ... 26
3.2.1.1 Satellite Tracking Software ... 32
3.2.1.2 Software Defined Radio implementation ... 34
3.2.1.3 Compatibility Tests ... 39
3.2.2 Spacecraft Monitoring and Control ... 41
3.2.2.1 Database definition ... 45
3.2.2.2 Automatic procedures ... 47
3.2.2.3 Telemetry Visualisation and Analysis Tool ... 48
3.2.2.4 Users’ Requests ... 49
3.2.3 Spacecraft Simulator ... 50
3.2.4 Code review ... 51
4. EUMETSAT Ground Station Software Solutions ... 53
4.1 Ground Station Analysis and Reporting Tool ... 54
4.1.1 Motivations and Background ... 54
4.1.2 Reports generation ... 56
4.1.3 Database definition ... 57
4.1.4 Reports content ... 57
4.1.5 Repeat cycle analysis ... 61
4.1.6 Code verification and results validation ... 63
IV
4.2.1 Applications ... 64
4.2.2 Graphical User Interface ... 67
4.2.2.1 Error handling ... 70
4.2.3 Results ... 71
4.2.4 Validation ... 75
4.3 Ground Station Centralised M&C Simulator ... 78
4.3.1 Data Flows ... 78 4.3.2 Device Simulator ... 80 4.3.3 Simulator ... 82 4.3.4 Testing... 86 5. Conclusions ... 90 Appendix A ... 92 Appendix B ... 94 Appendix C ... 95 Appendix D ... 97 Appendix E ... 99 Bibliography ... 100 Acknowledgments... 103
V
List of Figures
Figure 1. Schematic of typical space system, with the emphasis on software elements [1] 1
Figure 2. Ground segment systems [4] ... 5
Figure 3. Generic ground segment example [3] ... 7
Figure 4. ESEO University Network and roles ... 11
Figure 5. ESEO maximum revisit time (in days) for the observed points ... 13
Figure 6. ESEO platform ... 13
Figure 7. Bit operations and frame detection (downlink) ... 17
Figure 8. RSSI (dBm) average interference world plot between 6/8/2014 and 11/8/2014 18 Figure 9. Theoretical Noncoherent BFSK BER curve ... 20
Figure 10. Detail of the visibility circles of Forlì, Munich and Vigo stations (5º, 10º, 15º and 20º minimum elevations) ... 23
Figure 11. ESEO Ground Segment ... 24
Figure 12. ESEO Ground Segment detailed block diagram ... 26
Figure 13. Forlì Ground Station configuration for ALMASat-1 mission ... 27
Figure 14. ALMASat-1 Ground Station ... 27
Figure 15. Septum dish feed mounted on a 3m parabolic dish by RF Hamdesign ... 27
Figure 16. VSWR plot for the RX port of the septum dish feed by RF Hamdesign ... 27
Figure 17. S-band parabolic dish antenna and VHF/UHF Yagi antenna ... 28
Figure 18. Mission control room ... 28
Figure 19. USRP N210 by Ettus Research ... 29
Figure 20. SBX daughterboard by Ettus Research ... 29
Figure 21. USRP block diagram ... 30
Figure 22. VHF/UHF ground station ... 31
Figure 23. S-band ground station ... 32
Figure 24. Computation of azimuth and elevation from ground station to satellite ... 33
Figure 25. Gpredict satellite tracking software ... 33
Figure 26. LabVIEW block diagram of the signal acquisition loop of the SDR software 34 Figure 27. SDR software GUI ... 35
Figure 28. GFSK signal time plot ... 36
Figure 29. GFSK signal waterfall plot ... 36
Figure 30. Non-coherent BFSK signal ... 37
Figure 31. GFSK signal spectrum ... 40
Figure 32. SDR Test setup ... 40
Figure 33. SDR software for testing purposes ... 41
Figure 34. Spacecraft Monitoring and Control GUI ... 42
Figure 35. AOCS Telemetry display ... 44
Figure 36. AOCS Telecommands display ... 44
Figure 37. Uplink chain flowchart ... 45
Figure 38. Downlink chain flowchart ... 45
Figure 39. Telemetry Visualisation and Analysis Tool ... 48
VI
Figure 41. TM Graphical display ... 48
Figure 42. Lifecycle for each individual payload request at MCC ... 50
Figure 43. S/C simulator block diagram ... 51
Figure 44. Software Engineering Process ... 52
Figure 45. The Metop satellites are operated via two CDAs collocated in Svalbard, Norway and linked to the operational ground segment in Darmstadt via fibre-optic and satellite communications links ... 53
Figure 46. TMPropagator client, CDA1 mimic display ... 55
Figure 47. GSAR reports web calendar interface ... 56
Figure 48. Reports generation flowchart ... 56
Figure 49. CDA tracked passes counter ... 57
Figure 50. CDA2 Antenna Azimuth, 21/10/2015 ... 58
Figure 51. CDA2 Antenna Elevation, 21/10/2015... 58
Figure 52. CDA2 Antenna Tilt, 21/10/2015 ... 58
Figure 53. CDA2 Antenna Tilt movements, 21/10/2015 ... 58
Figure 54. CDA2 devices status, 21/10/2015 ... 59
Figure 55. CDA2 ACU status, 21/10/2015 ... 59
Figure 56. CDA2 tracked passes with FD information (S/C, orbit, AOS time) and TM data (BTSE, corrected, uncorrected and received frames), 21/10/2015 ... 60
Figure 57. CDA2 TM data during M02 pass, orbit 46725... 60
Figure 58. CDA high level block diagram ... 61
Figure 59. Metop-A S-band EbN0 repeat cycle comparison ... 63
Figure 60. TMPropagator GRD, CDA tracking receiver levels ... 64
Figure 61. GSAR, CDA tracking receiver levels ... 64
Figure 62. Antarctic Data Acquisition service. © EUMETSAT ... 65
Figure 63. Fairbanks horizon mask ... 66
Figure 64. Wallops horizon mask ... 66
Figure 65. Svalbard CDAs nominal pass planning ... 67
Figure 66. SPACE graphical user interface ... 68
Figure 67. Satellite pass events ... 70
Figure 68. Visibility passes list ... 71
Figure 69. Visibility passes summary ... 71
Figure 70. Satellites passes duration over CDA1 during one day ... 72
Figure 71. Satellites passes maximum elevation over CDA1 during one day ... 72
Figure 72. Satellites passes conflicts table ... 73
Figure 73. One-day conflict-free schedule for Metop-A, Metop-B, NOAA19 over Fairbanks, McMurdo and Svalbard ... 73
Figure 74. Conflict-free passes percentage over Fairbanks for Metop-A, Metop-B and NOAA19 ... 74
Figure 75. Pass details: Metop-A over CDA1, orbit 45500, sampling time 30 seconds ... 74
Figure 76. Predicted azimuth and elevation on a time axis ... 75
Figure 77. Predicted azimuth and elevation on a polar plot ... 75
Figure 78. Doppler corrected downlink frequency for Metop-A pass over CDA1, orbit 45500... 75
VII
Figure 79. HL and LL M&C connection ... 79
Figure 80. Kinds of data streams exchanged over the interface ... 80
Figure 81. Definition of a device mechanism ... 82
Figure 82. Device Simulator Editor ... 84
Figure 83. Device Simulator Runtime Configuration window ... 87
Figure 84. Device Simulator Status window ... 88
Figure 85. Telemetry points messages table ... 88
Figure 86. Events messages history ... 89
Figure 87. Time-tagged commands inserted in the schedule ... 89
VIII
List of Tables
Table 1. Ground segment phases ... 7
Table 2. Technical documentation required for ground segment and operations ... 8
Table 3. Fundamental differences between a small spacecraft ground system and classical ground systems for large spacecraft [5] ... 10
Table 4. ESEO orbital parameters ... 12
Table 5. U frame structure ... 15
Table 6. S frame structure ... 15
Table 7. I frame structure ... 16
Table 8. UHF downlink budget at 9.6 kbps ... 20
Table 9. UHF uplink budget at 9.6 kbps ... 21
Table 10. Statistics of contact durations with the stations (5º minimum elevation) ... 23
Table 11. ICOM IC-910H frequency coverage in Italy ... 28
Table 12. VHF/UHF ground station components ... 31
Table 13. S-band ground station components ... 32
Table 14. Different values of the SDR fetch size, time and rate ... 37
Table 15. SDR settings for bit rate equal to 9.6 kbps ... 38
Table 16. SDR settings for bit rate equal to 4.8 kbps. ... 38
Table 17. Packet Error Rate for different Signal-to-Noise Ratio values in downlink testing ... 41
Table 18. ESEO equipment/payloads ... 46
Table 19. CDA’s devices status ... 59
Table 20. Metop and NOAA satellites frequencies ... 61
Table 21. Metop repeat cycle values ... 62
Table 22. IJPS satellites ... 65
Table 23. Ground Stations location ... 65
Table 24. TLE set format definition ... 69
Table 25. Errors between results given by pyephem and EUMETSAT FD team... 76
Table 26. Errors between results given by pyorbital and EUMETSAT FD team. ... 76
Table 27. Exchanged messages between HL and LL M&C ... 83
Table 28. Simulator periodic macros ... 85
IX
List of Acronyms
ACU Antenna Control Unit AIT Assembly Integration Test
AITV Assembly Integration Test Verification AMGS Alma Mater Ground Station
AND Alpha Numeric Display
AOS Acquisition of Signal
BER Bit Error Rate
BTSE Back To Search Event
CCSDS Consultative Committee for Space Data Standardisation CDA Command and Data Acquisition
CDR Critical Design Review
CRC Cyclic Redundancy Check
CSV Comma Separated Values
DB Database
DOM Document Object Model
DS Device Simulator
EbN0 Energy per bit to Noise power spectral density ratio
ECSS European Cooperation for Space Standardisation EGSE Electrical Ground System Equipment
EPS Eumetsat Polar System
ESA European Space Agency
ESEO European Student Earth Orbiter
EUMETSAT European Organisation for the Exploitation of Meteorological Satellites
FD Flight Dynamics
FDS Flight Dynamics System FFT Fast Fourier Transform FOS Flight Operations System
FRT First Receive Time
FSK Frequency Shift Keying GEO Geostationary Earth Orbit
GRD Graphical Display
GS Ground Segment
GSN Ground Stations Network
HDRFEP High Rate Demodulator and Front End Processor
HK HouseKeeping
HPC High Priority Command
HTML Hyper Text Markup Language ICD Interface Control Document IJPS Initial Joint Polar System
X LEOP Launch and Early Orbit Phase
LOS Loss of Signal
LRT Last Receive Time
M01 Metop-B
M02 Metop-A
MCC Mission Control Centre MCS Mission Control System M&C Monitoring & Control MTG Meteosat Third Generation
N18 NOAA 18
N19 NOAA 19
NOAA National Oceanic and Atmospheric Administration NORAD North American Aerospace Defence Command OBDH On Board Data Handling
ORR Operational Readiness Review PDR Preliminary Design Review
PMCS Polar Monitoring and Control System
RF Radio Frequency
RR Requirements Review
S/C Spacecraft
SNR Signal-to-Noise Ratio
SS Space Segment
STFT Short-Time Fourier Transform
TC Telecommand
TLE Two Line Elements
TM Telemetry
TMTC Telemetry and Telecommand TT&C Telemetry, Tracking and Command UDP User Datagram Protocol
USRP Universal Software Radio Peripheral UTC Coordinated Universal Time
VI Virtual Instrument
VSWR Voltage Standing Wave Ratio
XML eXtensive Markup Language
XSD XML Schema Definition
XSL eXtensive Stylesheet Language
1
1. Introduction
A space system is composed of three segments: space, ground and launch. The space segment comprises of spacecraft and payloads whilst the ground segment comprises of all of the ground facilities needed to operate the mission. Software is pervasive throughout the whole ‘product tree’ of any space mission: Figure 1 shows a typical space system schematically, with emphasis on the software elements. The space segment has on-board computers, data-handling systems, attitude and orbit control systems, all of which contain software. The ground segment has mission control systems, simulators, flight-dynamics systems, mission-analysis tools, communications networks and ground-station data systems such as telemetry and telecommand processors, as well as ‘downstream processing’ systems for payload data. These all contain software, often of considerable complexity. Developing and maintaining this software in a disciplined way is a key to the success of any space mission [1].
Figure 1. Schematic of typical space system, with the emphasis on software elements [1]
This thesis presents the software solutions designed and implemented for the ground segment of a microsatellite mission named ESEO and for the ground stations of EUMETSAT, the European Organisation for the Exploitation of Meteorological Satellites. The implemented solutions cover almost all the functionalities required to operate successfully a satellite mission:
Signal acquisition/transmission, signal demodulation/modulation, frame detection in a software-defined radio (SDR) environment.
2
Satellite monitoring and control: telecommand packing and encoding, telemetry unpacking and calibration, command stack, automatic procedures, telemetry limit processing and display.
Telemetry and telecommand archiving.
Satellite tracking based on two line elements TLE. Satellite simulator and TMTC front-end.
Ground station performance analysis and reporting
Computation of satellite passes over a ground station network and conflict-free schedule generation.
Ground station monitoring and control.
1.1 Background and Motivation
In December 2013, ALMASpace S.r.l., a former spin-off of the Microsatellite and Space Systems Lab (now merged into the SITAEL company), was awarded a contract relative to the invitation to tender (ITT) from the European Space Agency (ESA) for the phases C0/C1/D/E1 of the European Student Earth Orbiter (ESEO) project. Whilst ALMASpace is the prime contractor, the University of Bologna is a subcontractor, responsible for the on-board GPS receiver, the primary TMTC ground station, the mission control centre and the organisation of lectures and internships for the students of the ESEO University network. Regarding the ground segment and operations, the contract signed between ESTEC and ALMASpace S.r.l. list the following main requirements [2]:
The ESEO ground segment architecture shall consist of a Mission Control Centre in order to perform telemetry, telecommand and control functions, and one or more Ground Stations located in Europe in order to perform TMTC radio communications with the ESEO satellite.
The ESEO ground segment shall allow payload operators access to their payload data via internet.
The ESEO ground segment shall allow payload operators to submit request for their payload operations and associated telecommands via internet to the Mission Control Centre for processing.
The ESEO ground station(s) shall communicate with the ESEO satellite over VHF (30-300 MHz), UHF (300-1000 MHz), or S-band (2-4 GHz) in either radio amateur
3
or regulated bands. Frequency shall be allocated by IARU (in case of radio amateur bands) or ITU (in case of regulated bands).
The ESEO ground segment and satellite shall be operated by students to the maximum extent possible, and mission operations shall be supported by the System Prime Contractor staff.
This was the motivation for the major part of the work done during the PhD course and described in this thesis. Moreover, we wanted to improve the theoretical and practical knowledge at our lab about the ground segment and operations for satellite missions. A first experience of the design of a ground station and performance of operations was gained during the ALMASat-1 mission launched in 2012 on-board the Vega Maiden Flight.
1.2 Thesis Outline
The thesis is organised as follows:
Chapter 2. Ground Systems and Operations. This section explains which are the components of the ground segment and what is needed to successfully operate a satellite mission. We also list the main differences between the ground segment for large and small satellites.
Chapter 3. European Student Earth Orbiter Project. The design and the development of the ground segment for this microsatellite mission is widely discussed in this section. After a first description of the ESEO project with particular attention to the telecommunication system, the main topics of this chapter are the Forlì ground station and the ESEO Monitoring and Control system.
Chapter 4. EUMETSAT Ground Station Software Solutions. During an internship at EUMETSAT, some innovative software solutions have been implemented to improve ground stations operations. This section describes three software applications: the ground station analysis and reporting tool, the satellite passes and conflicts engine and the ground station centralised M&C simulator.
4
Chapter 5. Conclusion. In this final chapter, we draw the conclusion from the work done during the PhD course and we provide recommendations for future work.
5
2. Ground Systems and Operations
The success of a space mission depends not only on a properly designed and built space segment (SS) and the successful launch via a launch segment. It also depends on the ground segment (GS) and successful mission operations, carried out by a team of experts using the infrastructure and processes of the mission’s GS. Its organization and design as well as the assembly, integration, test, and verification (AITV) are therefore equally important as the respective activities of the space and launch segment. A GS thereby comprises a ground system, i.e., infrastructure, hardware, software, and processes, and a team that conducts the necessary operations on the space segment [3].
The Mission success is defined as the achievement of the target mission objectives as expressed in terms of the quantity, quality and availability of delivered mission products and services (e.g. communication services, science data and space samples) within a given cost envelope.
The ground systems, as shown in Figure 2, usually consists of the following main elements: Mission control system (MCS)
Electrical ground support equipment (EGSE) Ground station system (GSTS)
Ground communication subnet (GCS)
Figure 2. Ground segment systems [4]
The MCS shall comprise all the elements required to control the mission and to exploit its products. It is composed of the following elements:
6
Operations control system (OCS), mainly supporting planning, monitoring and control, and performance evaluation of the platform elements of the space segment (SS). It also includes the flight dynamics support element, which may be considered as a system in its own right, named flight dynamics system (FDS)
Payload control system (PCS), providing the same functions as the OCS but dedicated to the control of the payload elements of the SS.
Mission exploitation system (MES), supporting the users of the mission products in establishing high-level production plan and in providing them with mission products and with all data required for their planning and utilization.
Depending on the type of the mission, often OCS and PCS are grouped in the same system. The EGSE system shall be part of the overall ground support equipment (GSE), supporting the verification of the SS during assembly, integration and test (AIT).
The GSTS shall constitute the direct interface with the SS while in-orbit and with the MCS. It provides support functions for controlling the SS elements and exploiting the mission products. It consists of the following instances:
GSTS-SSC: for the ground station system in support of SS control (i.e. providing telemetry, telecommand and tracking services) for both the platform and the payload.
GSTS-ME: for the ground station system in support of mission exploitation; e.g. for transmission and reception of payload service data such as telecommunications signal, Earth images, science data.
The GCS shall connect all operational ground facilities. The GCS constitutes the ground part of the end-to-end data path.
A generic example of a GS, its subsystems, and the data flows between them is shown in Figure 3. It comprises a GSN of three ground stations and a MCC. The main systems of the MCC are the Ground Data System (GDS), the Flight Dynamics System (FDS), and the Flight Operations System (FOS).
7
Figure 3. Generic ground segment example [3]
2.1 Ground segment engineering process
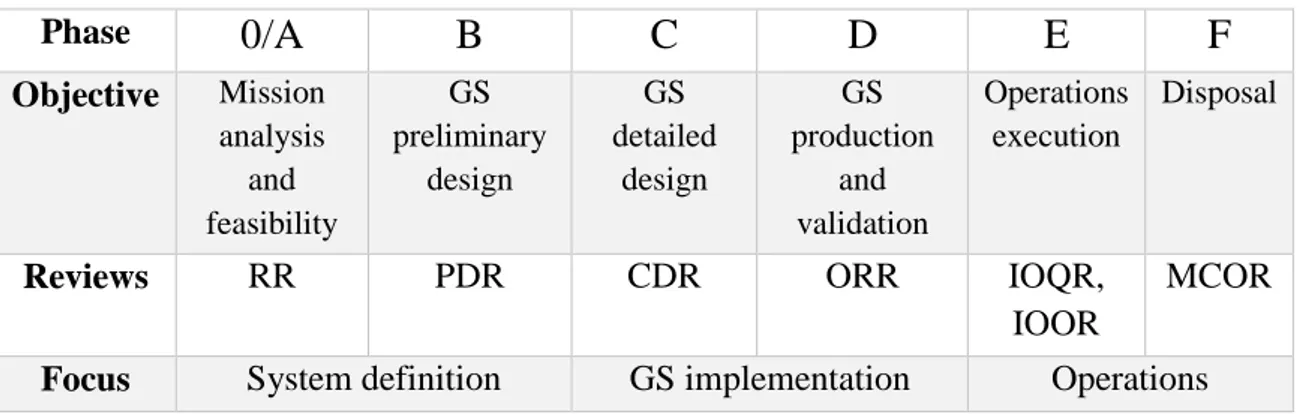
The ground engineering processes are partitioned in phases and each phase ends with a formal review, as shown in Table 1.
Table 1. Ground segment phases
Phase
0/A
B
C
D
E
F
Objective Mission analysis and feasibility GS preliminary design GS detailed design GS production and validation Operations execution DisposalReviews RR PDR CDR ORR IOQR,
IOOR
MCOR
Focus System definition GS implementation Operations
During the project, it is requested to prepare some technical documentation describing the architecture of the ground segment, requirements, the communication interface with the S/C and the operations (Table 2).
8
Table 2. Technical documentation required for ground segment and operations
Title Purpose Content
Ground Segment & Operations
Requirements Document
To specify the requirements for the ground segment and mission operations in terms of functionality, performance, detailed interface requirements and verification requirements
Ground segment & operations requirements in terms of:
Functional requirements
performance requirements
operations and logistic support
internal and external interfaces
re-use of generic infrastructure elements (e.g. software systems, ground station equipment)
maintainability of hardware and software
location of main facilities failure case operations and recovery
system and network management
configuration management Ground Segment
Design Definition File
To describe the characteristics of the detailed design of the ground segment throughout the project
The document shall contain a description of the detailed design including:
Product and Function Trees
Hardware and software description and performance
Schematics
Ground segment architecture diagrams
Software architecture diagrams
Electrical and data interfaces between the ground segment elements
On-board software verification facility Space-to-ground Interface Control Document (SGICD) To define the interfaces between the satellite and the ground segment, including all ground stations
The main interfaces to be addressed are at the level of command and control, Mission data and telecommunications aspects for which format, content and RF transmission need to be described. Satellite to Ground Segment I/F definition, including:
system overview
satellite and orbit, range definition
data formats and rates, coding scheme and modulation
encryption, authentication
reference profile assumptions
9
o frequencies
o link budgets, indicating worst case link margins expressed in dB for meeting the bit error rate requirements expressed in the SRD
data formats
TM/TC formats
ground station front-end interfaces
ranging interfaces
database interface
satellite to Ground Segment verification (including RF suitcase) Satellite Operations
Handbook (SOH)
To define in full detail, the on-orbit operation and control procedures of the satellite, for its subsystems, units.
The document shall include:
all satellite operations procedures (including order of commands)
all ground test procedures
all default on board data table parameters settings
complete telecommand & telemetry lists for the satellite operation
satellite database description
2.2 Differences with small spacecraft ground systems
The ground systems architecture for small spacecraft missions often takes a different form compared to the classical architectures used for large spacecraft missions. Low-cost constraints and the accessibility to COTS technology for the space sector have not only changed how designers think about a spacecraft but also how a ground systems architecture can be conceived. An overview of such potential differences highlights the extent to which microsatellite ground systems can differ from their classical counterparts [5].
10
Table 3. Fundamental differences between a small spacecraft ground system and classical ground systems for large spacecraft [5]
Classical Ground System Microsatellite Ground System
Legacy systems New systems
High-cost, high complexity Low-cost (COTS), low complexity
Clear distinction between mission control and ground station network
Standalone system: MCC, SOCC, POCC and principal ground station are often aggregated into a single entity
Supports a small to moderate number of different missions in parallel. Different types of antennas and hardware enable capability of
communicating with more than one
spacecraft simultaneously
Capability to support a large number of missions sequentially. Only one antenna, therefore no capability to communicate with more than one spacecraft simultaneously Supports missions with long lifetimes Supports missions with short lifetimes Provides high quality of service (security,
reliability, etc.)
Does not guarantee high quality of service
Commercial or institutional operators Typically academic or amateur operators Hierarchical topology with a small number of
nodes distributed strategically around the globe
Peer-to-peer topology with typically a large number of ad-hoc nodes participating on a voluntary basis
No flexibility in the use of the topology’s individual nodes
Many missions use nearly the same frequency bands, so individual nodes in the topology may be exchangeable
S-band and higher frequencies Typically UHF and VHF
CCSDS based long-haul communication protocols
TCP/IP based communication protocols
Big dishes Small dishes or no dish at all (Ham-type
antennas)
Support high power (> 40W) spacecraft Support low power (< 5W) spacecraft Large bandwidth, data rate and throughput Small bandwidth, data rate and throughput
Large software requirements Small software requirements
Large number of facilities and personnel with much expertise
Small number of facilities and personnel with usually less expertise
11
3. The European Student Earth Orbiter Project
The European Student Earth Orbiter (ESEO) is a micro-satellite mission to Low Earth Orbit (LEO). It is being developed, integrated, and tested by European university students as an ESA Education Office project.
ESEO will orbit the Earth taking pictures, measuring radiation levels and testing technologies for future education satellite missions.
It is aimed at providing students with unparalleled hands-on experience to help preparing a well-qualified space-engineering workforce for Europe’s future. For this purpose, the University of Bologna, coordinating a network of the European universities joining the ESEO project (Figure 4), organised university lecture courses and internship opportunities for 60 students out of about 200 students involved in the ESEO project. For the first time, academic credits (18 ECTS) are granted to students for their participation in hands-on projects of ESA’s Education Office [6].
Figure 4. ESEO University Network and roles
In particular, ESEO has the following mission objectives:
To take pictures of the Earth and/or other celestial bodies from Earth orbit for educational outreach purposes.
To provide dosimetry and space plasma measurement in Earth orbit and its effects on satellite components.
12
The first one will be achieved by the use of a micro camera (uCAM) operating in the visible spectrum.
To fulfil the second objective two instruments will be operated on-board: Plasma diagnostic probe (LMP).
Tri-dimensional dosimeter instrument (TRITEL). In particular, the LMP shall measure:
Electron density. Electron temperature. While the TRITEL shall measure
LET spectra; Absorbed dose. Dose equivalent.
In order to provide high-speed datalink for payload data transmission a dedicated S-band transmitter (HSTX) will be provided as payload complement.
The realization of third objective will consist in the flight test of GPS receiver for orbit determination and a de-orbit mechanisms (DOM) to be activated in order to comply with space debris mitigation policies.
Functional and performance tests will be performed during the satellite operative phase and the results examined on ground by the design team, in order to gain a full space qualification in view of their use on other educational missions.
The satellite will also carry on board a payload proposed by the AMSAT community; it will allow the satellite to be exploited by the radio-amateur community after the end of its operative phase. The satellite measures 33x33x63 cm and it will weight around 50 Kg. The target orbit for ESEO mission is a circular Sun-Synchronous Orbit (SSO) 10:30 LTAN. The orbital parameters are reported in Table 4 [7].
Table 4. ESEO orbital parameters
Orbital Parameters Mean System of Date Semi-major axis 6904.82699 km
Eccentricity 0.00134790
Inclination 97.47884º
13
Argument of Perigee 67.74183º
True Anomaly 292.25995º
The identified orbit produces a cycle of 106 orbits in a week, about 15 orbit per day, in order to complete the coverage of the selected areas of interest (Europe and South Atlantic Anomaly). The definition of the areas of interest was driven by the optical payload and the scientific instruments requirements [7].
Figure 5. ESEO maximum revisit time (in days) for the observed points
14
The project started in January 2013, the Preliminary Design Review was successfully completed in November 2013 and the Critical Design Review in June 2015. Now the project is in phase D and the launch is foreseen in late 2016 or early 2017.
3.1 Telecommunication System
The telecommunication system supports the functions of telemetry and telecommand (TMTC) for each phase of the mission. The spacecraft (S/C) telecommunication system consists of a redundant set of transceivers working at UHF-band for the uplink and the downlink. In addition, two payloads are included for telecommunication purposes, using L-band for uplink, and VHF and S-band for downlink. The VHF/L-band system being developed by AMSAT-UK is used for educational outreach as voice transponder and low data-rate telemetry (TM) downlink whilst the on-board S-band high-speed transmitter payload, being developed in Poland by a Wroclaw University of Technology team, will be used to download scientific payload data. The simultaneous downlink or uplink at different bands is currently not considered (but not excluded) for the mission. Similarly, full duplex communication is not foreseen at UHF band. Half-duplex communication is identified as the standard for TMTC communication. The platform communication subsystem is allocated for a space amateur-radio link with a downlink frequency of 437.000 MHz and an uplink frequency of 435.200 MHz. The selection of the modulation scheme at UHF-band is compliant with the space amateur regulation: the assumed modulation scheme is Pulse Code Modulation (PCM), Non-Return-to-Zero-Level (NRZ-L), Gaussian Frequency Shift Keying (GFSK) with a BT factor of the Gaussian filter equal to 0.5. The default data rate will be 9.6 kb/s, and can be changed to 4.8 kb/s, by a proper HPC. The S-band downlink can be performed at different modulations and data rates:
Safe mode transmission o Data rate: up to 1 kbps o Modulation: BPSK Nominal transmission
o Data rate: up to 4 Mbps o Modulation: OQPSK
High data rate transmission (elevation angle > 35°) o Data rate: up to 10 Mbps
15
3.1.1 Space-to-Ground communication protocol
The space-to-ground communication protocol for TMTC operations is based on the AX.25 radio amateur protocol [8], which has been preferred to the CCSDS protocol for its simplicity, diffusion among the university and radio amateur community and smaller overhead. This means that it requires less computational load to the on-board transceiver and a narrower bandwidth or shorter ground contact time to downlink the same amount of information. The large diffusion among the amateur and university community will be beneficial for receiving supports by other ground stations especially during the LEOP phase. For the sake of completeness, we report the main features of the communication protocol, you can refer to [9] for more details. Telecommands, telemetry data and acknowledgement/rejection messages are sent in small block of data, called frames. The AX.25 protocol identifies three general types:
Information frame (I frame) Supervisory frame (S frame) Unnumbered frame (U frame)
Each frame is made up of several smaller groups, called fields. U and S frames consist of five fields, for a total amount of 19 and 20 bytes respectively (Table 5 and Table 6), while I frames have a variable length depending on the info field length which is limited to 128 bytes leading to a maximum length of 149 bytes for I frames (Table 7).
Table 5. U frame structure
First byte
Flag Address Control FCS Flag 01111110 14 Bytes 1 Byte 2 Bytes 01111110
Table 6. S frame structure
First byte
Flag Address Control FCS Flag 01111110 14 Bytes 2 Bytes 2 Bytes 01111110
The Flag field is one byte long. Since the flag delimits frames, it occurs at both the beginning and end of each frame. A flag consists of a zero followed by six ones followed by another zero: 01111110 (0x7E). As result of bit stuffing, this sequence is not allowed to occur anywhere else inside a complete frame.
16
The Address field contains the source and destination address, both composed by 7 bytes for a total of 14 bytes.
The Control field identifies the type of frame being sent and includes sequence number to maintain flow control. Since two bytes are used in S and I frames, seven bits are dedicated to the sequence number (modulo 128).
The Frame Check Sequence (FCS) field is a sixteen-bit number calculated by both the sender and receiver of a frame. It is used to ensure that the frame was not corrupted by the medium used to get the frame from the sender to the receiver. It is calculated using the whole packet content excluding the flag bytes.
Table 7. I frame structure
First byte
Flag Address Control PID Info FCS Flag 01111110 14 Bytes 2 Bytes 11110000 N Bytes 2 Bytes 01111110
The external header of the I frame consists of 21 bytes. The same fields included in S frames are used, plus the protocol identifier and the info field.
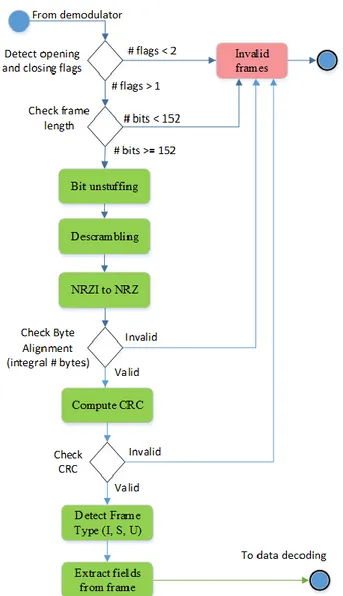
The Protocol Identifier (PID) field identifies what kind of layer 3 protocol is in use. In ESEO mission, no layer 3 protocol is implemented then it is set to 0xF0 (11110000). The Info field includes the internal header and the data bytes. The internal header is identified by the communication protocol between the on-board transceiver and the OBDH [10] . The interface is provided by means of an RS-422 serial link with a baud rate of 57600 bps. The flowchart of Figure 7 shows the bit operations and the frame detection during downlink operations. The bit stream coming from the demodulator undergoes a series of bit operations. The bit stuffing ensures that the flag bit sequence does not appear anywhere else in a frame, the scrambling increases the density of bit transitions easing time recovery and the NRZ to NRZI provides differential encoding of the bit stream easing clock recovery. Finally, the CRC-16-CCITT-1021 algorithm detects if the frame was corrupted during transmission. As shown by Figure 7, a frame is invalid if:
it is not bounded by opening and closing flags
it consists of less than 152 bits (including flags)
it is not byte aligned (i.e. it has not an integral number of bytes)
17
Figure 7. Bit operations and frame detection (downlink)
In the last two years, a significant interference has been experienced by different university satellite mission during uplink operations over the Europe in the UHF radio amateur frequency range 430-440 MHz as reported in [11], [12], and shown in Figure 8 [13]. For this reason, we decided to add channel coding. In particular, we added a Reed Solomon RS correction algorithm in the uplink chain, which is extremely powerful at burst error correction. The implemented RS algorithm is a shortened version with an error correcting capability of 8 bytes. Another useful expedient to alleviate the interference issue during uplink operations is to keep the length of TCs as short as possible due to the pulsing nature of the interference source.
18
Figure 8. RSSI (dBm) average interference world plot between 6/8/2014 and 11/8/2014
The S-band downlink communication protocol is fully compliant to the ECSS standards [14], [15].
3.1.2 Link budget
The main purpose of the link budget is to verify that the communication system will operate according to plan, that is, the message quality (error performance) will meet the specifications. The link budget takes into account the gains and losses of the transmitted signal through the media to the receiver. The budget tells how much EbN0 is received and how much safety margin exists beyond what is required [16]. The link budget computation is based on the range equation (3), which gives the carrier power at the receiver, C as the product between the power flux density at the receiver, M and the antenna effective area at the receiver, AR: 𝑀 = 𝑃𝑇𝐺𝑇 4𝜋𝑑2 = 𝐸𝐼𝑅𝑃 4𝜋𝑑2 (1) 𝐴𝑅 = 𝜆2𝐺 𝑅/4𝜋 (2)
19 𝐶 = 𝑀 ∙ 𝐴𝑅 = 𝐸𝐼𝑅𝑃 ( 𝜆 4𝜋𝑑) 2 𝐺𝑅 = 𝐸𝐼𝑅𝑃 ∙ 𝐿𝑠∙ 𝐺𝑅 (3)
Where d is the distance between the transmitter and the receiver, λ is the wavelength of the signal, EIRP is the effective isotropic radiated power, GR is the gain of the receiver and LS
is the path loss, which is wavelength (frequency) dependent. From (3), we can compute the signal-to-noise ratio SNR and then the EbN0 at the receiver, defining the thermal noise
power, N as:
𝑁 = 𝑘𝑇𝑠𝑊 (4)
Where k is the Boltzmann’s constant, TS is the system temperature in Kelvin and W is the
bandwidth in Hz. Knowing the definition of the bit energy Eb (5) and the single-sided noise
power spectral density N0 (6), we can obtain the EbN0 (7) and (8).
𝐸𝑏= 𝐶 ∙ 𝑇𝑏= 𝐶/𝑅𝑏 (5)
Where Tb is the bit time and Rb is the bit rate
𝑁0 = 𝑁/𝑊 (6) 𝐸𝑏 𝑁0 = 𝐶 𝑁∙ 𝑊 𝑅𝑏 = 𝐸𝐼𝑅𝑃𝐿𝑠𝐿𝑎𝐺𝑅 𝐾𝑇𝑠𝑅𝑏 (7)
Where La are the additional losses (i.e. polarization, pointing, atmospheric attenuation and
precipitation losses). (𝐸𝑏 𝑁0 ) 𝑑𝐵 = 𝐸𝐼𝑅𝑃 (𝑑𝐵𝑊) + 𝐿𝑠(𝑑𝐵) + 𝐿𝑎(𝑑𝐵) + 𝐺𝑅 𝑇𝑆 (𝑑𝐵 𝐾) + 228.6 − 10 log10𝑅𝑏(𝑏𝑝𝑠) (8)
Where the ratio between GR and TS is named figure of merit. The system link margin is
then given by the difference between the EbN0 computed in (8) and the required EbN0, which
can be read from Figure 9 for the desired value of BER. Figure 9 shows the theoretical BER curve for the non-coherent BFSK modulation described by (9).
20 𝐵𝐸𝑅 =1
2𝑒
−0.5∙𝐸𝑏𝑁0 (9)
Figure 9. Theoretical Noncoherent BFSK BER curve
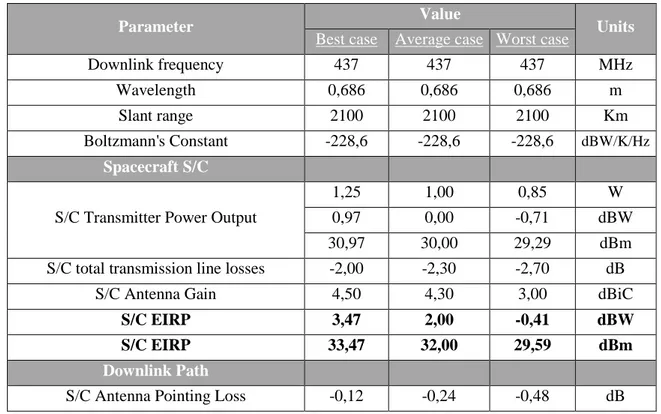
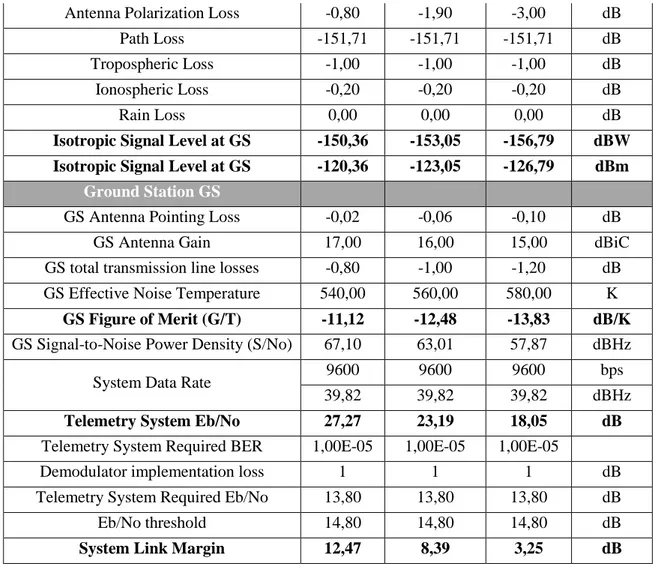
Table 8 and Table 9 reports the UHF downlink and uplink budget at 9.6 kbps respectively. The UHF link budget at 4.8 kbps and the S-band downlink budget can be found in [17]. This document also contains more detail about the space to ground interface.
Table 8. UHF downlink budget at 9.6 kbps
Parameter Value Units
Best case Average case Worst case
Downlink frequency 437 437 437 MHz
Wavelength 0,686 0,686 0,686 m
Slant range 2100 2100 2100 Km
Boltzmann's Constant -228,6 -228,6 -228,6 dBW/K/Hz
Spacecraft S/C
S/C Transmitter Power Output
1,25 1,00 0,85 W
0,97 0,00 -0,71 dBW
30,97 30,00 29,29 dBm
S/C total transmission line losses -2,00 -2,30 -2,70 dB
S/C Antenna Gain 4,50 4,30 3,00 dBiC
S/C EIRP 3,47 2,00 -0,41 dBW
S/C EIRP 33,47 32,00 29,59 dBm
Downlink Path
21
Antenna Polarization Loss -0,80 -1,90 -3,00 dB
Path Loss -151,71 -151,71 -151,71 dB
Tropospheric Loss -1,00 -1,00 -1,00 dB
Ionospheric Loss -0,20 -0,20 -0,20 dB
Rain Loss 0,00 0,00 0,00 dB
Isotropic Signal Level at GS -150,36 -153,05 -156,79 dBW Isotropic Signal Level at GS -120,36 -123,05 -126,79 dBm
Ground Station GS
GS Antenna Pointing Loss -0,02 -0,06 -0,10 dB
GS Antenna Gain 17,00 16,00 15,00 dBiC
GS total transmission line losses -0,80 -1,00 -1,20 dB
GS Effective Noise Temperature 540,00 560,00 580,00 K
GS Figure of Merit (G/T) -11,12 -12,48 -13,83 dB/K
GS Signal-to-Noise Power Density (S/No) 67,10 63,01 57,87 dBHz
System Data Rate 9600 9600 9600 bps
39,82 39,82 39,82 dBHz
Telemetry System Eb/No 27,27 23,19 18,05 dB
Telemetry System Required BER 1,00E-05 1,00E-05 1,00E-05
Demodulator implementation loss 1 1 1 dB
Telemetry System Required Eb/No 13,80 13,80 13,80 dB
Eb/No threshold 14,80 14,80 14,80 dB
System Link Margin 12,47 8,39 3,25 dB
Table 9. UHF uplink budget at 9.6 kbps
Parameter Value Units
Best case Average case Worst case
Uplink frequency 435,2 435,2 435,2 MHz
Wavelength 0,688 0,688 0,688 m
Slant range 2100 2100 2100 Km
Boltzmann's Constant -228,6 -228,6 -228,6 dBW/K/Hz
Ground Station GS
GS Transmitter Power Output
20,00 20,00 20,00 W
13,01 13,01 13,01 dBW
43,01 43,01 43,01 dBm
GS total transmission line losses -3,00 -3,70 -5,00 dB
Antenna Gain 17,00 16,00 15,00 dBiC
GS EIRP 27,01 25,31 23,01 dBW
GS EIRP 57,01 55,31 53,01 dBm
Uplink Path
22
Antenna Polarization Loss -0,80 -1,90 -3,20 dB
Path Loss -151,67 -151,67 -151,67 dB
Tropospheric Loss -1,00 -1,00 -1,00 dB
Ionospheric Loss -0,20 -0,20 -0,20 dB
Rain Loss 0,00 0,00 0,00 dB
Isotropic Signal Level at S/C -126,86 -129,76 -133,56 dBW Isotropic Signal Level at S/C -96,86 -99,76 -103,56 dBm
Spacecraft S/C
S/C Antenna Pointing Loss -1,00 -2,00 -3,00 dB
S/C Antenna Gain 4,50 4,30 3,00 dBiC
S/C total transmission line losses -1,70 -2,00 -3,00 dB
S/C Effective Noise Temperature 519,00 583,00 753,50 K
S/C Figure of Merit (G/T) -24,35 -25,36 -28,77 dB/K
S/C Signal-to-Noise Power Density (S/No) 76,39 71,48 63,27 dBHz
System Desired Data Rate 9600 9600 9600 bps
39,82 39,82 39,82 dBHz
Telemetry System Eb/No 36,56 31,66 23,44 dB
Telemetry System Required BER 1,00E-05 1,00E-05 1,00E-05
Demodulator implementation loss 1 1 1 dB
Telemetry System Required Eb/No 13,80 13,80 13,80 dB
Eb/No threshold 14,80 14,80 14,80 dB
System Link Margin 21,76 16,86 8,64 dB
3.2 Ground Segment
For ESEO project, the University of Bologna is responsible for the overall GS and is collaborating with other universities to build an essential network of ground stations (Figure 10). The ESEO GSN consists of three stations located at:
University of Bologna, in Forlì (Italy), used to transmit telecommands (TC) and receive the whole amount of TM data at UHF-band and as a secondary ground station to download the whole amount of data generated by the different payloads at S-band.
University of Vigo (Spain), used as backup for TMTC operations at UHF-band. Technical University of Munich (Germany), used as primary ground station for the
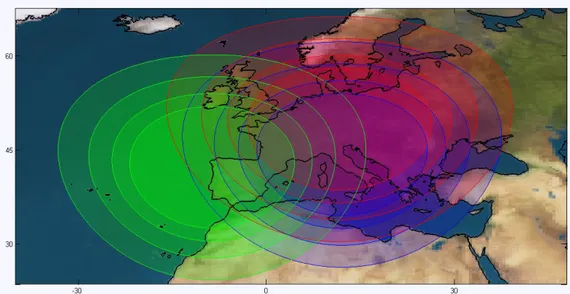
23
Figure 10. Detail of the visibility circles of Forlì, Munich and Vigo stations (5º, 10º, 15º and 20º minimum elevations)
Visibility analysis for the ground stations of the ESEO network has been performed and reported in [7]. Table 10 reports the statistics of ESEO contact durations with the stations of the network considering a minimum elevation of 5°. These results have been obtained considering the orbital parameters in Table 4.
Table 10. Statistics of contact durations with the stations (5º minimum elevation)
Station Forlì Munich Vigo Minimum (min) 1.60 1.90 2.77
Mean (min) 7.20 7.34 7.56 Maximum (min) 9.43 9.43 9.43 Blind orbits (of 106) 74 72 77
The network is coordinated from the MCC located in Forli through a system named SATNet developed by CalPoly University. It mainly consists of two different types of clients and one central node [18]:
Central node is the core of the network and it is named Network System (N-System). This node implements the services that enable the connection to the ground station network through a set of remotely invokable software interfaces. Software clients will be utilized for accessing the services provided by the
24
o Ground Station Clients (G-Clients) will be used by Ground Station Operators (G-Operators) for accessing to the services of the network. o Mission Operation Clients (M-Clients) will enable the access of Mission
Operators (M-Operators) to the services of the network. The services provided by the N-System are listed below:
Management Service: it includes the Registration Service, which permits the registration of users and clients in the N-System, the Configuration Service, which allows configuring the capabilities of the Ground Station and the communications requirements of the S/C and the Information Service, which enables the remote access to additional information (e.g. statistics report).
Scheduling Services: it is used by G and M clients for arranging a remote operation of an S/C.
Communications Services: it is required for exchanging data message between the G and M clients of the network.
The block diagram depicted in Figure 11 shows the ESEO ground segment highlighting the information exchanged among the satellite, ground stations, mission control center and the user segment.
Payloads Science TM packets (S band)
Vigo GS
TC Packets (UHF Band)
HK TM Packets (UHF band) TC Ack Packets (UHF band)
Payloads Planning
ESEO MCC Forlì GS
ESEO
TC Packets (UHF Band)
HK TM Packets (UHF band) TC Ack Packets (UHF band) Payloads Ancilliary TM Packets (UHF band) Munich GS
User Segment
Pass Planning (SATNET)
Science Data Downlink Report (SATNET) Science Data file (SATNET)
Payloads Requests (FTP) Payloads Request Status (FTP)
Pass Planning (FTP) Payloads Science TM packets
(S band)
25
A more detailed block diagram of ESEO ground segment is shown in Figure 12. It defines the connections between the software and hardware components and it highlights in different colours the contribution to the development of the ground segment by the different ESEO teams. In the left side, there is the ESEO SS with the S-band transmitter (HSTX), the TMTC transceiver and the AMSAT payload. The connections between the ESEO SS and the ground stations, illustrated in the next column, give information about the RF signal (frequency, modulation, bitrate). The components inside each ground station block represent the hardware and software used to move the antenna and receive/transmit messages from/to the SS. The messages are forward to the MCS through SATNet by using two different clients: the G-client at the ground station connected to demodulator software through a UDP connection and the M-client at the MCS connected to the TMTC data handling application through a UDP connection. The TM and the TC data are routed on two different ports. These messages are also stored for a limited time period in the SATNet DB implemented using PostgreSQL. The MCS is mainly based on a LabVIEW application connected to a MySQL DB for TMTC handling and it is widely described in 3.2.2. For a quick check of a selection of the most significant TM parameters from a smart phone, the TMTC software is connected to the LabVIEW Data Dashboard application. Engineering and payload science data are stored in two different DB scheme, which are available to the user community through a dedicated DB server.
The functional, interface, operation, design and performance requirements of the ground segment have been defined in [19].
26 ROTOR USRPN210 Serial 1GB Ethernet UDP E SE O P la tf or m GSM MUNICH Serial 1GB Ethernet UDP GSF2 Serial 1GB Ethernet UDP GSF1 ROTOR Serial Serial GSV VIGO AMSAT COMMUNITY WORLDWIDE SatNet UDP MCS PC JSON-RPC Over HTTPS AMSAT Data DataBase Server ODBC JDBC TMTC AMSAT Web Services
Protocol MCS Satnet Client
HSTX GS SatNet Client LabVIEW ROTOR USRPN210 ROTOR USRPN210 Engineering Data Science Data FORLI ICOM+TNC Internet SYNC Engineering Data Users LabVIEW Data Dashboard App In ter n et AMSAT-UK University of Wroclaw SITAEL TU Munchen University of Vigo University of Bologna Orbitron GS SatNet Client GS SatNet Client GNURadio Orbitron Gpredict LabVIEW GS SatNet Client GNURadio Orbit Propagator
Figure 12. ESEO Ground Segment detailed block diagram
3.2.1 Forli Ground Station
To support ALMASat-1 operations, a ground station has been developed in Forlì through the years since 2003. The RF communications of the mission were established on VHF uplink and UHF downlink and the RF system was based on commercial analogic radio (ICOM IC-910H), low noise amplifier (LNA) and terminal node controller (Kantronics KPC-9612+), compliant with the International Amateur Radio Union (IARU) guidelines and with the AX.25 standard protocol (Figure 13).
27
Figure 13. Forlì Ground Station configuration for
ALMASat-1 mission Figure 14. ALMASat-1 Ground Station
The 2x9 elements VHF Yagi antenna, operating in the frequency range 144 – 146 MHz and the 2x19 elements UHF Yagi antenna, operating in the range 430 – 440 MHz (see Appendix A), are moved by an azimuth and elevation rotor by AlfaSpid (see Appendix B). We recently added a 3m parabolic dish equipped with a septum dish feed (Figure 15) tuned in the CCSDS S-band frequency ranges: 2025-2120 for uplink and 2200-2300 MHz for downlink (Figure 16). The datasheet for the parabolic dish from RF Hamdesign can be found in Appendix C.
Figure 15. Septum dish feed mounted on a
3m parabolic dish by RF Hamdesign Figure 16. VSWR plot for the RX port of the septum
dish feed by RF Hamdesign
The AMGS will be soon moved on the top of a new building hosting the UNIBO engineering labs and the mission control room (Figure 18).
28
Figure 17. S-band parabolic dish antenna and VHF/UHF Yagi antenna
Figure 18. Mission control room
In the framework of the ESEO mission, we enhanced the Forlì ground station (AMGS) capabilities by introducing a software-defined radio (SDR). These radios are becoming every day more popular in amateur and university ground stations for satellite communications. They allow fast and cheap reconfiguration of the ground station for satellite missions using a different modulation scheme, communication protocol and frequency. This is possible thanks to the wide frequency band of RF front-end and because the signal is digitally processed at software level. In fact, unlike the ICOM IC-910H radio which is only capable of communicating in the 2 m and 70 cm bands and optionally the 23 cm band (see Table 11), the USRP uses modular daughterboards, which allow to communicate over a wide range of frequencies [20].
Table 11. ICOM IC-910H frequency coverage in Italy
Band Range 2 m 144.0-146.0 70 cm 430.0-434.0 435.0-438.0 23 cm 1240.0-1245.0 1270.0-1298.0
Moreover, SDR is very beneficial for education purposes: engineering students can simply develop digital communications algorithms on a computer applying their knowledge in communication theory to practical applications. Furthermore, thanks to its versatility, an SDR-based ground station will allow easily participating to many university satellites GSN
29
opening beneficial collaborations among universities. A ground station using a hardware radio and a TNC is only capable of communicating with satellites, which communicate using the AX.25 protocol. The SDR system for the AMGS comprises the USRP platform by Ettus Research, model N210, hosting the FPGA and the ADC/DAC (Figure 19), the wide bandwidth transceiver named SBX daughterboard (Figure 20) and the host PC running a dedicated software.
Figure 19. USRP N210 by Ettus Research Figure 20. SBX daughterboard by Ettus Research
Figure 21 shows the block diagram of the USRP: the incoming signal attached to the standard SMA connector of the USRP are mixed down using a direct-conversion (homodyne) receiver to baseband I/Q components, which are sampled by a two-channel, 100 MS/s, 14-bit analog-to-digital converter (ADC). The digitised I/Q data follows parallel paths through a digital down conversion (DDC) process that mixes, filters and decimates the input 100 MS/s signal to a user-specified rate. The down converted samples, when represented as 32-bit numbers (16 bits each for I and Q), are passed to the host computer at up to 25 MS/s over a standard Gigabit Ethernet connection.
For transmission, baseband I/Q signal samples are synthesised by the host computer and fed to the USRP at up to 25 MS/s over Gigabit Ethernet when represented with 32-bits (16-bits each for the I and Q components). The USRP hardware interpolates the incoming signal to 400 MS/s using a digital up conversion (DUC) process and then converts the signal to analog with a dual-channel, 16-bit digital-to-analog converter (DAC). The resulting analog signal is then mixed up to the specified carrier frequency.
An available 8-bit mode, in which 16-bits total are used to represent the I and Q values of a down converted sample or sample to be up converted, can enable a transfer rate of up to 50 MS/s over the Gigabit Ethernet connection between the host PC and the USRP.
The SBX daughterboard provides up to 100mW (20 dBm) of output power, a typical noise figure of 5 dB and 40 MHz of bandwidth. The local oscillators for the receive and transmit chains operate independently, which allows dual-band operation in the 400-4400 MHz
30
range. The low power signal transmitted by the SDR is then amplified using a high power amplifier (HPA) whose datasheet can be found in Appendix D.
The block diagram in Figure 22 shows the connection between the components of the VHF/UHF ground station listed in Table 12. The UHF chain, which will be used for the ESEO mission, is based on the SDR technology whilst the VHF chain has not been changed from ALMSat-1 version. Another example of an SDR-based ground station for university satellite missions can be found in [21]. For the S-band ground station, the components are listed in Table 13 whilst their connections are highlighted in the block diagram of Figure 23.
31
VHF Yagi antenna UHF Yagi antenna
Az-El rotator
LNA
High Power Switch
HPA SDR Digital controller S/S tracking SW SDR SW LNA Analog radio Modem CI-V Level Converter Coaxial Coaxial Coaxial Coaxial Coaxial Az El Coaxial Coaxial 1 GB Ethernet Serial Serial Serial
Figure 22. VHF/UHF ground station Table 12. VHF/UHF ground station components
Component Vendor Model
UHF antenna AFT 2x19 Yagi (430-440 MHz)
VHF antenna AFT 2x9 Yagi (144-146 MHz)
Az-El rotor RF Hamdesign SPID RAS Az-El rotator Rotor digital controller RF Hamdesign SPID RAS Az-El controller
High Power Switch SKYWORKS SKY12208-478LF
VHF LNA Landwehr N GaAs 145 MAS
UHF LNA Landwehr N GaAs 435 MAS
HPA MiniCircuits ZHL-50W-52
SDR Ettus Research USRPN210 + SBX daughterboard
Analog radio ICOM IC-910H
Modem Kantronics KPC 9612+
32 SDR S/S tracking SW SDR SW Coaxial Coaxial Az El 1 GB Ethernet Rotor Super LNA Rotor Controller Power Supply 3m parabolic dish +
septum dish feed
Coaxial Coaxial
HPA
USB
Figure 23. S-band ground station
Table 13. S-band ground station components
Component Vendor Model
Parabolic dish RF Hamdesign 3m up to 11 GHz Septum dish feed RF Hamdesign dual mode, LHCP/RHCP
Az-El rotor RF Hamdesign SPID BIG-RAS/HR Az-El rotor Rotor controller RF Hamdesign SPID BIG-RAS/HR MD-01
Power Supply RF Hamdesign SPID PS-01
Super LNA KUHNE electronic KU LNA 222 AH1
HPA MiniCircuits ZHL-100W-242+
SDR Ettus Research USRPN210 + SBX daughterboard
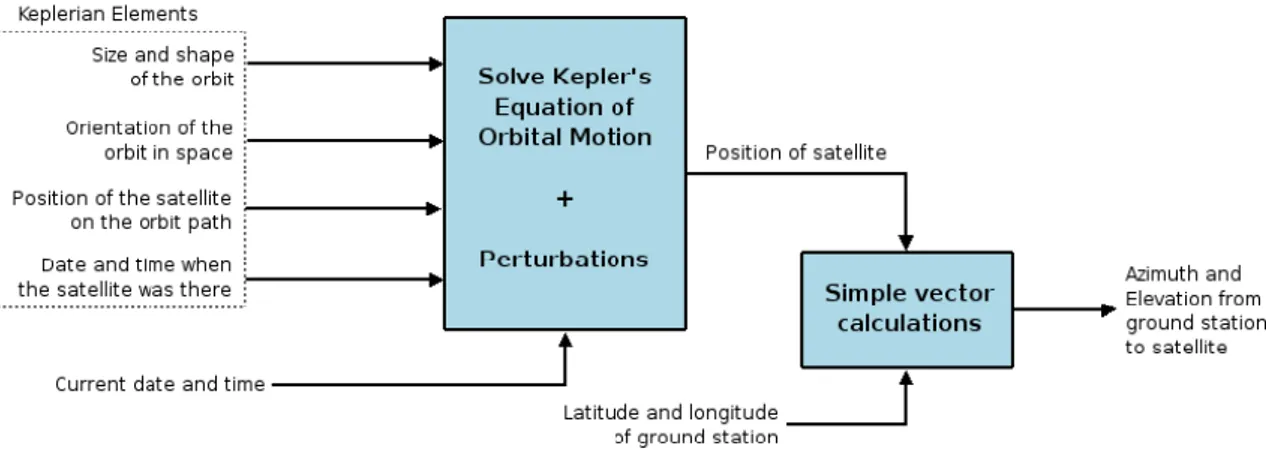
3.2.1.1 Satellite Tracking Software
Pointing the ground station antennas to the satellite is the first step for uplink and downlink operations. The antennas are moved by a rotor around the azimuth and elevation angles
33
through a digital controller connected to a computer running a satellite tracking software. There are several real-time satellite tracking and orbit prediction programs and the most popular are: Gpredict, Orbitron and Nova for Windows. They implement the NORAD SGP4/SDP4 algorithms to solve Kepler’s equation of orbital motion. The Keplerian elements are extracted from the TLE (as shown in Table 24) retrieved from the internet or local files. For our ground station, we selected Gpredict, an open source program which offers several views as depicted in Figure 25. It allows automated ground station operation providing both Doppler tuning for radios and antenna rotator control through Hamlib.
Figure 24. Computation of azimuth and elevation from ground station to satellite
34
3.2.1.2 Software Defined Radio implementation
Three main programming languages can be used to develop a customised software for SDR: LabVIEW, MATLAB/Simulink and GNURadio (GR) [22]. GR uses a two-tier structure: the computationally intensive processing functions are implemented in C++ while application-defined control and coordination of blocks are developed in Python. A description of GR working mechanism can be found in [23]. A first software model for AMGS was implemented in GNURadio and presented in [24] but the final model was developed in LabVIEW since it offers more functionalities for our purposes compared to the other possible solutions. The software takes advantage of the NI USRP and Modulation toolkit to interface with the USRP hardware and perform modulation [25] and it has been implemented using five parallel loops:
Signal acquisition and display Signal IQ data recording
Signal demodulation and UDP connection
UDP connection and signal modulation and transmission. Orbitron DDE connection
The signal acquisition loop forwards the IQ data to the signal recording and modulation loops using queue operations functions.
Figure 26. LabVIEW block diagram of the signal acquisition loop of the SDR software
The signal acquisition loop shown in Figure 26, comprises several functionalities. In the left top of the block diagram, some values used to define the signal displays are set as constant. For the STFT-based spectrogram (Figure 29), the time-frequency sampling info, which specifies the density to use to sample the signal in the time-frequency domain and defines the size of the resulting 2D time-frequency array, is specified in terms of time steps
![Figure 1. Schematic of typical space system, with the emphasis on software elements [1]](https://thumb-eu.123doks.com/thumbv2/123dokorg/8139710.126060/14.892.142.783.576.829/figure-schematic-typical-space-emphasis-software-elements.webp)
![Table 3. Fundamental differences between a small spacecraft ground system and classical ground systems for large spacecraft [5]](https://thumb-eu.123doks.com/thumbv2/123dokorg/8139710.126060/23.892.110.737.162.960/table-fundamental-differences-spacecraft-ground-classical-systems-spacecraft.webp)