Transportation Research Procedia 3 ( 2014 ) 710 – 719
2352-1465 © 2014 The Authors. Published by Elsevier B.V. This is an open access article under the CC BY-NC-ND license (http://creativecommons.org/licenses/by-nc-nd/3.0/).
Selection and peer-review under responsibility of the Scientific Committee of EWGT2014 doi: 10.1016/j.trpro.2014.10.050
ScienceDirect
17th Meeting of the EURO Working Group on Transportation, EWGT2014, 2-4 July 2014,
Sevilla, Spain
A simulation based approach for evaluating the impact of maritime
transport on the inventory levels of an oil supply chain
Pasquale Carotenuto
a* Stefano Giordani
band Alessandro Zaccaro
baIstituto per le Applicazioni del Calcolo “M. Picone” - National Research Council, via dei Taurini 19, Roma - 00185, Italy. bDipartimento di Ingegneria dell’Imresa, University of Rome “Tor Vergata”, via del Politecnico 1, Roma 00133, Italy
Abstract
One of the most important objectives of a manufacturing company is the optimization of the distribution of the produced goods considering the whole value chain. Unfortunately, in many companies the performance of the supply chain depends on many uncertain factors that are difficult to predict. The only way to face them is to adopt innovative solutions and tools that allow a swift response to the market changes. This paper analyzes the distribution processes managed by the logistics department of a large company producing and distributing petroleum products through the following main steps: crude oil’s transportation typically from many countries to a refinery; refining process; maritime transportation from the refinery to three costal depots; road transport from depots to gas stations. The analyzed process is the primary supply, consisting in the maritime transport from the refinery to the coastal depots, liable to stochastic activities and events as weather condition. Through simulating the primary supply, we study the effects that the ship traffic generates on the overall variance of inventory levels at the costal depots with respect to specific inventory level targets, and analyze the impact of different tactical decision choices on the variance reduction. Reducing inventory’s variance, through a better control of the distribution, allows the company to reduce inventory target levels and hence to reduce inventory costs in term of capital stock, while keeping the same risk level of stock out. The project is made of many phases: map all relevant processes to have a complete vision of transport’s structure; conduct a statistical analysis to identify specific statistical distributions of every ships’ process (delay, mooring, loading, etc.); model and simulate the primary supply using simulation software; use the model to make a “what-if” analysis. Within this project, it has been possible to realize a model that presents stochastic elements. All these phases are supported by six-sigma methodology, which focalizes on defects’ process reduction by the control of its mean square deviation and following the stages of the DMAIC (Define Measure Analyze Improve Control). One of the what-if analysis which has been done consists in simulating the opening refinery’s jetties h24, because currently these are closed during the night. Opening the jetties, will increase the capacity of some of the bottleneck
* Corresponding author. Tel.: +039-064-927-0926; fax: +039-064-404-306. E-mail address: [email protected]
resources for the oil distribution process, and thanks to the simulation model we can estimate quickly the effects on the oil transport system.
© 2014 The Authors. Published by Elsevier B. V.
Selection and peer-review under responsibility of the Scientific Committee of EWGT2014.
Keywords: Oil Supply Chain; Maritime Transport; Discrete event simulation
1. Introduction
Since the beginning of industrialization, logistics has faced many challenges to optimize the process of supply and distribution in an effort to not increase the final cost of product in the production chain with no added value. The advent of globalization has made supply chain management even more important and allowed the free movement of goods and products from all parts of the world, overcoming the barriers that existed until a few years before (see Confessore et al 2003). In this context, it appears how the maritime transport is not only grown in terms of volume, but has made it essential to create a single worldwide distribution network to make near countries actually extremely distant from each other.
The oil sector, having in maritime transport the main method of supply and distribution, has always invested a lot of effort into finding sophisticated methodologies to optimize their supply chain and reduce costs. In fact, in literature many authors study this problem. Dantzig and Fulkerson (1954) propose a linear programming model to resolve the best cargo size between two costal depots. Laderman et al. (1966), Mc Kay and Hartley (1974) investigate the problem of minimizing the number of vessels to allocate a given amount of goods. Later other two authors treated this theme: Miller (1987) describes an interactive software based on a network flow and a linear programming model that uses heuristics techniques; Brown et al. (1987) use a set partitioning model for small systems finding the optimum solution.
More recently Christiansen and Nigreen (1998), Felici et al. (2000), Christiansen and Fagerholt (2002), Ting and Tzeng (2003), Persson and Gothe-Lundgren (2005), Brønmo et al. (2007), and Felici et al. (2008), present various methods (and/or models) based on integer linear programming and mixed linear programming.
Considering the peculiar characteristics of this sector, the problem of inventory variance is of primary importance. In fact, dealing with huge volumes of product in stock at various harbors, a non-efficient transport programming (see Carotenuto et al. 2003) and control system causes a significant oscillations of the level of product in stock, that results, involve the use of considerable capital resources to compensate frequent and unpredictable fluctuations. To reduce this phenomenon, Oil Companies have embarked on a process of continuous improvement in order to reduce costs and ensure an excellent level of service and greater stability.
In this paper, we propose a simulation based approach (see Law 2006; Kelton et al. 2009) for achieving inventory variance reduction that is characterized for its execution speed, reliability and flexibility of use.
2. System definition
The logistics system of the oil company we consider consists of:
x The refinery in Milazzo (Sicily, Italy), connected directly to the harbor. It receives crude oil from various European and non-European countries and loads oil tankers with the finished product. It has four jetties for the vessels of crude oil and finished product;
x The coastal depots in Marghera, Livorno and Naples; x Other secondary depots.
On a regular basis, each depot needs to plan a series of activities to regulate its oil provisions (primary supply) from the refinery and its oil distribution to the service stations (secondary supply). An accurate planning by the Supply Department will ensure the smooth run of the whole system.
© 2014 The Authors. Published by Elsevier B.V. This is an open access article under the CC BY-NC-ND license (http://creativecommons.org/licenses/by-nc-nd/3.0/).
The management of a logistics system follows a “push strategy”, when the development of the single manufacturing process is carried out without considering the demand, i.e. the production of a refinery pushes the primary distribution to the coastal depots. The refinery of Milazzo, together with the coastal and secondary depots, works as a hinge to meet the demand that is "pulled" (pull strategy) from the service stations located in its nearby. The demand of the depots is covered both by its own production carried with the Company-owned vessel, called Time Charter, with the repositioning process and by purchases from the “oil market” to compensate the insufficient production of the refinery during peak demand. The company has another type of vessel, called SPOT, which the Company rents to balance the delays achieved by the Time Charter.
The monthly supply at the harbor of Milazzo is distributed on specific days of the month, called gates, in order to identify the time windows of two or three days when the vessels can supply without any waiting time at the harbor.
The delivery process involves two planning activities:
x Repositioning: the product delivery is scheduled in accordance with the production times of the Refinery and the availability of the oil cargo in consecutive trips (Time Charter). If the need arises for other oil cargos to complete the repositioning, these are rented with “Spot contract”;
x Purchases: If necessary, the Company buys directly on the market an oil cargo with finished product. These purchases, at present, occur only for the depot of Naples, the most important for the Company.
3. The inventory variance
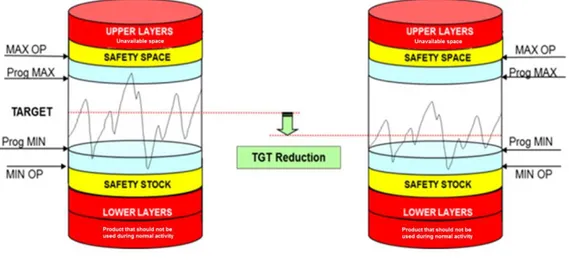
In the management of a generic depot, there is the need to reserve part of the useful space in the tanks for technical reason and for strategic layers (e.g. Safety Stock). Thus, for each product the inventory normally fluctuates within two operative limits (Min and Max Op.). The objective of the supply is to satisfy for each product the demand of the depot within the operative limits and with the aim of being aligned with all the related-targets of the products. The target makes sure the control of the inventory, in terms of the supply to be in line with the financial and trading statement of the company. Its definition is related to the seasonal changes of the products rather than technical needs (depots/refinery maintenance), demand trend, CSO ministerial duty. The inventory variance around the target becomes important since it affects the DELTA Min Op vs. Target (Figure 1).
Reducing the DELTA means to have a more controlled supply process and indeed reduce the target, therefore the overall inventory mean value. The aim of the project was the study of the inventory variance’s problem and the design of a simulation based system to control, test and improve the oil supply system by reducing inventory level variance and to check the economic impact of the resulting new possible scenarios.
Inventory variance’s main causes are the Domino effect and the demand variability. In this model, considering the specific characteristics of the supply chain, we assumed a constant demand during the days of the month but variable by months. In this way, without altering the project’s results, we recreated the demand’s periodicity and, at the same time, we isolated the contribution of the Domino effect, main aim of the project. The Domino effect consists in the accumulation and propagation of the delays of the Time Charter vessel during the journeys. In fact doing consecutive voyages, if the Time Charter gets a delay during a trip, it will conserve it also in the following one and due to this it probably will get an additional delay and so on, for example because it loses its gate at Milazzo and have to wait for the next available gate.
4. The solution approach
To solve this problem we developed a simulation model through which it is possible to simulate various scenarios. Furthermore, since the simulation process is characterized by many technical aspects, using the programming language Visual Basic for Application we realized user-friendly system, called “One click To Simulate”, that makes possible to use the model also by inexpert people in this field. Through user-friendly interfaces, the user can modify all the parameters of the transport system without having any knowledge about the model and the simulation software.
All the data feeding the simulator are obtained from a previous statistical analysis. Each activities has shown different characteristics in terms of variance deviation from the mean value and their study has resulted very important to understand the capability of the process as whole (Berthing Times, Inspection Times, Voyage Times, Loading Times, Discharging Times etc.). It was considered a life span of three years and for each activities, using an advanced statistical software, it was created specific distribution functions (Uniform, Box Cox, Johnson transformations etc.) to simulate the real times and to introduce in the model a strong stochastic component.
Structure
Below it is briefly illustrated the simulation model of the actual process that we created to represent and simulate the scenarios (Figure 2 – Repositioning process to Figure 6 – Purchase process).
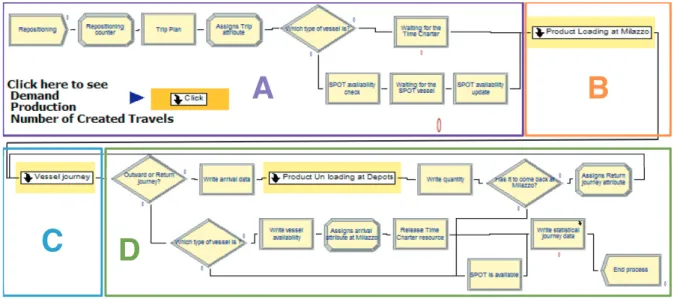
Fig. 2. Repositioning process.
A
B
A. In these modules, the model creates the vessel entities to which it assigns the destination, the type and the quantity of oil product to ship and the gate at the harbor of Milazzo. To simulate and create various scenarios, the simulator gets as input a data set of information by an Excel sheet with the real Company scheduling of one year and half. In this way, it’s possible to compare the results of various scenarios that have the same inputs to better isolate and understand the consequences of the variations done.
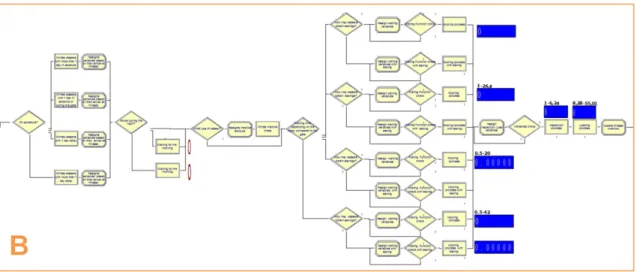
B. This sub model contains the various stages that the vessels must address to be processed after their arrival at Milazzo harbor. Each one is assigned a specific delay depending on the time when the oil tanker arrives at the gate:
○
At night or during the day: if the ship arrives during the day it passes to the next step, while if it arrives at night it has to wait the morning to go ahead;○
Tardiness or earliness with respect to its planned gate arrival time: thanks to the statistical analysis, the model presents four different categories of tardiness/earliness: earliness of more than one day, earliness of one day or timely, tardiness of one day and tardiness of two or more days.When it is the turn for a vessel to enter the port, three activities start successively:
○
Mooring: depending on the type of ship and weather condition, this operation requires from two to three tug boats;○
Inspection of the ship;○
Loading: this step is the longest one and it relies on some technical constrains as the loading pump’s power and the gas abatement system.Fig. 3. Loading sub model in Milazzo.
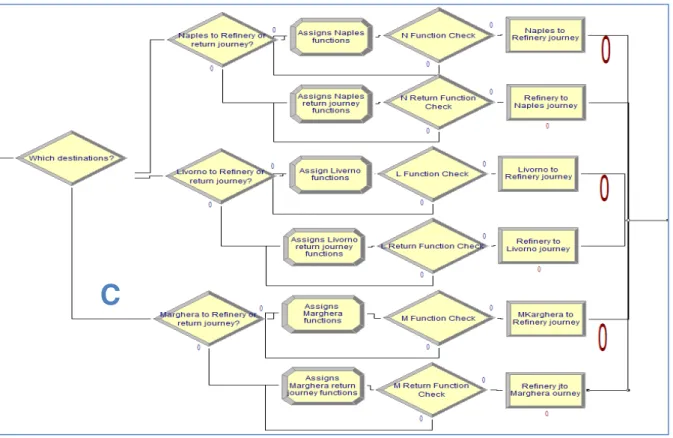
C. After loading the product, the vessel begins their journey to one of the three coastal depots: Naples, Livorno and Marghera. The sub-model simulates both the Refinery/Depot and the return Depot/Refinery journeys, with different durations.
Fig. 4. Trip sub model.
D. If the vessel is carrying out the journey to the depot, it enters into the sub-model D.1. Within this:
○
If the ship is the Time Charter (ship owned in consecutive trips) it is put back into sub-model C to begin the return trip;○
If instead, it is a SPOT (rented vessel), it does not have to return to Milazzo, and hence, it leaves the system. Conversely, if it has already completed the return trip:○
For the Time Charter vessel, is equivalent to be in front of the refinery and the vessel resource is one more time available and it restarts the process;○
In case of a SPOT vessel, it leaves the system.The sub-model D.1 contains the modules that simulate the processes of ship mooring, inspection and unloading, with different times depending on the destination port. The white/red boxes show the tank’s level of regular gasoline (UNL) and diesel fuel (AGO) whereas the blue bars show the duration (hours) of the three operations.
Fig. 5. Unloading sub model.
Working synergistically with repositioning, the purchase process (Figure 6) follows the same logic.
Each day of the simulation period is verified through a specified control function, created especially for this purpose, if the inventory level suggests making a purchase of a vessel on the cargo market to compensate the insufficient production of the refinery. This function reads and sums the level of product in the tanks of Naples, the planned repositioning and purchases and it compares this value with that one established by the Supply department. If this test gives a positive result a purchase order is made, the created entity comes out directly from the system.
Fig. 6. Purchase process.
E. Subsequently it is simulated the delay that the ships undergo, sorting them according to their arrival at the gate. Logically these vessels, being purchased directly on the market and therefore not involved to make consecutive trips, will not be subject to the Domino Effect and so they will not affect directly the inventory variance. However, they will suffer delays caused by the congestion of the jetties at Milazzo.
E
F
G
G.1
D.1
F. Once the vessels end up waiting for their turn (gate), they enter in the sub-model G.1 that performs the same operations of the sub model D.1.1, that is: mooring, inspection and unloading of oil at the harbor of Naples. Once these processes are completed, the ship does not return to Milazzo (because it is a purchase) and so it leaves the system.
The simulation lasts 50 run and, at the end, it is possible to consult the Excel file on which the simulator writes all the simulation results: inventory variances of the three depots, the inventory level, the number of purchases, all the vessels’ delay etc.
5. What if analysis
To reduce the inventory variance, that implies higher costs, it was decided to study the technical and economic impacts about the possibility to open overnight (h24) the jetties at the harbor of Milazzo. Currently it is forbidden to berth and un-berth from 9 pm to 6 am. It is necessary to clarify that although these operations are prohibited, the vessels continue to load / unload product, i.e. are inhibited only the berthing / un-berthing that use the services of tugboats and pilots. With the overnight opening of the jetties, it will increase the capacity of the bottleneck resource that boosts considerably the time trip and consequently influences the inventory variance. To quantify the savings achieved in the To-be scenario a statistical analysis was conducted. It consisted to reconstruct what would happened in the new configuration through a representation on a time axis of all the events that occurred at the jetties of Milazzo. Two events interest us because they modify the new scenario:
x The vessels that arrive from 9 pm to 6 am, even if they find the free jetties, they have to wait for the re-opening of the harbor to berth. Now they will be able to begin immediately berthing operations because the harbor will be open;
x As before, the vessels that finish loading operations during the night have to wait the re-opening to depart. In the new scenario, they can leave the harbor without waiting for the morning.
These events have two benefic consequences:
x Reduce the Domino Effect: by recovering valuable time they balance the Time Charter delay and the variance decreases;
x Reduction of demurrages: each vessel (Spot or Time Charter) has a very high rent cost therefore reducing waiting time has a direct economic benefit. Furthermore, through this the Time Charter could recover enough time such that it is no longer necessary to perform a repositioning and contribute to save the rent cost of the Spot ship. Moreover, since the jetties have a very high utilization rate, and then there are always ships waiting for mooring, if one of previous events occurs it will trigger a chain reaction that propagates the obtained benefit also to the following ships. For instance if a vessel finishes to load at 01:00 am, a second vessel will have to wait for the morning and the exit of the first ship from the harbor to moor. In the To-be scenario, the first ship could leave at 01:00 am (direct saving) so that the second ship can begin the berthing already during the night (indirect saving). The saving propagates until there is not ship waiting to berth or until the jetties are closed for some reasons (e.g. whether condition or maintenance) because these situations interrupt this event.
After identifying all of these events for an adequate period to have true records, it was possible to calculate the timesavings that would have been achieved in the To-be scenario. These time savings shall be considered as the skidding backwards on the time axis of the beginning moment of vessels’ mooring that trigger the two events (direct savings) plus those indirectly involved providing profit anyway (indirect savings). During this phase it has been verified with particular care if the skidding backward of the ships was allowed or not, in fact two ships cannot always load/unload simultaneously because they share the same resources. Two constraints were verified during the construction of the new time axis:
x Except for a limited period of time, it is not allowed to load the same product on ships because they use the same loading pump’s power and that would result in a significant increase in the loading time of the product;
x In order to protect the environment it has been installed a system to limit the gases resulting from the loading/unloading of the products. The various petroleum products produce different levels of gas and to avoid exceeding the gas limits of the system the loading/unloading of products that produce large amounts of gas is limited.
At the end of the statistical analysis, four timesavings (different number of hours) were identified, one for each delay categories (see B sub model) and the percentages of vessels to which assign these savings.
6. Results
The information about the costs are confidential data so it’s not possible to present the real cost function used in the model. By the way, we report a simplify cost function to show the economic key factors S = IVRK1 + DK2 +
RK3 – NK4 (where S is the annual saving in K$, IVR is the inventory variance reduction in kiloliter, K1 is the annual
inventory cost for 1 kiloliter of product in K$, D is the annual decrease (in hours) of demurrages, K2 is the cost for 1
hour of demurrages in K$, R is the annual reduction of the number of repositioning, K3 is the cost for each
repositioning in K$, N is the annual number of night moorings, K4 is the extra-cost for each night mooring in K$).
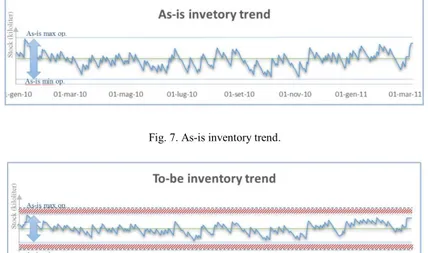
The proposed solution shows very interesting results, considering the low cost of implementation for it. In addition to the standard deviation’s reduction of 2.000 tons, we notice a reduction of the cost for the demurrages at Milazzo. After an economic analysis about variance’s reduction, the savings due to demurrages reduction and the extra-cost to berth during the night, simulation results show that the most significant key factor is the reduction of demurrages. Figures 7 and 8 show the inventory trends, respectively for the As-is and To-be scenarios. Comparing the charts, it is clear the benefits in term of variance’s reduction with the h24 jetties’ opening.
Fig. 7. As-is inventory trend.
Fig. 8. To-be inventory trend.
7. Conclusion
The topic covered in this article concerns the problem of controlling and reducing inventory variance in an oil supply chain. To fully understand this issue, a preliminary analysis of the oil maritime distribution system in all of its features has been carried out to properly frame the context. After this first analysis, the root causes of inventory variance were highlighted, and it was possible to proceed to the formulation of a strategy for decreasing the
inventory variance and its economic impact. In this sense, characterized by velocity, flexibility and dynamism, it has been created a model, using simulation software, which allows to simulate various scenarios in order to understand the consequences of the various factors involved. For the realization of this model a series of in-depth statistical analysis was carried out at different times, to derive and implement more accurate distribution functions of the stochastic processes involved. In parallel with this activity, we created the system “One Click To Simulate”, that automates the model, making it quick and easy. Indeed, in the constantly changing oil sector, it is essential to have a performing and easy to handle decision support tool, and therefore able to follow the changes of the external environment: expansion of the harbor at Milazzo or of the three logistics bases, installation of new equipment as the loading pumps, changing of volumes etc. In the past, these changes would not have been possible to simulate autonomously, requiring specific skills in modeling and use of the simulation software, thus making the model extremely limited. Now, any changes of the waiting times, trip times, volumes, etc. do not have more difficulty to be implemented, relying on this tool that is not only easier to interpret but makes you want to experiment with new solutions and scenarios. This model then is no longer seen as a simple simulator or an approximator of alternative realities, to use a one-off but as a real tool for decision support allowing finding solutions in real time by responding swiftly to unforeseen events.
Concluded this phase, it started the formulation and simulation of the To-be scenario to understand how the system would respond to the h24 opening of the jetties at Milazzo, in terms of inventory variance’s reduction and economic impact. In this sense, it has been carried out a further statistical analysis of the characteristic times of the phase of mooring/unmooring ship to detect the saving obtained in this scenario. Thanks to this, it was possible to implement in the simulator reliable and detailed data that have produced very interesting results. Simulation’s analysis has shown the positive effects that the suggested scenario has on system by reducing the inventory variance of the depots and the number of hours of demurrage. For this particular scenario, the economic analysis has shown that the greatest cost savings comes exactly from the fewer hours of demurrage.
The methodology explained in this article, though implemented in the oil industry, it is extremely adaptable and therefore suitable to be used in many industries due to its reliability, flexibility and speed.
References
Brønmo G., Christiansen M., Fagerholt K., Nygreen B., “A multistart local search heuristic for ship scheduling – a computational study”, Computers & Operations Research, Vol.34 (3), pp. 900-917, 2007.
Brown G. G., Graves G. W. and Ronen D., “Scheduling ocean transportation of crude oil”, Management Science, Vol. 33, pp. 335-346, 1987. Carotenuto P., Colarieti A., Confessore G., “An integrated model for the production distribution operational planning”, in K.S.Pawar and
M.Muffatto (eds.) Logistics and Networked Organisations, Proceedings of the 8th International Symposium on Logistics, University of Nottingham (UK), pp. 147-155, 2003.
Christiansen M., Fagerholt K., “Robust ship scheduling with multiple time windows”, Naval research Logistics, Vol. 49 (6), pp. 611-625, 2002. Christiansen M., Nygreen B., “A method for solving ship routing problems with inventory constraints”, Annals of OR, Vol. 81, pp. 357-378,
1998.
Confessore G., Giordani S., Stecca G., “A Distributed Simulation Model for Inventory Management in a Supply Chain”, in: L.M. Camarinha-Matos and H. Afsarmanesh (eds.), Processes and Foundations for Virtual Organizations, Kluwer Academic publishers, pp. 423-430, 2003. Dantzig G., Fulkerson D.R., “Minimizing the number of tankers to meet a fixed schedule”, Naval Research Logistics Quarterly, Vol. 1, pp.
217-222, 1954.
Felici G., Gentile C., Rinaldi C., Peri F., Farina V., "Un approccio integrato per l'ottimizzazione della distribuzione di prodotti petroliferi greggi via nave", in Scienza delle decisioni in Italia: applicazioni della ricerca operativa a problemi aziendali, G. Felici and A. Sciomachen(eds). ECIG, Genova, 2008.
Felici G., Gentile C., Rinaldi G., “Solving Large MIP Model in Supply Chain Management by Branch e Cut”, Istituto di Analisi dei Sistemi ed Informatica del CNR, Technical Report n. 522, 2000.
Law M. A., Simulation Modeling and Analysis with Expertfit Software, 4th edition, McGraw-Hill Publishing Co, 2006.
Lederman J., Gleberman L., Egan J.F., “Vessel allocation by linear programming”, Naval Research Logistics Quarterly, pp. 315-320, 1966. McKay M.D., Hartley H.O., “Computerized scheduling of seagoing tankers”, Naval Research Logistics Quarterly, Vol.21, pp. 255-264, 1974. Miller D.M., “An interactive computer-aided ship scheduling system”, European Journal of Operations Research, Vol.32, pp.363-379, 1987. Kelton W.D., Sadowski R.P., Sturrok D.T., Simulation with Arena, McGraw-Hill, 4th edition, 2007.
Persson J.A., Göthe-Lundgren M., “Shipment planning at oil refineries using column generation and valid inequalities”, European Journal of Operational Research, Vol.163 (3), pp. 61-652, 2005.
Ting S-C., Tzeng G-H., “Ship Scheduling and Cost Analysis for route Planning in Linear Shipping”, Maritime Economics e Logistics, Vol. 5(4), pp. 378-392, 2003.