Letter
https://doi.org/10.1038/s41586-019-1203-6An apical hypoxic niche sets the pace of shoot
meristem activity
Daan A. Weits1,2, Alicja B. Kunkowska1, Nicholas C. W. Kamps1, Katharina M. S. Portz1, Niko K. Packbier1, Zoe Nemec Venza2, Christophe Gaillochet3,4, Jan U. Lohmann3, Ole Pedersen5, Joost t. van Dongen1* & Francesco Licausi2,6*
Complex multicellular organisms evolved on Earth in an oxygen-rich atmosphere1; their tissues, including stem-cell niches, require continuous oxygen provision for efficient energy metabolism2. Notably, the maintenance of the pluripotent state of animal stem cells requires hypoxic conditions, whereas higher oxygen tension promotes cell differentiation3. Here we demonstrate, using a combination of genetic reporters and in vivo oxygen measurements, that plant shoot meristems develop embedded in a low-oxygen niche, and that hypoxic conditions are required to regulate the production of new leaves. We show that hypoxia localized to the shoot meristem inhibits the proteolysis of an N-degron-pathway4,5 substrate known as LITTLE ZIPPER 2 (ZPR2)—which evolved to control the activity of the class-III homeodomain-leucine zipper transcription factors6–8—and thereby regulates the activity of shoot meristems. Our results reveal oxygen as a diffusible signal that is involved in the control of stem-cell activity in plants grown under aerobic conditions, which suggests that the spatially distinct distribution of oxygen affects plant development. In molecular terms, this signal is translated into transcriptional regulation by the N-degron pathway, thereby linking the control of metabolic activity to the regulation of development in plants.
The shoot apical meristem (SAM) of plants—which is responsible for the production of aboveground organs—is characterized by a multi- layered structure, in which a central zone is dedicated to the mainte-nance of stem-cell identity and a peripheral region gives rise to whorls of new organs9. Spatial coordination of primordia production (known as phyllotaxis) is coordinated by polar auxin transport10, whereas the regulation of the temporal pattern of this process (termed ‘the plas-tochrone’) is less well-understood11,12. Studies in a variety of plant spe-cies have identified a number of genes that are involved in plastochrone length, and which constitute a complex signalling network that acts downstream of exogenous and endogenous cues13–17. Among these stimuli, oxygen is a highly reactive, diffusible molecule that retains a notable potential to attune developmental patterns according to meta-bolic needs. However, the role of oxygen levels in the SAM has not yet been assessed, because this tissue consists of a small group of densely packed cells that are surrounded by layers of developing primordia.
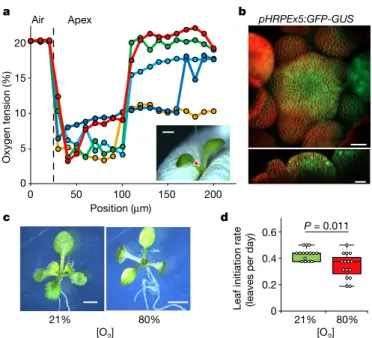
To investigate this aspect, we exploited a micro-scale Clark-type oxygen electrode, the miniaturized probe of which is sufficiently thin to measure oxygen levels at micrometre resolution (Extended Data Fig. 1a, b). Measurements through the shoot apex in the longitudinal and radial directions showed a sharp decline in the oxygen concentra-tion in a region that broadly overlaps with the stem-cell niche (Fig. 1a, Extended Data Fig. 1), which thus reveals the existence of a hypoxic niche that encloses the SAM. Consistent with these observations, the expression of 55% of the core hypoxia-inducible genes18 was signif-icantly higher in the SAM, as compared to juvenile leaves in public transcriptome databases (Extended Data Fig. 2). Moreover, a synthetic promoter named pHRPE—which is based on the hypoxia-responsive
promoter element (HRPE)19,20—drove β-glucuronidase (GUS) activity in the SAM and leaf primordia at normoxia (21% O2), whereas reporter staining progressively spread to outer tissues in plants that were exposed to increasingly hypoxic conditions (10% and 5% O2) (Extended Data Fig. 3a–c). pHRPE activity, as well as that of endoge-nous hypoxia-responsive promoters, was maintained in reproductive meristems (Fig. 1b, Extended Data Fig. 4). Conversely, a 12-h hyperoxic (80% O2) treatment strongly decreased GUS activity in the shoot apex, and repressed hypoxia-inducible genes in SAM-enriched samples (Extended Data Fig. 3a, c, d), which confirms that this tissue perceives hypoxic conditions. We also measured hypoxia, and the high level of low-oxygen-inducible transcripts, in the SAM of Solanum lycopersi-cum var. ‘Micro-Tom’, which indicates that O2 gradients are a common feature in shoot apices (Extended Data Fig. 5). Notably, the low
1Institute of Biology I, RWTH Aachen University, Aachen, Germany. 2Institute of Life Sciences, Scuola Superiore Sant’Anna, Pisa, Italy. 3Department of Stem Cell Biology, Centre for Organismal
Studies, University of Heidelberg, Heidelberg, Germany. 4Plant Molecular and Cellular Biology Laboratory, Salk Institute for Biological Studies, La Jolla, CA, USA. 5The Freshwater Biological
Laboratory, Department of Biology, University of Copenhagen, Copenhagen, Denmark. 6Biology Department, University of Pisa, Pisa, Italy. *e-mail: [email protected];
[email protected] d c 21% 80% [O2] [O2] 0.2 0.4 0.6 80% 21% 0 P = 0.011 a Position (μm) 0 5 10 15 20 0 50 200 Oxygen tension (%) 100 150 Apex Air b pHRPEx5:GFP-GUS
Leaf initiation rate (leaves per day)
Fig. 1 | A hypoxic niche is required for normal SAM activity. a, Oxygen
concentration through the SAM in the apical-to-basal direction. Colours represent individual measurements. An example of microsensor insertion is shown in the bottom right inset. Scale bar, 0.5 mm. b, GFP expression driven by the hypoxia-responsive promoter (pHRPE) in the Arabidopsis inflorescence meristem. The experiment was repeated three times with similar results. Scale bars, 20 μm (bottom), 25 μm (top). c, Phenotype of plants grown under aerobic and hyperoxic conditions. The experiment was repeated twice with similar results. In total, 15 plants for each condition were observed. Scale bars, 5 mm. d, Leaf initiation rate in Arabidopsis plants that were grown in normoxia and hyperoxia. One-way analysis of variance (ANOVA) followed by Holm–Sidak post hoc test; n = 15 plants.
availability of oxygen in the SAM did not appear to be a limiting factor for the production of new organs. In fact, inhibition of the hypoxic response in the SAM by exposing seedlings to hyperoxic (80% O2) conditions impaired—rather than improved—shoot meristem activ-ity (Fig. 1c, d). This result highlights the importance of the SAM being embedded in a low-oxygen niche to maintain phyllogenesis.
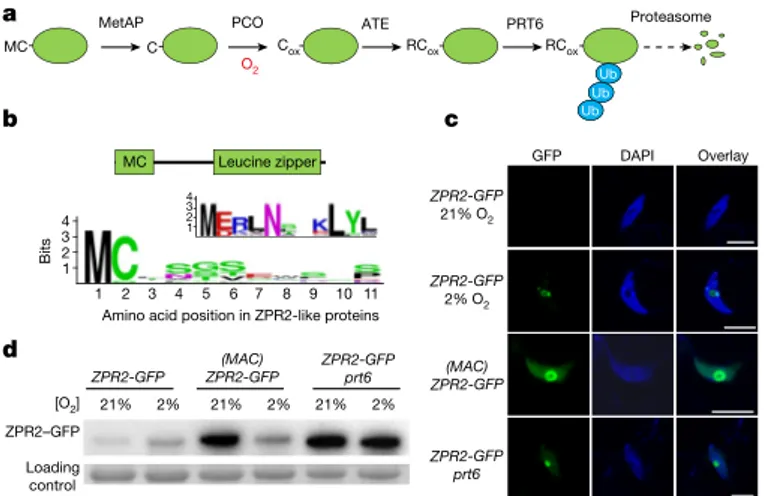
To investigate how the establishment of a hypoxic niche regulates SAM activity, we searched for oxygen-dependent molecular switches that are possibly involved in developmental processes. Among SAM-related proteins, we identified LITTLE ZIPPER 2 (ZPR2, also known as AT3G60890) as a possible proteolytic target of the oxygen- dependent branch of the N-degron pathway5,21,22 (Fig. 2a, b). In this pathway, a penultimate N-terminal Cys residue (Cys2) is exposed at the N terminus by removal of the initial methionine by a Met aminopepti-dase23. In the presence of nitric oxide and oxygen, Cys can be oxidized by plant cysteine oxidases24,25 and, subsequently, arginylated by Arg-aminotransferases26,27. Finally, proteins labelled with an N-terminal Arg can then be polyubiquitinated by the single-subunit E3 ligase PROTEOLYSIS 6 (PRT6), and thereby targeted to proteasomal degradation28 (Fig. 2a).
We focused on ZPR2 because it belongs to a protein family that is involved in organ polarity and SAM activity7,8. In flowering plants, the family of ZPR proteins comprises two separate clades, one of which is distinguishable by a conserved N-terminal Met-Cys motif (Fig. 2b, Extended Data Fig. 6). We first tested whether ZPR2 is a true target of the N-degron pathway, through a combination of confocal micros-copy, biochemical assays and immunoblots. A ZPR2–GFP fusion protein accumulated only after hypoxia treatment, whereas the addi-tion of an alanine (Met-Ala-Cys (MAC)) preceding the N-terminal cysteine led to stabilization under aerobic conditions (Fig. 2c, d). Hypoxia caused a decrease in the abundance of (MAC)ZPR2–GFP, either owing to repression of translation or by proteolytic counterbal-ance (as the relative mRNA levels were not affected) (Fig. 2d, Extended Data Fig. 7a). Moreover, the expression of ZPR2-GFP in a prt6 mutant background strongly promoted protein stability (Fig. 2c, d). Together with additional tests using alternative protein fusions (ZPR2–GUS and ZPR2–PpLUC), these results support the requirement of Cys2 for ZPR2 degradation in the presence of oxygen (Fig. 2c, d, Extended
Data Fig. 7b, c). We therefore hypothesized that ZPR2 could behave as a bona fide N-degron-pathway substrate in its own expression domain.
To investigate the expression pattern of ZPR2, we fused the ZPR2 promoter to a chimeric GFP-GUS reporter and observed that this gene was specifically active in the organizing centre of the SAM during vegetative and reproductive development (Fig. 3a), which—as shown above—occupies a hypoxic niche (Fig. 1, Extended Data Figs. 1, 4). Thus, we assessed ZPR2 stability under the naturally occurring oxy-gen gradient that is present in the SAM, using a pZPR2:ZPR2-GUS construct. A moderate GUS signal was observed in the shoot apex, which suggests that this protein is locally stable during normal develop-ment (Fig. 3b). As expected, application of hyperoxia decreased ZPR2– GUS stability, whereas hypoxia promoted the stability of ZPR2–GUS (Fig. 3b, Extended Data Fig. 7d). This indicates that SAM-localized hypoxia constitutes a post-transcriptional checkpoint for ZPR2 protein accumulation in the stem-cell niche.
To examine the role of ZPR2 in the SAM, we exploited two trans-fer (T)-DNA insertion mutants with abolished expression of ZPR2 (Extended Data Fig. 8a–d). Both zpr2-2 and zpr2-3 exhibited a decreased leaf initiation rate (leaves per day) as compared to a Col-0 wild type (Fig. 3c, d, Extended Data Fig. 8e). This phenotype was par-tially complemented by introducing a pZPR2:ZPR2-Flag construct in the zpr2-3 background (Extended Data Fig. 8f, g), which indicates that ZPR2 is required to sustain the leaf production rate by SAM cells. Cox Proteasome MC C MetAP PCO RCox RCox ATE PRT6 -Ub Ub Ub a O2 b Loading control ZPR2–GFP ZPR2-GFP ZPR2-GFP(MAC) ZPR2-GFPprt6 21% 2% 21% 2% 21% 2% d [O2] GFP DAPI Overlay ZPR2-GFP 21% O2 ZPR2-GFP 2% O2 (MAC) ZPR2-GFP ZPR2-GFP prt6 Leucine zipper MC 4 3 2 1 1 2 3 4 5 6 7 8 9 10 11 4 3 2 1 Bit s
Amino acid position in ZPR2-like proteins c
Fig. 2 | ZPR2 is an N-degron-pathway substrate. a, Schematic of the Cys
and Arg branch of the N-degron pathway. ATE, Arg-aminotransferases; C, Cys; Cox, oxidized Cys; MC, Met-Cys; MetAP, Met-aminopeptidase; PCO, plant cysteine oxidase; RCox, Arg-oxidized Cys; Ub, ubiquitin. b, Amino acid conservation at the N termini, and in the leucine-zipper domain of ZPR2-like proteins. c, Nuclear GFP fluorescence in leaf epidermal cells of wild type and prt6 mutants that express ZPR2-GFP or (MAC)ZPR2-GFP, in air and after 12 h of hypoxia. Nuclei were visualized by DAPI staining. The experiment was repeated twice with similar results. Scale bars, 10 μm.
d, GFP immunodetection in wild type and prt6 mutants that express ZPR2-GFP or (MAC)ZPR2-GFP, in air and after 12 h of hypoxia. The
experiment was repeated three times with similar results.
a b 80% O2 21% O2 2% O2 Wild type zpr2-2 zpr2-3 c d 0 0.4 0.8
Leaf initiation rate (leaves per day)
Wild type zpr2-2 zpr2-3
1.2
P < 0.001 P < 0.001
Fig. 3 | ZPR2 has a role in SAM activity. a, SAM-specific expression of ZPR2 during vegetative (top) and reproductive (bottom) development
using GUS (top left) or GFP reporters. The experiment was repeated twice with similar results. Scale bars, 25 μm (top right, bottom), 1 mm (top left).
b, Oxygen-dependent accumulation of ZPR2–GUS fusion protein driven
by the ZPR2 promoter. Hyperoxia and hypoxia treatments were performed for 12 h. The experiment was repeated twice with similar results. Scale bars, 200 μm. c, Shoot phenotype and leaf number of 20-day-old wild-type,
zpr2-2 and zpr2-3 plants. The experiment was repeated twice with similar
results. Scale bars, 2 cm. d, Leaf initiation rate (leaves per day) in wild-type, zpr2-2 and zpr2-3 plants. One-way ANOVA followed by Holm–Sidak post hoc test; n = 14 plants. The experiment was repeated twice with similar results.
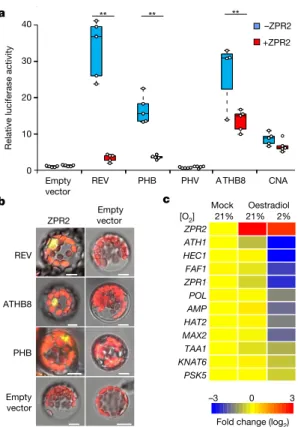
At the mechanistic level, ZPR proteins have previously been shown to act as negative regulators of the class-III homeodomain-leucine zipper (HD-ZIP III) group of transcription factors, which have exten-sively been characterized as being essential for SAM activity6,29,30. To investigate which HD-ZIP III proteins are controlled by ZPR2, we analysed the effect of ZPR2 on the transactivation capacity of each of the HD-ZIP III members, using a transient transformation system cou-pled to a dual luciferase assay. In mesophyll protoplasts, the overexpres-sion of ZPR2 repressed activity of REVOLUTA (REV), PHABULOSA (PHB) and HOMEOBOX GENE 8 (ATHB8) on the ZPR1 promoter (Fig. 4a). Notably, PHAVOLUTA (PHV) did not activate pZPR1, and CORONA (CNA) activity was not significantly affected by ZPR2 (Fig. 4a). C-terminal-tagging with GUS inhibited the repressive effect of ZPR2, without affecting the N-degron pathway susceptibility of ZPR2 (Fig. 3b, Extended Data Figs. 7b, 9a). Using bimolecular fluorescence complementation, we also confirmed the interaction between ZPR2 and each of REV, ATHB8 and PHB in vivo (Fig. 4b). These results sug-gest that ZPR2 represses the activity of specific HD-ZIP III members that act as regulators of SAM development.
To explore which genes it is that act downstream of the HD-ZIP III–ZPR2 regulatory module, we generated oestradiol-inducible ZPR2-overexpressing lines, and analysed the mRNA levels of known targets of HD-ZIP III proteins31. Induction of ZPR2 under hypoxia— but not under aerobic conditions—led to repression of REV-target genes (Fig. 4c). In addition, we visualized the repression imposed by ZPR2 in the shoot apex by means of GUS staining in promoter- reporter lines generated for HECATE1 (HEC1), PHYTOSULFOKINE 5 PRECURSOR (PSK5) and TRYPTOPHAN AMINOTRANSFERASE
OF ARABIDOPSIS 1 (TAA1) (Extended Data Fig. 9). Some of the genes affected by ZPR2 have previously been shown to alter WUSCHEL expression, and to have a role in SAM activity32–34. To confirm that ZPR2 can also alter the expression of these genes in its endog-enous SAM expression domain, we analysed the expression pattern of HD-ZIP III-target genes in the zpr2-3 loss-of-function mutant. Several HD-ZIP III-target genes were expressed to a higher extent in zpr2-3, which shows that ZPR2 is indeed required to repress these genes (Extended Data Fig. 10a, b). Finally, we observed that ectopic ZPR2 expression occasionally caused meristem arrest; the frequency of this arrest was significantly increased under ZPR2-stabilizing hypoxic con-ditions (2% O2) (Extended Data Fig. 8h, i). The phenotype associated with ectoptic ZPR2 expression resembles that of plants with severely reduced activity of HD-ZIP III proteins6,35,36. These results reveal a reg-ulatory system in which HD-ZIP III proteins are modulated by ZPR2, which—in turn—requires hypoxia to be stabilized at its specific site of expression (Extended Data Fig. 10c).
Together with recent reports on underground seedling develop-ment37, vernalization38 and the seasonal burst of grape buds39, our study supports the involvement of a Cys and Arg branch of the N-degron pathway to control plant development in an oxygen-dependent manner. However, in this study hypoxic conditions were studied not as a limiting factor, but rather as an established condition in SAM cells that promotes leaf organogenesis. Therefore, in our findings, oxygen assumes a role as an endogenous diffusible molecule that has signalling functions that connect developmental processes with metabolic activity. From an evolutionary perspective, stem cells that evolved independently in plants and animals have converged to being embedded in a hypoxic niche3, in which oxygen gradients act as a regulatory cue. Therefore, the precise manipulation of oxygen provision or modulation of its sensory mechanisms retains considerable potential for controlling developmen-tal patterns at spatial and temporal levels.
Online content
Any methods, additional references, Nature Research reporting summaries, source data, statements of data availability and associated accession codes are available at https://doi.org/10.1038/s41586-019-1127-1.
Received: 14 April 2018; Accepted: 12 April 2019; Published online 15 May 2019.
1. Lyons, T. W., Reinhard, C. T. & Planavsky, N. J. The rise of oxygen in Earth’s early ocean and atmosphere. Nature 506, 307–315 (2014).
2. Ito, K. & Suda, T. Metabolic requirements for the maintenance of self-renewing stem cells. Nat. Rev. Mol. Cell Biol. 15, 243–256 (2014).
3. Mohyeldin, A., Garzón-Muvdi, T. & Quiñones-Hinojosa, A. Oxygen in stem cell biology: a critical component of the stem cell niche. Cell Stem Cell 7, 150–161 (2010).
4. Tasaki, T., Sriram, S. M., Park, K. S. & Kwon, Y. T. The N-end rule pathway. Annu. Rev. Biochem. 81, 261–289 (2012).
5. Varshavsky, A. N-degron and C-degron pathways of protein degradation. Proc. Natl Acad. Sci. USA 116, 358–366 (2019).
6. Prigge, M. J. et al. Class III homeodomain-leucine zipper gene family members have overlapping, antagonistic, and distinct roles in Arabidopsis development. Plant Cell 17, 61–76 (2005).
7. Wenkel, S., Emery, J., Hou, B.-H., Evans, M. M. S. & Barton, M. K. A feedback regulatory module formed by LITTLE ZIPPER and HD-ZIPIII genes. Plant Cell 19, 3379–3390 (2007).
8. Kim, Y.-S. et al. HD-ZIP III activity is modulated by competitive inhibitors via a feedback loop in Arabidopsis shoot apical meristem development. Plant Cell 20, 920–933 (2008).
9. Soyars, C. L., James, S. R. & Nimchuk, Z. L. Ready, aim, shoot: stem cell regulation of the shoot apical meristem. Curr. Opin. Plant Biol. 29, 163–168 (2016).
10. Bhatia, N. et al. Auxin acts through MONOPTEROS to regulate plant cell polarity and pattern phyllotaxis. Curr. Biol. 26, 3202–3208 (2016).
11. Kuhlemeier, C. Phyllotaxis. Trends Plant Sci. 12, 143–150 (2007).
12. Lee, B., Yu, S. & Jackson, D. Control of plant architecture: the role of phyllotaxy and plastochron. J. Plant Biol. 52, 277–282 (2009).
13. Wang, J.-W., Schwab, R., Czech, B., Mica, E. & Weigel, D. Dual effects of miR156-targeted SPL genes and CYP78A5/KLUH on plastochron length and organ size in Arabidopsis thaliana. Plant Cell 20, 1231–1243 (2008). 14. Kawakatsu, T. et al. PLASTOCHRON2 regulates leaf initiation and maturation in
rice. Plant Cell 18, 612–625 (2006).
15. Miyoshi, K. et al. PLASTOCHRON1, a timekeeper of leaf initiation in rice, encodes cytochrome P450. Proc. Natl Acad. Sci. USA 101, 875–880 (2004).
b
0
–3 3
Fold change (log2)
10 20 30 40 Empty vector REV PHB PHV A THB8 –ZPR2 +ZPR2
Relative luciferase activit
y a CNA ** ** ** 0 ZPR2 ATH1 HEC1 ZPR1 POL AMP HAT2 MAX2 TAA1 KNAT6 PSK5 FAF1 Mock Oestradiol c [O2] 21% 21% 2% ZPR2 REV ATHB8 PHB Empty vector Empty vector
Fig. 4 | ZPR2 negatively regulates the activity of HD-ZIP III proteins. a, Effect of ZPR2 on the transactivation activity of HD-ZIP III proteins
on the ZPR1 promoter. One-way ANOVA, Holm–Sidak post hoc test;
n = 5 protoplast pools. The experiment was repeated twice with similar
results. b, Bimolecular fluorescence complementation of YFP, showing the interaction of ZPR2 with REV, ATHB8 and PHB. The experiment was repeated twice with similar results. Scale bars, 10 μm. c, Differential expression of HD-ZIP III-target genes after oestradiol (50 μM)-mediated
ZPR2 induction in air or hypoxia, measured by quantitative PCR after
reverse transcription (RT–qPCR). Numerical values and the respective statistical analysis are shown in Supplementary Table 5.
16. Fukaki, H., Tameda, S., Masuda, H. & Tasaka, M. Lateral root formation is blocked by a gain-of-function mutation in the SOLITARY-ROOT/IAA14 gene of
Arabidopsis. Plant J. 29, 153–168 (2002).
17. Gaillochet, C. et al. Control of plant cell fate transitions by transcriptional and hormonal signals. eLife 6, e30135 (2017).
18. Mustroph, A. et al. Cross-kingdom comparison of transcriptomic adjustments to low-oxygen stress highlights conserved and plant-specific responses. Plant Physiol. 152, 1484–1500 (2010).
19. Gasch, P. et al. Redundant ERF-VII transcription factors bind an evolutionarily conserved cis-motif to regulate hypoxia-responsive gene expression in Arabidopsis. Plant Cell 28, 160–180 (2016).
20. Kerpen, L., Niccolini, L., Licausi, F., van Dongen, J. T. & Weits, D. A. Hypoxic conditions in crown galls induce plant anaerobic responses that support tumor proliferation. Front. Plant Sci. 10, 56 (2019).
21. Gibbs, D. J. et al. Homeostatic response to hypoxia is regulated by the N-end rule pathway in plants. Nature 479, 415–418 (2011).
22. Licausi, F. et al. Oxygen sensing in plants is mediated by an N-end rule pathway for protein destabilization. Nature 479, 419–422 (2011).
23. Bradshaw, R. A., Brickey, W. W. & Walker, K. W. N-terminal processing: the methionine aminopeptidase and N-acetyl transferase families. Trends Biochem. Sci. 23, 263–267 (1998).
24. Weits, D. A. et al. Plant cysteine oxidases control the oxygen-dependent branch of the N-end-rule pathway. Nat. Commun. 5, 3425 (2014).
25. White, M. D. et al. Plant cysteine oxidases are dioxygenases that directly enable arginyl transferase-catalysed arginylation of N-end rule targets. Nat. Commun.
8, 14690 (2017).
26. Holman, T. J. et al. The N-end rule pathway promotes seed germination and establishment through removal of ABA sensitivity in Arabidopsis. Proc. Natl Acad. Sci. USA 106, 4549–4554 (2009).
27. Graciet, E. et al. The N-end rule pathway controls multiple functions during Arabidopsis shoot and leaf development. Proc. Natl Acad. Sci. USA 106, 13618–13623 (2009).
28. Garzón, M. et al. PRT6/At5g02310 encodes an Arabidopsis ubiquitin ligase of the N-end rule pathway with arginine specificity and is not the CER3 locus. FEBS Lett. 581, 3189–3196 (2007).
29. Mandel, T. et al. Differential regulation of meristem size, morphology and organization by the ERECTA, CLAVATA and class III HD-ZIP pathways. Development 143, 1612–1622 (2016).
30. Lee, C. & Clark, S. E. A WUSCHEL-independent stem cell specification pathway is repressed by PHB, PHV and CNA in Arabidopsis. PLoS ONE 10, e0126006 (2015). 31. Reinhart, B. J. et al. Establishing a framework for the ad/abaxial regulatory
network of Arabidopsis: ascertaining targets of class III homeodomain leucine zipper and KANADI regulation. Plant Cell 25, 3228–3249 (2013).
32. Schuster, C. et al. A regulatory framework for shoot stem cell control integrating metabolic, transcriptional, and phytohormone signals. Dev. Cell
28, 438–449 (2014).
33. Song, S.-K., Lee, M. M. & Clark, S. E. POL and PLL1 phosphatases are CLAVATA1 signaling intermediates required for Arabidopsis shoot and floral stem cells. Development 133, 4691–4698 (2006).
34. Wahl, V., Brand, L. H., Guo, Y.-L. & Schmid, M. The FANTASTIC FOUR proteins influence shoot meristem size in Arabidopsis thaliana. BMC Plant Biol. 10, 285 (2010).
35. Zhu, H. et al. Arabidopsis Argonaute10 specifically sequesters miR166/ 165 to regulate shoot apical meristem development. Cell 145, 242–256 (2011).
36. Yu, Y. et al. ARGONAUTE10 promotes the degradation of miR165/6 through the SDN1 and SDN2 exonucleases in Arabidopsis. PLoS Biol. 15, e2001272 (2017). 37. Abbas, M. et al. Oxygen sensing coordinates photomorphogenesis to facilitate
seedling survival. Curr. Biol. 25, 1483–1488 (2015).
38. Gibbs, D. J. et al. Oxygen-dependent proteolysis regulates the stability of angiosperm polycomb repressive complex 2 subunit VERNALIZATION 2. Nat. Commun. 9, 5438 (2018).
39. Meitha, K. et al. Spatio-temporal relief from hypoxia and production of reactive oxygen species during bud burst in grapevine (Vitis vinifera). Ann. Bot. 116, 703–711 (2015).
Acknowledgements This work was financially supported by the Deutsche
Forschungsgemeinschaft (DFG) (Projektnummer 243440351), the Excellence Initiative of the German Federal and State Governments, Scuola Superiore Sant’Anna, the University of Pisa and the Erasmus+ programme (Z.N.V.).
Reviewer information Nature thanks Nico Dissmeyer, Christine Foyer and the
other anonymous reviewer(s) for their contribution to the peer review of this work.
Author contributions D.A.W., J.T.v.D. and F.L. designed the experiments. D.A.W.,
A.B.K., N.C.W.K., K.M.S.P., N.K.P., Z.N.V., O.P. and F.L. carried out the experiments, as described in detail in Supplementary Table 8. D.A.W. and F.L. conducted the statistical analyses. C.G. and J.U.L. provided support for confocal analyses of shoot tissues. D.A.W., J.T.v.D. and F.L. wrote the manuscript with inputs by A.B.K, C.G., J.U.L. and O.P. All co-authors read and approved the manuscript.
Competing interests The authors declare no competing interests. Additional information
Extended data is available for this paper at
https://doi.org/10.1038/s41586-019-1203-6.
Supplementary information is available for this paper at https://doi.org/
10.1038/s41586-019-1203-6.
Reprints and permissions information is available at http://www.nature.com/
reprints.
Correspondence and requests for materials should be addressed to J.T.D. or
F.L.
Publisher’s note: Springer Nature remains neutral with regard to jurisdictional
claims in published maps and institutional affiliations.
© The Author(s), under exclusive licence to Springer Nature Limited 2019
MEthodS
No statistical methods were used to predetermine sample size. With the exception of plant cultivation in soil, the experiments were not randomized. Investigators were blinded to allocation during experiments and outcome assessment only in the cases of leaf counting and GUS staining.
Plant materials and growth conditions. Arabidopsis thaliana Columbia-0 (Col-0)
was used as wild-type ecotype. zpr2-2 (N483079, GK-866D0)—which was previ-ously described7—and zpr2-3 (N835524, SAIL_794_D11.C) and prt6 (N684039, SALK_051088C; this has previously been defined as prt6-5 (ref. 40) T-DNA inser-tion mutant seeds were obtained from the Nottingham Arabidopsis Stock Centre (NASC). The pHEC1:GUS line has previously been described41. S. lycopersicum var. Micro-Tom was used for measuring oxygen in shoot apices and for RT–qPCR.
Growth conditions. Seeds were set in soil (1/3 perlite, 2/3 peat soil), stratified at
4 °C in the dark for 48 h and subsequently germinated at a 16-h photoperiod with 22 °C day and 18 °C night conditions. For in vitro cultivation, seeds were sowed on agarized half-strength Murashige and Skoog (MS) medium, supplemented with 1% (w/v) sucrose and set to germinate at a 16-h photoperiod with 22 °C day and 18 °C night conditions. Evaluation of the effect of hyperoxia on plant develop-ment was performed by growing plants in a continuous flux of high concentra-tions of oxygen (80% (v/v) oxygen in air). Hypoxic treatments were performed under continuous darkness in Plexiglas boxes that were continuously flushing an oxygen-modified atmosphere (2% (v/v) O2/N2) for the time indicated in the text and figure legends.
Chemical treatment. 4′,6-diamidino-2-phenylindole (DAPI, Thermo Fisher
Scientific) and N-(3-triethylammoniumpropyl)-4-(6-(4-(diethylamino) phenyl) hexatrienyl) pyridinium dibromide (FM4-64 dye, Thermo Fisher Scientific) staining was carried out according to the manufacturer’s instructions.
Induction of ZPR2 transgene expression was achieved by 50 μm oestradiol, dissolved in ethanol; treatments lasted for 4 h before the application of hypoxia. An equal amount of ethanol was used as a control.
Cloning of the different constructs. Entry clones for ATHB8 (G24724) and PHB
(U25105) were obtained from the Arabidopsis Biological Resource Center (ABRC). All other coding sequences were amplified from complementary DNA templates using the Phusion High-Fidelity DNA Polymerase (New England BioLabs). Promoter sequences were amplified from wild-type (Col-0 ecotype) genomic DNA. All open reading frames were cloned into pENTR/D-TOPO (Thermo Fisher Scientific). Codon substitutions were achieved by means of site-directed mutagen-esis. The resulting entry vectors were recombined into destination vectors using the LR reaction mix II (Thermo Fisher Scientific) to obtain the relative expression vectors. A complete list and description of the primers and expression vectors used are provided in Supplementary Tables 6 and 7, respectively.
A 31-bp-long sequence containing the HRPE was retrieved from the LBD41 promoter (−364 to −331 from the initial ATG), repeated five times in tandem and fused to a minimal 35S promoter. This sequence, described in Supplementary Data, was synthesized by GeneArt (Thermo Fisher Scientific), inserted into pENTR/D-TOPO (Thermo Fisher Scientific) and recombined either into the binary vector pKGWFS7 plasmid42 or the p2GWL724 using LR clonase mix II (Thermo Fisher Scientific).
Identification, alignment and phylogenetic analysis of angiosperm ZPR pro-teins. Identification of ZPR protein sequences in different sequenced plant species
was performed by searching the Phytozome database (www.phytozome.net). Protein sequences similar to ZPR family members in A. thaliana were searched using the BLAST algorithm and the ZPR1, ZPR2, ZPR3 and ZPR4 sequences were used as baits. The obtained sequences were multi-aligned using the MUSCLE43 algorithm, before manual inspection and minor adjustments. Logos of conserved protein motifs were generated using WebLogo44. The MEGA745 software was used to create a phylogenetic tree. Default settings were used, choosing the Whelan and Goldman model, a gamma distribution with invariant sites (G + I) for rates among sites and partial deletion to treat missing data and/or gaps. The phylogenetic tree was tested using the bootstrap method with 500 replicates. Conservation of amino acid residues at specific positions in the N-terminal sequences of ZPR2-like and ZPR3-like proteins in angiosperms was calculated as the percentage of occurrence in the list of sequences considered for the phylogenetic analysis.
Stable plant transformation. Stable transgenic plants were obtained using the
floral dip method46. T0 seeds were selected for kanamycin, hygromycin and phosphinothricin resistance on agarized MS medium supplemented with the cor-responding antibiotic, and independent transgenic plants were identified.
Transient protoplast transformation and luciferase assay. A 2.7-kb genomic
fragment upstream of the ZPR1 (AT2G45450) coding sequence was PCR-amplified, cloned into pENTR-D/TOPO (Thermo Fisher Scientific) and recombined into pGreenII-800LUC to generate a reporter and normalization vector. Non-recombined p2GW7 vector was used as a negative control. Arabidopsis mesophyll protoplasts were prepared as previously described47 and transfected using 3 μg plasmid DNA each. Cells were incubated overnight in the dark in a WI solution
(0.5 mM mannitol, 20 mM KCl, 4 mM MES pH 5.6 and 10 mM glucose). A dual luciferase reporter assay was performed on protoplasts extract using a Dual-Luciferase Reporter Assay System (Promega) as previously described22. Assessment of leaf production rate. The number of visible leaves was determined
every two days. The average leaf initiation rate was calculated by dividing the total number of leaves by the days after the first measurement (eight days post- germination).
RT–qPCR. Total RNA extraction, DNase treatment, cDNA synthesis and
RT–qPCR analysis were performed as previously described24.
Confocal imaging. For GFP imaging, leaves from independently transformed
plants (two weeks old) were analysed with a Leica DM6000B/SP8 confocal micro-scope (Leica Microsystems) using 488-nm laser light (20% laser transmissivity), hybrid detection, and collected between 491 and 551 nm. DAPI was visualized upon laser excitation at 405 nm (2% laser transmissivity, PMT voltage 750 V) and collection at 415–485 nm. FM4-64 staining was detected using a laser excita-tion at 488 nm (20% laser transmissivity, PMT voltage 500 V) and collecexcita-tion at 650–750 nm. Images were analysed with the LAS X life science software (www.leica- microsystems.com), with unchanged lookup table settings in each channel. For imaging of the vegetative SAM, the meristems of four-day-old seedlings were exposed by peeling off one cotyledon, as previously described48. Dissection of the inflorescent meristem was performed according to a previously described method49.
SDS–PAGE and western blotting. Total proteins from leaves excised from three
to five individuals, belonging to one to three independent insertion lines, were extracted as previously described50. Protein samples were separated by SDS–PAGE on 10% acrylamide midigels (Bio-Rad) and then transferred onto a polyvinylidene difluoride membrane (Bio-Rad). The membrane was incubated with a mix of monoclonal anti-GFP antibodies (clones 7.1 and 13.1, Sigma-Aldrich) diluted 1,000-fold. Incubations with the antibody and the secondary antibody conju-gated to horseradish peroxidase (HRP) (Agrisera) were performed as previously described51. Detection was performed with the Chemidoc MP Imaging System (Bio-Rad) using the Millipore Luminata Forte Western HRP substrate (Merck). Amido black staining was used to confirm equal loading and transfer, according to a previously described method52.
Bimolecular fluorescence complementation assay. Vectors for the expression
of HD-ZIP III and ZPR2 fused to N-terminal or C-terminal YFP fragments were generated by recombination of the entry vectors (described in ‘Cloning of the different constructs’ and listed in Supplementary Table 7) with the destination vectors (as reported in Supplementary Table 7) by means of LR recombination using LR clonase II mix (Thermo Fisher Scientific). The complementation of YFP fluorescence in transiently transformed protoplasts was performed as previ-ously described53. Protoplasts were prepared according to a previously described method24 and transformed using 5 to 10 μg of each bimolecular fluorescence complementation vector.
In silico analysis of anaerobic genes in the SAM. RNA-normalized expression
levels of anaerobic genes from rosette, roots and SAM were extracted from the eFP browser54.
Histochemical GUS staining. Histochemical GUS staining was performed
accord-ing to a previously described method55. Imaging of GUS-stained plants was per-formed using a Leica M205 FA stereomicroscope equipped with a Leica DFC450 C camera. Micrographs were analysed using ImageJ software56. First, images were converted into a RGB stack and then the pixel intensities were inverted. Next, the measurement area, mean grey value and integrated intensity were measured for each individual GUS-stained plant. Background values were collected from wild-type plants after these plants were cleared using 70% (v/v) ethanol. Staining intensity was then calculated as: staining intensity = integrated intensity − (marked area × mean background grey value).
Quantitative GUS assay. Total proteins were extracted from protoplasts
trans-fected with GUS- or firefly luciferase-bearing vectors using Protein Lysis Buffer (Promega). Firefly luciferase activity was measured, as a control for transfection efficiency, using the Luciferase Assay System (Promega) according to the man-ufacturer’s instructions. Protein extracts were incubated in β-glucuronidase activity assay buffer containing 10 mM Tris–HCl pH 8.0, 0.6 mM CaCl, 5 mM 4-nitrophenyl β-d-glucuronide (PNPG, Sigma-Aldrich) for 7 h at 37 °C in the dark. Absorbance at 405 nm was measured to record the release of p-nitrophenyl. Reactions in the absence of the PNPG substrate were run to correct for background signal.
Microprofiling of O2 in the SAM. Microprofiling of tissue O2 followed a previously published procedure57 with few modifications. Four- or seven-day-old seedlings were gently held between two layers of Parafilm with a drop of deion-ized (DI) water to prevent desiccation, fixed in Blu Tack putty and positioned in a Petri dish. Microprofiles of O2 in the SAM were taken using a custom-built Clark-type microsensor with a bevelled tip and a diameter of 3 μm (Unisense A/S). The microsensor was connected to a pA meter (Oxymeter, Unisense A/S) and mounted
on a motorized micromanipulator (MM33, Unisense A/S). Data acquisition and positioning of the motorized micromanipulator were controlled with Profiling (SensorTrace Suite 2.8). The tip of the microsensor was advanced in steps of 10 μm, starting outside the tissue until the target tissue had been completely penetrated. Typically, a complete profile was measured in 10 min. Before measurements, the sensor was calibrated at air equilibrium (DI water purged with air, 20.6 kPa pO2) and at zero O2 (alkaline DI water with ascorbate). The fine positioning above the target tissue was aided by using a boom-stand dissection microscope. The depth at which the microsensor entered the tissue was followed by microscopic observation. All measurements were carried out at 20 °C in dim light; an initial test showed that light had no significant effect on tissue pO2 (measured in darkness and at 250 μmol photons per m2 per s).
Benchmarking of the customized oxygen microsensor against a standard oxygen microsensor. An oxygen-consuming 2% agar was prepared by adding
2 g of sodium ascorbate to 10 ml of warm liquid agar solution adjusted to pH 11. After cooling to 20 °C, a thin layer of DI water (100–200 μm) was added to the sur-face of the agar plate. The customized oxygen sensor was compared to a standard microsensor with a tip diameter of 10 μm (OX10, Unisense A/S). Measurements were taken from humid air (20.6 kPa) and into the water–agar interface with steps of 20 μm to a depth of 600 μm. In the graph, zero on the horizontal axis indicates the transition between air and water–agar. The replicates were taken at different positions on the oxygen-consuming agar plate.
Statistics and reproducibility. Sigmaplot (Systat) software was used to evaluate
significant variations between genotypes or treatments, using a t-test or one-way or two-way ANOVA, as appropriate. Holm–Sidak, Dunn and Tukey post hoc tests were used to assess the statistical difference in comparisons after a one- or two-way ANOVA. Fisher’s exact tests were carried out using the GraphPad QuickCalcs online tool (https://www.graphpad.com/quickcalcs/). The P values calculated for each pairwise comparison (Student’s t-test, Fisher’s exact test and post hoc tests) are shown in each graph above the line that connects the two sets of data. For all figure legends, n represents the number of independent biological replicates.
Box plots were generated using BoxPlotR58. All boxplot limits represent the 25th and 75th percentiles of each set of data points, and the whiskers extend to the lowest and highest data point within 1.5× the interquartile range of the 25th and 75th quartile. The central line represents the median. All independent data points are displayed in the plots using the R beeswarm package.
Reporting summary. Further information on research design is available in
the Nature Research Reporting Summary linked to this paper.
Data availability
Accession numbers of all the Arabidopsis genes analysed in this study are listed in the text or figure legends. All numerical data used to generate the graphs displayed in this report are provided as Source Data. Seeds of transgenic lines used in this
study are available from the corresponding authors upon request. The uncropped versions of all gels and blots are provided as Supplementary Fig. 1.
40. Riber, W. et al. The greening after extended darkness1 is an N-end rule pathway mutant with high tolerance to submergence and starvation. Plant Physiol. 167, 1616–1629 (2015).
41. Schuster, C., Gaillochet, C. & Lohmann, J. U. Arabidopsis HECATE genes function in phytohormone control during gynoecium development. Development 142, 3343–3350 (2015).
42. Karimi, M., Inzé, D. & Depicker, A. GATEWAYTM vectors for Agrobacterium-mediated plant transformation. Trends Plant Sci. 7, 193–195 (2002). 43. Edgar, R. C. MUSCLE: multiple sequence alignment with high accuracy and
high throughput. Nucleic Acids Res. 32, 1792–1797 (2004).
44. Crooks, G. E., Hon, G., Chandonia, J. M. & Brenner, S. E. WebLogo: a sequence logo generator. Genome Res. 14, 1188–1190 (2004).
45. Kumar, S., Stecher, G. & Tamura, K. MEGA7: Molecular Evolutionary Genetics Analysis version 7.0 for bigger datasets. Mol. Biol. Evol. 33, 1870–1874 (2016).
46. Zhang, X., Henriques, R., Lin, S.-S., Niu, Q.-W. & Chua, N.-H. Agrobacterium-mediated transformation of Arabidopsis thaliana using the floral dip method. Nat. Protocols 1, 641–646 (2006).
47. Yoo, S.-D., Cho, Y.-H. & Sheen, J. Arabidopsis mesophyll protoplasts: a versatile cell system for transient gene expression analysis. Nat. Protocols 2, 1565–1572 (2007).
48. Pfeiffer, A. et al. Integration of light and metabolic signals for stem cell activation at the shoot apical meristem. eLife 5, e17023 (2016).
49. Heisler, M. G. & Ohno, C. Live-imaging of the Arabidopsis inflorescence meristem. Methods Mol. Biol. 1110, 431–440 (2014).
50. Huck, N. V. et al. Combined 15N-labeling and TandemMOAC quantifies phosphorylation of MAP kinase substrates downstream of MKK7 in Arabidopsis. Front. Plant Sci. 8, 2050 (2017).
51. Beckers, G. J. M. et al. Mitogen-activated protein kinases 3 and 6 are required for full priming of stress responses in Arabidopsis thaliana. Plant Cell 21, 944–953 (2009).
52. Goldman, A., Harper, S. & Speicher, D. W. Detection of proteins on blot membranes. Curr. Protoc. Protein Sci. 86, 10.8.1–10.8.11 (2016).
53. Gehl, C., Waadt, R., Kudla, J., Mendel, R.-R. & Hänsch, R. New GATEWAY vectors for high throughput analyses of protein-protein interactions by bimolecular fluorescence complementation. Mol. Plant 2, 1051–1058 (2009). 54. Winter, D. et al. An “Electronic Fluorescent Pictograph” browser for
exploring and analyzing large-scale biological data sets. PLoS ONE 2, e718 (2007).
55. Jefferson, R. A., Kavanagh, T. A. & Bevan, M. W. GUS fusions: beta-glucuronidase as a sensitive and versatile gene fusion marker in higher plants. EMBO J. 6, 3901–3907 (1987).
56. Collins, T. J. ImageJ for microscopy. Biotechniques 43, S25–S30 (2007). 57. Herzog, M. & Pedersen, O. Partial versus complete submergence: snorkelling
aids root aeration in Rumex palustris but not in R. acetosa. Plant Cell Environ. 37, 2381–2390 (2014).
58. Spitzer, M., Wildenhain, J., Rappsilber, J. & Tyers, M. BoxPlotR: a web tool for generation of box plots. Nat. Methods 11, 121–122 (2014).
Extended Data Fig. 1 | Low-oxygen levels in the Arabidopsis shoot apex overlap with the meristematic niche. a, Comparison of spatial resolution
and accuracy of the custom-made Clark-type microsensor used here (red, orange and pink triangles) alongside the commercially available sensor OX10, Unisense A/S (turquoise, cyan and cobalt-blue circles). Oxygen-consuming solid medium was prepared by sodium ascorbate oxidation. The dataset shows that, in 2% agar with a steep gradient in dissolved oxygen from atmospheric equilibrium to anoxia, the two sensors show identical responses. Five independent profiles were recorded for each type of microsensor. b, Depiction of the experimental setup adopted to measure the oxygen concentration profiles in the apical-to-basal direction (left) and radial direction (right). c, Oxygen concentration profile in the apex of a four-day-old Arabidopsis seedling. The experiment was
repeated twice with similar results. d, Tracking of the sensor insertion pattern reconstructed after the oxygen profile in c was taken. The SAM was visualized by confocal microscopy after FM4-64 staining of plasma membranes. e, Oxygen concentration profile obtained by inserting the Clark-type microsensor laterally through the SAM of seven-day-old
Arabidopsis plants in the shoot apical region (profile 1), at the junction of
cotyledon vasculature (profile 2) and below the junction (profile 3). The experiment was repeated three times with similar results. A photograph of the experimental setup is shown within the plot frame (bottom right inset). f, Position of the sensor insertion points as identified by optical microscopy (top) and localization of the CLAVATA3 (CLV3) expression domain, reported by GUS staining of plants that express pCLV3:GUS in four-day-old plants (bottom).
Extended Data Fig. 2 | Transcripts that belong to the core hypoxia-inducible genes are specifically enriched in shoot, but not in root, meristem tissues. a, Pie charts that represent the relative abundance of
differentially expressed genes within the core hypoxia-inducible set1, in a comparison between the SAM and juvenile leaf tissues, and the root meristem (RM) and elongation zone and maturation zone of the root. Absolute expression levels, standard error, ratios and statistics are shown
in Supplementary Tables 1 and 2 for shoots and roots, respectively.
b, Schematic of SAM and root meristem cell types. c, Heat map showing
the expression levels of core hypoxia-inducible genes in the SAM and root-meristem cell types depicted in b. Absolute expression levels were retrieved from the Arabidopsis eFP browser (http://bar.utoronto.ca/efp/ cgi-bin/efpWeb.cgi), and are provided in Supplementary Table 3.
Extended Data Fig. 3 | Low-oxygen conditions in the shoot apex induce molecular hypoxic responses. a, Oxygen responsiveness of a
synthetic construct that consists of five repeats of the HRPE reporter (named pHRPEx5:GFP-GUS). The experiment was repeated twice with similar results. b, c, Quantification of the relative staining intensity of the pHRPEx5:GFP-GUS reporter at 21%, 10% and 5% O2 (b), and 21% and 80% O2 (c), shows that this construct effectively reports the oxygen status of tissues. One-way ANOVA followed by Tukey post hoc test (b) or two-sided t-test (c). d, RT–qPCR was used to measure the expression of the hypoxia-inducible genes PLANT CYSTEINE OXIDASE 1 (PCO1),
WOUND INDUCED PROTEIN 4 (WIP4), HYPOXIA RESPONSIVE ATTENUATOR 1 (HRA1), PLANT CYSTEINE OXIDASE 2 (PCO2), HEMOGLOBIN 1 (HB1), PYRUVATE DECARBOXYLASE 1 (PDC1) and ALCOHOL DEHYDROGENASE (ADH) in leaves and shoot apices, after
normoxic and hyperoxic treatments (80% O2, 6 h). The higher expression of these mRNAs in the SAM, compared to the leaf samples, was repressed by hyperoxia. A two-way ANOVA followed by Tukey post hoc test was used to assess the statistical significance of the observed differences.
Extended Data Fig. 4 | Hypoxic conditions are maintained in reproductive meristems. a, Oxygen concentration profiles obtained
inserting the Clark-type microsensor in the apical-to-basal direction through the inflorescence meristem of 5-week-old Arabidopsis plants. The inset shows a photo of the actual experimental setup with the insertion of the microsensor inside the inflorescence meristem.
The experiment was repeated independently three times with similar results. b, Green fluorescent signal in inflorescence and floral meristems of plants transformed with the hypoxia reporters pPCO1:GFP-GUS and pPCO2:GFP-GUS that were characterized as specifically hypoxia responsive in a previous publication24. The experiment was repeated twice with similar results.
Extended Data Fig. 5 | A hypoxic niche at the shoot apex is a common feature of plants. a, The customized Clark-type microsensor was used
to measure oxygen profiles throughout the shoot apex of one-week-old
S. lycopersicum var. Micro-Tom plants, in the apical-to-basal direction.
These measurements show the presence of an oxygen gradient in the shoot apex of this plant species. The experiment was repeated twice with similar results. b, Photograph showing the insertion of the micro-electrode inside the tomato SAM. c, d, Overlay of oxygen profiles (c and d shown as cyan and red, respectively, in a) and micrographs of SAM tissues after FM4-64 membrane staining that show the actual penetration of the sensor. The puncture in the centre of the meristem and the concomitant accumulation
of FM4-64 shows the penetration of the sensor into the tissue. The experiment was repeated four times with similar results; two examples are shown in c and d. e, Similar to Arabidopsis, the typical hypoxia-marker genes ALCOHOL DEHYDROGENASE 2 (ADH2), pyruvate decarboxylases (PDC1 and PDC3), PLANT CYSTEINE OXIDASE 2 (PCO2) and
PHYTOGLOBIN 1 (HB1a) are expressed at a higher level in SAM-enriched
tissues than in juvenile leaves of two-week-old plants of S. lycopersicum var. Micro-Tom. PYRUVATE DECARBOXYLASE 4 (PDC4) does not exhibit the same pattern. These results indicate that SAM cells experience hypoxic conditions. RT–qPCR was used to measure the expression of hypoxia-inducible genes (two-sided t-test; n = 4 pools of 5 plants).
Extended Data Fig. 6 | ZPR2-type proteins are distinguished by a variable N-terminal domain with a conserved Cys residue in the penultimate position. a, Multi-alignment of ZPR-type sequences
from eight different angiosperm species (Aquilegia coerulea (Ac),
Amborella trichopoda (Amtr), A. thaliana (At), Daucus carota (Dc), Medicago truncatula (Mt), Oryza sativa (Os), Populus trichocarpa (Pt), S. lycopersicum (Sl) and Sorghum bicolor (Sb)). At least one
ZPR2-type and one ZPR3-ZPR2-type sequence was identified in all species that we considered. All ZPR2-type proteins have a Cys residue at the second
position of the N-terminal domain. Amino acid position is displayed on top of each alignment, using A. thaliana ZPR2 as a reference. b, Molecular phylogenetic analysis by the maximum likelihood method. The tree with the highest log-likelihood (−1,500.12) is shown. The percentage of trees in which the associated taxa clustered together is shown next to the branches. The tree is drawn to scale, with branch lengths measured in the number of substitutions per site. The analysis involved 28 protein sequences (listed in Supplementary Table 4).
Extended Data Fig. 7 | N-terminal tagging of proteins with a ZPR2 sequence confers degradability by the N-degron pathway. a, Relative
mRNA level of the genotypes used for immunodetection of GFP in Fig. 2d
under aerobic and hypoxic conditions (2% O2), measured by RT–qPCR. Two biological replicates from two independent lines were used in the case of the constructs with wild-type ZPR2 (35S:ZPR2-GFP) and (MAC)
ZPR2-GFP lines. Four biological replicates were instead used in the case
of wild-type ZPR2-GFP in the prt6 background. The effect of hypoxia treatment versus aerobic conditions was evaluated by two-way ANOVA (P value = 0.342, n = 4 pools of 3 plants). The results of the RT–qPCR analysis exclude regulation by hypoxia at the transcriptional level and— combined with the immunoblot analysis—support the existence of a control checkpoint at the post-transcriptional level. b, Relative luciferase activity of a chimeric protein that consists of the whole ZPR2 coding sequence fused to the N terminus of a firefly luciferase (ZPR2-PpLUC). This construct was transfected together with a second one, which bears a Renilla luciferase gene driven by the same 35S CaMV promoter, into
Arabidopsis mesophyll protoplasts. Renilla luciferase activity was used as a
normalization control. One-way ANOVA followed by Tukey post hoc test;
n = 6, 4 and 5 protoplast pools for wild-type ZPR2 (MC-ZPR2), (MAC)
ZPR2 (here MAC-ZPR2) and wild-type ZPR2 in prt6, respectively.
c, Relative GUS activity of a gZPR2-GUS construct expressed in Arabidopsis protoplasts. A 35S:PpLuc reporter was co-transformed to
equalize for transfection efficiency. The addition of an Ala residue before the Cys2 led to enhanced stability of both reporter constructs, and the expression of the wild-type ZPR2 protein fusions in the prt6 mutant background also showed enhanced protein abundance. One-way ANOVA followed by Tukey post hoc test; n = 8, 5 and 6 protoplast pools for wild-type ZPR2, (MAC)ZPR2 and wild-wild-type ZPR2 in prt6, respectively.
d, Quantification of the relative staining intensity of GUS-stained plants
that express a pZPR2:ZPR2-GUS construct at 2%, 21% and 80% O2. An example of GUS staining at each oxygen concentration is shown in Fig. 3b. Images of GUS-stained plants were converted to inverted greyscale images, and the staining intensity was measured using ImageJ. Wild-type plants that were de-stained in ethanol were used to correct for the background signal. Average relative staining intensity was calculated by comparing the corrected staining intensity at each O2 concentration by the corrected staining intensity at 21% O2. These results show that ZPR2 stability in the SAM depends on oxygen availability. One-way ANOVA followed by Holm–Sidak post hoc test; n = 10, 7 and 8 plants for 2%, 21% and 80% O2, respectively.
Extended Data Fig. 8 | Loss of ZPR2 expression reduces the leaf initiation rate, and ectopic overexpression of ZPR2 abolishes SAM activity in an oxygen-dependent manner. a, Schematic of the ZPR2
gene, showing the position of two T-DNA insertions (SAIL (Syngenta
Arabidopsis Insertion Library) and GABI-Kat (https://www.gabi-kat.de/)
collections). The relative annealing site of the primers used in b is shown using arrows in the schematic view. b, The homozygous status of T-DNA insertions within the intron of AT3G60890 in the NASC accessions N483079 (zpr2-2, GK-866D03) and N835524 (zpr2-3, Sail_794_D11) was tested by PCR using the combinations of primers indicated in a. Genomic wild-type (Col-0 ecotype) DNA and double-distilled water were used as controls. The experiment was repeated twice with similar results.
c, Amplification of the entire ZPR2 coding sequence in the wild-type, zpr2-2 and zpr2-3 genotypes. The experiment was repeated twice with
similar results. d, Relative expression of ZPR2 in wild type, zpr2-2 and
zpr2-3 measured by RT–qPCR. One-way ANOVA followed by Holm–
Sidak post hoc test; n = 5 pools of 3 plants. e, Progression in leaf number in wild type and zpr2 T-DNA insertion mutants. The number of leaves, including cotyledons, was counted every second day from the emergence of the first pair of true leaves. Data are presented as mean and s.d.; n = 15 plants.
f, Shoot phenotype of wild-type, zpr2-3 and pZPR2:ZPR2-Flag in zpr2-3
plants. At the growth condition used, the rosette of four-week-old zpr2-3 plants was smaller than that of the wild type. g, Leaf initiation rate in wild-type, zpr2-3 and pZPR2:ZPR2-Flag in zpr2-3 plants. One-way ANOVA followed by Dunn’s post hoc test; n = 41, 27, 20 and 19 plants for wild type,
zpr2-3 and zpr2-3 Flag line no. 1 and zpr2-3 pZPR2:ZPR2-Flag line no. 2, respectively. h, Phenotype of wild-type Arabidopsis and 35S:ZPR2-GFP plants grown in plates containing agarized MS
(half-strength) medium supplemented with 10 g l−1 sucrose under aerobic or hypoxic (2% O2) conditions for 20 days, followed by 5 days of recovery in normoxia. 35S:ZPR2-GFP plants often showed termination of meristem activity and the formation of a pin-like structure. The experiment was repeated twice with similar results. i, Percentage of shoot meristem termination (blue) or meristem progression (green) events in wild-type and 35S:ZPR2-GFP plants after five days of recovery from hypoxic growth. The number of plants that displayed either phenotype is reported in white inside the bar. The frequency of SAM termination in 35S:ZPR2-GFP plants increased after hypoxic treatments. A two-tailed Fisher’s exact test was used to compare wild-type and 35S:ZPR2-GFP plants grown in aerobic and hypoxic conditions.
Extended Data Fig. 9 | Repression of HD-ZIP III-target genes by
ZPR2 induction and stabilization occurs in the shoot apex. a, Effect
of ZPR2 and ZPR2–GUS on the transactivation activity of REV on the
ZPR1 promoter. These data indicate that ZPR2 is not able to repress REV
activity when fused with a GUS reporter protein at its C terminus. One-way ANOVA, followed by Holm–Sidak post hoc test; n = 5 protoplast pools. b, Schematic of the construct that provided oestradiol-inducible expression of ZPR2, and after protein stabilization under hypoxic conditions. c, Separate and combined effect of oestradiol (50 μM) application, for 4 h before exposure to 2% O2 for 24 h, on the expression of a GUS reporter under the control of pHEC1 (HECATE 1) and pPSK5 (PHYTOSULFOKINE 5 PRECURSOR) promoters in 6-day-old Arabidopsis seedlings that also expressed an oestradiol-inducible ZPR2 construct. Seeds of these genotypes were obtained as F1 offspring that were
generated by crossing homozygous promoter:GUS lines with homozygous oestradiol-inducible ZPR2 (pMDC7:ZPR2) plants. The observation was repeated twice. A reduction in pPSK5 or pHEC1 activity by combined
ZPR2 induction and hypoxia was observed in a total of 8 out of 12 and
15 out of 20 plants, respectively. d, Effect of oestradiol-mediated induction of ZPR2 and its stabilization by hypoxia on pTAA1:GUS staining in five-day-old wild-type and transgenic pMDC7:ZPR2 plants. Twenty-four hours of hypoxia, but not oestradiol treatment (50 μM), was sufficient to repress
pTAA1-driven GUS expression in the wild-type background, probably
via stabilization of the endogenous ZPR2 protein (2 out of 3 plants). The hypoxia treatment also inhibited expansion of the first pair of true leaves. Stimulated ZPR2 expression in the pMDC7:ZPR2 background further decreased pTAA1:GUS staining (3 out of 3 plants). This experiment was performed once.
Extended Data Fig. 10 | ZPR2 is required to repress HD-ZIP III-target genes. a, The expression of HD-ZIP III-target genes was measured using
RT–qPCR in the apices of one-week-old zpr2-3 mutants and wild-type plants. These results show that the expression of five HD-ZIP III-target genes (PSK5, ATH1, ZPR1, AMP1 and POL) is significantly increased in zpr2-3 insertion mutants. Two-sided t-test; n = 10 plants. b, GUS expression under control of the MAX2 promoter in wild-type and
zpr2-3-background genotypes. Restoration of wild-type background
was obtained by PCR screening (for zpr2-3 insertion) and antibiotic resistance (for the pMAX2:GUS construct) in the F2 offspring of a cross between a pMAX2:GUS zpr2-3 plant and a wild-type (Col-0) plant. The observation was repeated twice. In total, the induction of
pMAX2:GUS-GFP in zpr2-3 mutants was observed in 16 out of 20 plants. c, Hypothetical
model describing how local hypoxia drives SAM activity by regulating HD-ZIP III transcription factors via ZPR2.
1
October 2018
Corresponding author(s): Francesco Licausi, Joost van Dongen
Last updated by author(s): Mar 24, 2019
Reporting Summary
Nature Research wishes to improve the reproducibility of the work that we publish. This form provides structure for consistency and transparency in reporting. For further information on Nature Research policies, see Authors & Referees and the Editorial Policy Checklist.
Statistics
For all statistical analyses, confirm that the following items are present in the figure legend, table legend, main text, or Methods section. n/a Confirmed
The exact sample size (n) for each experimental group/condition, given as a discrete number and unit of measurement
A statement on whether measurements were taken from distinct samples or whether the same sample was measured repeatedly The statistical test(s) used AND whether they are one- or two-sided
Only common tests should be described solely by name; describe more complex techniques in the Methods section.
A description of all covariates tested
A description of any assumptions or corrections, such as tests of normality and adjustment for multiple comparisons
A full description of the statistical parameters including central tendency (e.g. means) or other basic estimates (e.g. regression coefficient) AND variation (e.g. standard deviation) or associated estimates of uncertainty (e.g. confidence intervals)
For null hypothesis testing, the test statistic (e.g. F, t, r) with confidence intervals, effect sizes, degrees of freedom and P value noted
Give P values as exact values whenever suitable.
For Bayesian analysis, information on the choice of priors and Markov chain Monte Carlo settings
For hierarchical and complex designs, identification of the appropriate level for tests and full reporting of outcomes Estimates of effect sizes (e.g. Cohen's d, Pearson's r), indicating how they were calculated
Our web collection on statistics for biologists contains articles on many of the points above.
Software and code
Policy information about availability of computer code
Data collection SensorTrace Suite v3.1.100, Genevestigator, Image Lab Software for Chemidoc
Data analysis LAS X life science software, Blast algorithm, Muscle algorithm, Weblogo 3, Mega 7, Image J, Microsoft Excel 2016
For manuscripts utilizing custom algorithms or software that are central to the research but not yet described in published literature, software must be made available to editors/reviewers.
We strongly encourage code deposition in a community repository (e.g. GitHub). See the Nature Researchguidelines for submitting code & softwarefor further information.
Data
Policy information about availability of data
All manuscripts must include a data availability statement. This statement should provide the following information, where applicable:
- Accession codes, unique identifiers, or web links for publicly available datasets - A list of figures that have associated raw data
- A description of any restrictions on data availability
Accession numbers of all the Arabidopsis genes analysed in this study are listed in the text or figure legends. All numerical Source Data used to generate the graphs displayed in this report are provided as a supplementary excel file. Seeds of transgenic lines used in this study are available from the corresponding authors upon request.
2
October 2018
Field-specific reporting
Please select the one below that is the best fit for your research. If you are not sure, read the appropriate sections before making your selection. Life sciences Behavioural & social sciences Ecological, evolutionary & environmental sciences
For a reference copy of the document with all sections, see nature.com/documents/nr-reporting-summary-flat.pdf
Life sciences study design
All studies must disclose on these points even when the disclosure is negative.
Sample size No sample size calculation was performed. The sample size was chosen based on the funding availability, the possibility of simultaneous processing by the experimenter and taking into consideration the sample size commonly chosen by similar studies by other research groups.
Data exclusions No data were excluded from the analyses.
Replication The conclusions and hypothesis drawn in this study are based on results that could be successfully reproduced at least two times, as indicated in the figure legeds. The effect of inducible ZPR2 on pTAA1 reporter could only be performed once due to limited F1 seed pools.
Randomization Randomisation of plant growth was applied when possible. Randomisation was not used for western blot, biochemical and qPCR assays.
Blinding Investigators were only blinded to group allocation in the following cases: GUS staining assessment, leaf number count.
Reporting for specific materials, systems and methods
We require information from authors about some types of materials, experimental systems and methods used in many studies. Here, indicate whether each material, system or method listed is relevant to your study. If you are not sure if a list item applies to your research, read the appropriate section before selecting a response.
Materials & experimental systems
n/a Involved in the study
Antibodies Eukaryotic cell lines Palaeontology
Animals and other organisms Human research participants Clinical data
Methods
n/a Involved in the study
ChIP-seq Flow cytometry MRI-based neuroimaging
Antibodies
Antibodies used monoclonal anti-GFP distributed by Sigma Aldrich clones 7.1 and 13.1, catalog number 11814460001, lot number unavailable at the time of manuscript submission. Working dilution: 1:1000.
Validation Validation of the antibody for western blotting of A. thaliana extracts has been performed independently by several groups (), including the authors as reported by the supplier (10.1186/gb-2014-15-4-r62, 10.3389/fpls.2017.00163, 10.1093/nar/gkw156). A band corresponding to the expected size of GFP or GFP-tagged proteins was observed in transgenic Arabidopsis plants but not in the wild type. Antibody profile: https://www.labome.com/product/Roche-Applied-Science/11814460001.html