New proposals for EEG and fMRI based
Brain Computer Interface technology
i
Contents
1 Introduction
2 Brain computer interface 2.1 Definition
2.2 BCI architecture 2.3 Signal acquisition
2.3.1 Electroencephalogram
2.3.2 Functional magnetic resonance imaging and other methods for signal acquisition
2.4 Neurophysiologic signals 2.4.1 Event-Related Potentials 2.4.2 Oscillatory activities 2.5 Features extraction 2.5.1 Time Domain 2.5.2 Frequency domain 2.5.3 Spatial domain 2.5.4 Nonlinear methods
ii
3.1 EEG experimental protocol 3.1.1 Analysis strategy
3.1.2 Lyapunov exponent extraction: algorithm implementation
3.1.3 Results and discussions 3.2 fMRI experimental protocol
3.2.1 Functional connectivity between spatially remote brain signal acquired during BCI protocol
3.2.2 Results and discussions 4 Design of BCI applications
4.1 Artistic pattern generation using brain signal 4.2 Controlling a robotic hand using SMR and ERP 4.3 Alternative form of communication for people with
motor disabilities 5 Conclusion
1
C
HAPTER
1
I
NTRODUCTION
One of most important characteristic of humans resides in the ability of communicate mainly through speech, gesturing, or writing. Moreover, in the history of mankind people have been successful in finding other ways of expression like music, painting, sculptures, photography, film, etc. We are living the century of the progress, that changed totally our way to live and to communicate. In particular, recent advances in technology allows also to probe and monitor physiological processes inside the human body, like the blood pressure, the heart rate variability, the muscular activity, and the brain electrical activity in efficient and non invasive ways. Such
2
activities have been already used as information in new communication channels.
The brain computer interface (BCI) technology can be considered a new communication method that provides a direct connection between the brain and an external device. More specifically, the idea underlying BCIs is to detect patterns of brain activity and to link these patterns to commands executed by a computer or other devices. In 2000 Wolpaw et al. defined a BCI as a communication system that does not depend on the normal output pathways of peripheral nerves and muscles [1]. Thus, BCI communication could substantially improve quality of life for people with very little voluntary muscle control or affected by locked-in syndrome. The locked-in syndrome is a condition in which patients are fully conscious and aware of what is happening in their environment but are not able to communicate or move. A disease that is known to lead to the locked-in syndrome is amyotrophic lateral sclerosis (ALS) that is a progressive, neurodegenerative disease and is characterized by the death of motor neurons which in turn leads to the loss of control over voluntary muscles. Also multiple sclerosis, stroke or other cerebral incidents leading to the infarction or
3
degeneration of parts of the brain can cause the locked-in syndrome. BCI is a promising means to give back basic communication abilities and a small degree of autonomy to people with severe motor disabilities. Prototype systems allow, for example, to choose symbols from an alphabet by concentrating on specific mental tasks or to move artificial limbs, solely by imagining movements[2].
Since the first experiments of electroencephalography (EEG) by Hans Berger in 1929 [3], the idea that brain signals could be used as a communication channel has rapidly emerged. The EEG discovery has enabled researchers to measure the human’s brain activity and to start trying to decode this activity. However, it is only in 1973 that the first prototype of a BCI came out, in the laboratory of Dr. Vidal [4]. To date, the modern EEG acquisition devices are relatively inexpensive and easily transportable, and for these reasons and because the setup of recording sessions takes only little time, the EEG is used in many BCI systems.
The first step of the process involved in the development of a BCI system is to measure the signals on the scalp of a subject. The brain signals are then processed according to the particular
4
cerebral waves that the system use (µ, β rhythm, sensory motor rhythms, slow cortical potential, event related potential). Then, a translation algorithm is necessary to convert the brain features extracted into control commands using linear or nonlinear equations. During this step the adaptation of specific parameters is performed with relation to the output device that will be controlled (cursor movement, letter or icon selection, external device control). Furthermore, the BCI system has to provide a feedback for the user that can be visual, haptic or auditory.
An EEG-based BCI has been used in this thesis to evaluate a new method for feature extraction, in particular a new approach based on non linear time series analysis is proposed. The recent progresses in the theory of nonlinear dynamics and complex systems mathematics provide new methods for the study of brain signals [5]. Nonlinearity as a necessary condition for chaotic behaviour is present in many dynamical systems found in nature, including the brain at the cellular level, since the dynamics of individual neurons are governed by threshold and saturation phenomena [6].
5
Nowadays, about one-third of BCI designs have used power-spectral features, so linear methods, because of their ease of application, computational speed and direct interpretation of the results. The goal of my research activity is to improve the potentiality of the classical feature extraction method using a non linear parameter, the Lyapunov exponent, using a fast algorithm proposed by Bucolo et al.[7], particularly suitable for real time processes, thus also for BCI.
Brain computer interface can improve the quality of life not only for people with motor impairment but indirectly also for other categories because BCI are also used for the treatments of medical disorders. A lot of research group use the BCI technology with the purpose to investigate the brain behaviour. For example, patients with attention-deficit and hyperactivity disorder (ADHD) [8] were treated with self regulation of 12– 15 Hz EEG brain activity. Epilepsy patients were trained to suppress epileptic activity by self-regulation of slow cortical potentials (SCP) [9]. If the neurobiological basis of the disorder is known in terms of abnormal activity in a certain region of the brain, functional magnetic resonance image (fMRI) based BCI can be targeted to those regions with greater specificity for
6
treatment. Many types of disorders, namely, memory disorders, chronic pain, motor disorders, psychopathy, social phobia, depression, emotional disturbances, anxiety, and posttraumatic disorder might be treated with fMRI based BCI.
FMRI based BCI is a general system employing real-time fMRI technology that enables various applications including training to self-regulate activity in precisely specified regions of the brain to study plasticity and functional reorganization, application of the knowledge so derived in psychophysiologic treatement, quality assurance of neuroimaging data, presurgical patient assessment and teaching of brain imaging methods [10]. In the context of a self regulation experiment, fMRI based BCI can extract BOLD activity from voxels in one or more regions of interest (ROIs) in the brain to compute average activity in the ROIs, or correlation coefficient of activity between ROIs, or any other function that could be used to provide feedback to the participant. However, fMRI based BCI need not necessarily function based on self-regulation of brain activity alone. There has recently been much progress in the detection and discrimination of mental states using fMRI data [11].
7
In recent years, many imaging studies have focused on defining a network of brain structures involved in the processing of pain. Additionally, it has been shown that stimulus-evoked pain, which is a frequent symptom of neuropathic pain, cause distinct patterns of brain activation [25]. In the present study, an fMRI experimental protocol is analyzed with the purpose to demonstrate that in response to painful stimulation it is possible to regulate activation in the so called pain processing areas, contributing to the research about the cure of patients that suffer of chronic pain.
In this thesis also different EEG-based BCI applications are introduced. The main aim is to provide to people with motor impairment a new way for expressing their feelings. Many of the applications proposed allow to a user to create artistic representation or to compose music.
Some laboratories have already begun to develop BCI systems that provide people with severe motor disabilities an alternative way to express their creativity, thus improving their quality of life. Kübler et al. [12], for example, developed a BCI application that allows screen painting using event related potential (ERP). Another example that shows the possibility of
8
creating recreational and therapeutic devices is proposed by Miranda et al.[13], who introduce an EEG-based BCI to compose and perform music.
This thesis is organized into four chapters. Chapter 2 contains background material, Chapter 3 describes two experimental BCI protocols and the new methods used to analyze the brain signals acquired during an EEG and an fMRI task, Chapter 4 introduce different BCI applications designed and realized in laboratory, and Chapter 5 contains a summary and an outlook on future work. In Chapter 2, a general introduction to the field of BCI research is given. Topics reviewed include different methods for measuring brain activity, the types of neurophysiologic signals that can be used in BCI systems, algorithms for extracting useful features from neurophysiologic signals, and BCI applications. This chapter provides an overview particularly on those methods that mainly are relevant in the context of the thesis. In section 2.3, electroencephalogram (EEG) and functional magnetic resonance imaging (fMRI) techniques for brain signals acquisition are introduced more in detail respect to the other techniques like electrocorticogram (ECoG),
9
magnetoencephalogram (MEG) or magnetic resonance imaging (MRI). Section 2.4 deals with two different approach for the discrimination of neurophysiologic signals. The first approach concerns the changes in brain signals resulting from perception and processing of stimuli. In the second one users control their brain activity by concentrating on a specific mental task, for example imagination of hand movement can be used to modify activity in the motor cortex. In BCIs after the data acquisition phase, the features extraction module allows to transform raw neurophysiologic signals into control commands for different kind of applications. For this purpose the temporal, frequency and spatial domain processing methods for features extraction in BCIs are discussed in section 2.5, with particular attention on non linear methods like Lyapunov exponent extraction.
In Chapter 3, two experimental configurations are introduced. For the first protocol the user performs a sensory motor task imaging to move the left or right hand in relation to an arrow displayed on a screen. A new approach based on nonlinear time series analysis to extract EEG signals features is proposed. In particular a fast algorithm that computes the largest Lyapunov
10
exponent was used. The results obtained reveal the capability and the potentiality of this method in respect to the classical approach. The second configuration is related to an fMRI based BCI protocol. The oxygenation level-dependent (BOLD) effects in pain processing areas in response to painful stimulation is investigated . Functional connectivity between spatially remote brain signals is computed with the aim to demonstrate the possibility for a subject to regulate the BOLD trend.
In Chapter 4, three different kinds of applications designed are described in details. For the first one the experimental setup of a BCI system that allows to a user to control a robotic hand using event related potentials and sensory motor rhythms is introduced. The second application consists on an interactive system that allows to create luminous artistic representation. In particular the images shown refer to the paths of light that the user creates controlling two twin robots through his sensory motor rhythms. Finally, three applications that provide alternative form of communication for people with motor disabilities are described. The setup and configuration of the
11
music composer, painting and writing application are documented separately.
In Chapter 5 the contributions of this thesis are summarized and an outlook on possible extensions of the presented work is provided.
12
C
HAPTER
2
B
RAIN
C
OMPUTER
I
NTERFACE
2.1 DEFINITION
In the last decades the analysis of the brain signals, as a valid diagnostic approach in neurology, has roused a growing interest. Particularly in the eighties for the first time the analysis of cerebral waves has been used in a research contexts for the design of human machine interfaces (HMI). Among these it is included the brain computer interface (BCI) [1] that
13
provides a direct connection between the brain and an external device, through the analysis of brain signals acquired from multiple electrodes placed on the scalp of a subject.
In 2000 Wolpaw et al. defined a brain-computer interface as a communication system that does not depend on the normal output pathways of peripheral nerves and muscles [14]. In other words a BCI can be an alternative method, specially for subjects affected by particular diseases, for acting on the world. The principal reason for interest in BCI development is the possibilities it can offers for providing new augmentative communication technology to those who are paralyzed or have severe motor disabilities. With this aim, over the past three decade, many laboratories have begun to design BCI application. The firsts implemented brain wave controlled tasks as the spelling [15], allowing to a subject to select letters of the alphabet, and cursor movement control [16], have increased the attention toward this technology. Some significant examples are controlling a wheelchair on established paths using thought [17] or applications in home automation and domotics [18]-[19]. To date a wide range of BCI systems have been designed
14
also for other purposes like the development of interactive platform used on video game console [20].
The BCI technology can be classified in two categories, independent and dependent. Independent BCIs provide the brain with wholly new output pathways without using the normal pathways of peripheral nerves and muscles. Dependent BCIs are of lower theoretical interest than independent one because normal channel of communication like extra ocular muscles and cranial nerves are also used. Thus, for people with the most severe neuromuscular disabilities, who may lack all normal output channels, independent BCIs are likely to be more useful.
Successful BCI operation requires that the user develop and maintain a new strategy of communication, a strategy that consists not of proper muscle control but rather of proper control of specific electrophysiological signals, and it also requires that the BCI translate that control into output that accomplishes the user’s intent.
Detailed reports about the work in many BCI laboratories around the world can be found in the 2006 BCI special issue of IEEE Transactions on Neural Systems and Rehabilitation
15
Engineering [21]. Other reviews can be found in the articles of Wolpaw et al. [14], Lebedev and Nicolelis [22], Birbaumer and Cohen [23], and Mason et al. [24].
2.2 BCI ARCHITECTURE
A control system has input, output, components that translate input into output, and a protocol that determines the onset, offset, and timing of operation. In the case of a BCI the input are the brain signals that are recorded, processed in real-time and translated into control commands, the output, that operate external devices or a computer display. Figure 1 shows these elements and their principal interactions.
16
Figure 1 - Building blocks of a BCI. A subject performs a specific
cognitive task or concentrates on a specific stimulus. Brain signals are acquired and then processed with signal processing and translation algorithms. The outcome of the translation is fed into an application, for example a spelling device, or an external device. The application generates feedback to inform the subject about the outcome of translation.
Research areas include evaluation of all blocks. For the brain signals acquisitions, different aspects and methods have been investigated: invasive and non invasive technologies, different types of electrodes, the sampling rate, the methods for measuring brain activity. In particular, in this thesis we focus on non invasive EEG and fMRI as the measurement technologies. A preprocessing is needed for cleaning and denoising input data in order to enhance the relevant information embedded in the signals [28]. Feature extraction and translation are processes that can be performed by using different linear or nonlinear signals processing and classification methods [1]. The classification step assigns a class to a set of features extracted from the signals [29]. This class corresponds to the kind of mental state identified. In
17
addition, being the brain signals unique for each subject, an adaptation algorithm is needed to optimize the performance of BCI processes in relation to each user. Once the mental state is identified, a command is associated to this mental state in order to control a given application such as a speller or a robot [27]. Then, as for the brain’s normal neuromuscular output channels, a BCI depends on feedback and on adaptation of brain activity based on that feedback, which can be visual, haptic, or auditory.
EEG signals are highly subject-specific and for this reason BCI systems must be calibrated and adapted to each user. A considerable calibration work is necessary to have an efficient BCI system. This work is generally done offline and aims at calibrating the classification algorithm, calibrating and selecting the optimal features, selecting the relevant sensors, etc. In order to do so, a training data set must have been
recorded previously while the user perform each mental task of interest several times, according to given instructions. The recorded EEG signals will be used as mental state examples in order to find the best calibration parameters for this subject.
18
Thus, the BCI operation depends on the interaction of two adaptive controllers: the user’s brain, which produces the signals measured by the BCI; and the BCI itself, which translates these signals into specific commands.
2.3 SIGNAL ACQUISITION
Different methods to measure brain activity can be used in a BCI. In 1929 the neuropsychiatric Hans Berger recorded for the first time the brain's spontaneous electrical activity [3]. Since then the development of the electroencephalography (EEG) led to the birth of other important methods for acquiring brain signals/imaging like the magnetoencephalography (MEG), that is the technique for measuring the magnetic fields produced by electrical activity in the brain; the functional magnetic resonance imaging (fMRI); or tomographic imaging technique like SPECT and PET. Each method has its own advantages and disadvantages. Depending on the needs and on the willingness of the user one of the methods will be choose for acquiring the brain signal for designing a BCI. Clearly, the
19
development of new methods for measuring brain activity has the potential to yield advanced BCI systems.
In the following paragraphs an overview of EEG and fMRI technique is presented.
2.3.1 Electroencephalogram
The most widely used non invasive techniques for measuring electrical brain activity is probably the electroencephalogram (EEG). Since its discovery the EEG has been employed to answer many different questions about the functioning of the human brain and has served as a diagnostic tool in clinical practice.
The EEG technique consists in the measure of the potentials on the scalp surface caused by the extracellular currents that flow towards the region of the synapse [30].
The EEG signal acquisition method give a best temporal resolution compared to the other neuroimaging techniques like fMRI, SPECT and PET. Moreover the devices required to the EEG are less unmanageable with respect to the other methods
20
(MEG, fMRI, SPECT, PET), that typically monopolize a whole room. The EEG required devices are simple and cheap and the preparation of measurements takes only a small amount of time. EEG signals are recorded with small silver/silver chloride electrodes with a radius of about 5mm, placed on the scalp at standardized positions, like the 10-20 international system (see Fig. 2). Conductive gel or saltwater is used to improve the conductivity between scalp and electrodes. To affix the electrodes to the scalp, often an electrode cap is used. EEG signals are always recorded with respect to reference electrodes, i.e. EEG signals are small potential differences (0 - 100 µV) between electrodes placed at different positions on the scalp. The reference is needed because provides a baseline against which the activity at each of the other electrodes can compared. The reference electrode must not cover muscles, because its contractions are induced by electrical signals, for this reason usually is placed at the mastoid bone which is located behind the ear. The other electrodes are placed following a standardized system. Over the right hemisphere electrodes are labeled with even numbers. Odd numbers are used for those on the left hemisphere. Those on the midline are
21
labeled with a z. The capital letters stands for the location of the electrode (C=central, F=frontal, Fp= frontal pole, O= occipital, P= parietal and T= temporal).
Figure 2 - Electrode placement according to the 10-20 international system.
Odd numbers indicate electrodes located on the left side of the head. Even numbers indicate electrodes located on the right side of the head. Capital letters are used to reference each cortical zone, namely frontal (F), central (C), parietal (P), temporal (T), and occipital (O). Fp and A stand for frontal pole and auricular. The designation 10-20 comes from the percentage ratio of the inter-electrode distances with respect to the nasion-inion distance.
When all the electrodes are placed at the right position the electrical potential can be measured. According to a person’s state the frequency and the shape of the EEG signal change. If
22
a person is awake beta activity can be recognized, which means that the frequency is relatively fast. The alpha activity, which have a slower frequency, can be noted before that a person falls asleep. The slowest frequencies are called delta activity, which occur during sleep.
An important aspect of an EEG based BCI is the presence of artifacts that can invalidate the information deriving from the brain signals. Artefacts often have much larger amplitude than the signals of interest, thus the artefacts removal and filtering procedures have to be applied online before an analysis of EEG signals can be attempted. Artefacts can be due to physiological or non physiologic sources. Physiological sources for artefacts include eye movements and eye blinks, muscle activity, heart activity, and slow potential drifts due to transpiration. Non physiologic sources for artefacts include power supply line noise (at 50 Hz or 60 Hz), noise generated by the EEG amplifier, and noise generated by sudden changes in the properties of the electrode-scalp interface.
EEG is used in many BCI systems because modern acquisition devices are relatively inexpensive and easily transportable and because the setup of recording sessions takes only little time.
23
Moreover EEG method allows to measure electric potentials of the brain at a temporal resolution on the order of milliseconds.
2.3.2 Functional magnetic resonance imaging and other methods for signal acquisition
The functional magnetic resonance (fMRI) imaging is a non invasive test that measure the metabolic changes that take place in an active part of the brain, in other words this method allows to detect the brain areas which are involved in a task, a process or an emotion. This method is a MRI-based neuroimaging technique. MRI is based on a physics phenomenon, called nuclear magnetic resonance (NMR), which was discovered in1930s by Felix Bloch (working at Stanford University) and Edward Purcell (from Harvard University). In this resonance, magnetic fields and radio waves cause atoms to give off tiny radio signals.
The fMRI brain mapping is done by setting up an MRI scanner in a special way so that the increased blood flow to the activated areas of the brain shows up on functional MRI scans.
24
The first MRI equipment in health were available at the beginning of the 1980s. In 2002, approximately 22000 MRI scanners were in use worldwide, and more than 60 million MRI examinations were performed. MRI uses a powerful magnetic field, radio frequency pulses and a computer to produce detailed pictures of organs, soft tissues, bone and virtually all other internal body structures. The images can then be examined on a computer monitor. Detailed MR images allow physicians to better evaluate various parts of the body and determine the presence of certain diseases that may not be assessed adequately with other imaging methods such as x-ray, ultrasound or computed tomography.
The fMRI cannot detect absolute activity of brain regions. It can only detect difference of brain activity between several conditions. Functional MRI allows to noninvasively measure the so called blood oxygen level dependent (BOLD) signal. The BOLD signal does not directly represent neuronal activation but rather depends on the level of oxygenated and deoxygenated hemoglobin and on the hemodynamic response to neuronal activation. The peak of the BOLD signal is typically very broad and observed four to five seconds after the
25
neuronal activation (Fig.3). Compared to MRI, fMRI does not depend on contrast agents although contrast agents enable far greater detection sensitivity than BOLD signal. Higher BOLD signal intensities arise from decreases in the concentration of deoxygenated hemoglobin.
Figure 3 - Simulated neural response to a single stimulus.
During the fMRI acquisitions the patient is asked to alternatively perform several tasks or is stimulated to trigger several processes or emotions. Each of these conditions is
26
repeated several times and can be separated by rest periods. The combination of these conditions is called a functional MRI paradigm. The stimuli are usually audio-visual but can involve more complex systems (odors, tastes, etc.). An fMRI experiment usually lasts 1-2 hours. The subject will lie in the magnet and a particular form of stimulation will be set up and MRI images of the subject's brain are taken. In the first step a high resolution single scan is taken. This is used later as a background for highlighting the brain areas which were activated by the stimulus. In the next step a series of low
resolution scans are taken over time, for example, 150 scans, one every 5 seconds. For some of these scans, the stimulus will be presented, and for some of the scans, the stimulus will be absent. The brain images in the two cases can be compared, to see which parts of the brain were activated by the stimulus. The analysis is done using a series of tools which correct distortions in the images, remove the effect of the subject moving their head during the experiment. Then to generate a functional map from fMRI data set, signal intensities of images obtained during control and stimulation periods are compared on a voxel-by-voxel basis. Voxels passing a statistical
27
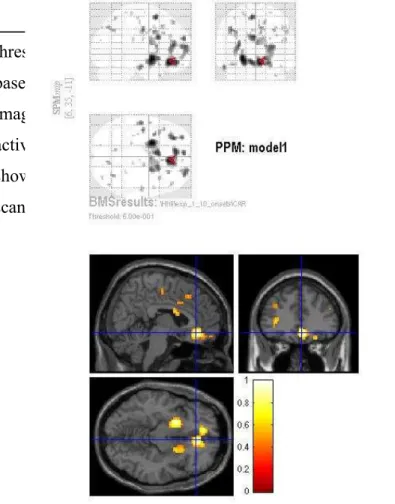
threshold are considered to be active, and then are color-coded based on statistical values such as t values. The final statistical image shows up bright in those parts of the brain which were activated by this experiment. These activated areas are then shown as colored blobs on top of the original high resolution scan (see Fig .4). This image can also be rendered in 3D.
Figure 4 - Examples of the activation maps produced by the software
package SPM[31]. The colour scale (from red to yellow) represents the percentage signal change observed in that region.
28
Functional MRI is becoming the diagnostic method of choice for learning how a normal, diseased or injured brain is working, as well as for assessing the potential risks of surgery or other invasive treatments of the brain. In BCI research fMRI has been used in basic proof of concept systems [32]-[33] and to elucidate the brain mechanisms underlying successful self regulation of brain activity [34] To date, the use in practical BCI systems is not so diffused because fMRI devices are technically demanding, expensive and cannot be easily moved from one place to another.
The spatial resolution of fMRI is very good, structures of the size of a few millimetres can be localized with the fMRI. In addition, signals can be acquired from the whole brain and not only from the cortex, as for example with the EEG. The
temporal resolution is relatively low when compared to methods that directly measure electrical brain activity. Therefore, some research groups are working around this issue by combining fMRI with data collection techniques such as EEG or magnetoencephalography (MEG), which have much higher temporal resolution but rather poorer spatial resolution.
29
2.4 NEUROPHYSIOLOGIC SIGNALS
The goal of an ideal BCI system is to directly detect every wish or intention of its user and perform the corresponding action. However, it is very difficult to clearly define how wishes or intentions are related to neurophysiologic signals. The users have to acquire conscious control over their brain, in some cases learning to focus the attention in particular events like the presence of some stimuli and in other cases performing training sessions. Consequently, some features of particular neurophysiologic signals are used to interpret the intentions of a subject. In BCI systems two fundamentally different approaches exist to achieve the goal of translating wishes in action . In the first approach subjects perceive a set of stimuli displayed by the BCI system and can control their brain activity by focusing onto one specific stimulus. The changes in neurophysiologic signals resulting from perception and processing of stimuli are termed event-related potentials (ERPs). In the second approach users control their brain activity by concentrating on a specific mental task, for example
30
imagination of hand movement can be used to modify activity in the motor cortex. In this approach feedback signals are often used to let subjects learn the production of easily detectable patterns of neurophysiologic signals. The types of signals resulting from concentration on mental tasks together with the corresponding BCI paradigms are called oscillatory activity that can be classified depending on the frequency bands. The most commonly oscillatory activity involved in BCI are the sensory motor rhythm (SMR) that occur during motor tasks and even motor imagery in the frequency range of 8–32 Hz. In the following paragraphs the attention is focused mainly on a wave named P300, a positive deflection in the EEG that appears approximately 300 ms after the presentation of a stimulus, and on the oscillatory activity that occur during motor imagery task, the SMR.
2.4.1 Event-Related Potentials
Event-related potentials are voltage fluctuations that are associated in time with some physical or mental occurrence, for example after the presentation of a stimulus, before execution
31
of a movement, or after the detection of a novel stimulus. These potentials can be recorded from the human scalp and extracted from the ongoing electroencephalogram by means of filtering and signal averaging. Because the temporal resolution of these measurements is on the order of milliseconds, ERPs can accurately measure when processing activities take place in the human brain. Traditionally, ERPs are recorded with the EEG and have been used in neuroscience for studying the different stages of perception, cognition, and action. Event-related potentials can be divided into two classes. Exogenous ERPs are the result of early, automatic processing of stimuli and the features of this signals depends mainly on the physical stimulus characteristics. The motor-related potentials (MRPs) are exogenous ERPS and are independent of the perception or processing of stimuli. The events to which MRPs are related are the preparation or imagination of movements. MRPs are slow negative potentials, observable over the sensorimotor cortex before movement onset or during movement imagination. MRPs have been also used in combination with sensorimotor rhythms in a BCI based on motor imagery [35].
32
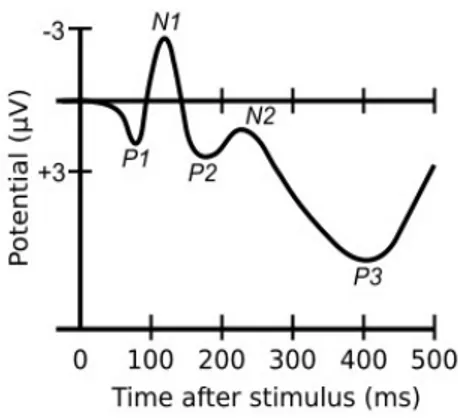
Endogenous ERPs are the result of later, more conscious processing of stimuli and have characteristics that depend mainly on the stimulus context, i.e. on the task the subject was given and on the attention the subject pays to the stimuli. The P300 is an endogenous ERP that has gained much attention in the neuroscientific and medical research. The name of this particular signal denotes the positive deflection in the EEG, appearing approximately 300 ms after the presentation of rare or surprising, task-relevant stimuli [36]. Furthermore, different components of ERPs can be observed, for example positive deflection after 200 ms and negative one after 100 ms, as shown in figure 5. The P300 reflects high-level processing of stimuli and for this reason in BCI systems is favorite respect to the other ERP components that reflect low-level, automatic processing of stimuli.
33
Figure 5 - Typical P300 wave. The P300 (or P3) is a positive deflection in
the EEG, which appears approximately 300 ms after the presentation of a rare or surprising stimulus. A series of negative and positive components (N1, P2, N2) precedes the P3. While the P3 reflects high-level processing of stimuli, the earlier components reflect low-level, automatic processing of stimuli.
To evoke the P300, subjects are asked to observe a random sequence of two types of stimuli. One stimulus type (the oddball or target stimulus) appears only rarely in the sequence, while the other stimulus type (the normal or nontarget stimulus) appears more often. Farwell and Donchin on 1988 for the first time exploited the P300, observed after visual stimulations, in a BCI system [37]. They described the P300
34
speller which allows to a subject to select desired letter just observing a matrix containing symbols from the alphabet displayed on a screen. Rows and columns of the matrix are flashed in random order, and flashes of the row or column containing the desired symbol constitute the oddball stimulus, while all other flashes constitute non target stimuli.
The use of ERPs is particularly suitable for subjects with concentration problems or for subjects not willing to go through a long training phase because no user training is necessary. Indeed, ERPs occur as a natural response of the brain to stimulation, and this is an important advantage. A disadvantage is that communication depends on the presentation and perception of stimuli. Subjects are thus required to have remaining cognitive abilities. Moreover, BCI systems based on ERPs have only limited application scenarios because a device to present stimuli is needed and because users need to pay attention to stimuli, even in the presence of other unrelated, distracting stimuli.
In the present thesis the P300 waves are used for designing some application described in chapter 4.
35
2.4.2 Oscillatory activity
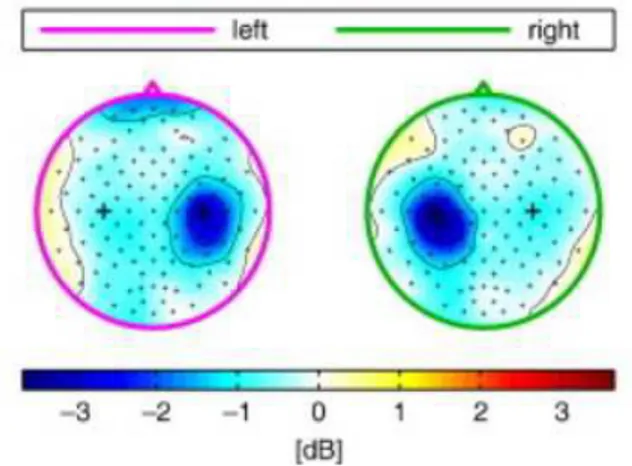
Sinusoid like oscillatory brain activity occurs in many regions of the brain and changes according to the state of subjects. Oscillation in particular frequency bands could play a key role in the emergence of memories, emotions, thoughts, and actions. Typically observable oscillatory activity in the EEG are the delta (1 - 4 Hz), theta (4 -8 Hz), alpha and mu (8 - 13 Hz)1, beta (13 - 25 Hz), and gamma (25 - 40 Hz) rhythms. The changes in power of specific bandwidths is used as control signals for BCI systems. In particular, sensorimotor rhythms (SMR) are specific oscillations in the frequency range of 8–32 Hz that occur during motor tasks and even motor imagery and can be observed over the sensorimotor cortex also when a subject does not perform movements. These oscillations are decreased in amplitude when movements of body parts are imagined or performed. Imagination of movement of the left hand corresponds to a decrease in SMR amplitude over the right sensorimotor cortex, whereas imagination of movement of the right hand corresponds to a decrease in amplitude over
36
the left sensorimotor cortex. Figure 6 shows the activated brain regions during a motor imagery task.
Figure 6- Brain areas that are active during a motor imagery task. If the
user thinks to move the left hand a decrease in SMR amplitude can be noticed over the right sensorimotor cortex and the contrary for the imagination of the right hand movement.
Feedback training has to be used to let users acquire control over sensorimotor rhythms because the changes in SMR occurring in untrained users are usually not strong enough to be detected by a classification algorithm. Thus the training that subjects have to perform is a disadvantage also because it can
37
take several weeks before users are able to reliably control a BCI. Therefore, BCI systems based on oscillatory activity might be less suited for subjects with concentration problems or for subjects who are not willing to go through a long training phase. But if oscillatory activity are used, more flexible BCI systems can be imagined, in respect to the systems that use the ERP, because no computer screen or other device is needed to present stimuli. The research group of Pfurtscheller in Austria [38] introduced important studies about BCI systems employing imagined movements of hands, feet, or tongue. The group of Wolpaw in the United States has also worked on such systems, and an impressive sensorimotor rhythm BCI allowing for fast control of a 2D cursor has been described by Wolpaw and McFarland [16]. Many other groups have performed research on testing sensorimotor rhythm interfaces with severely handicapped subjects [39].
2.5 FEATURES EXTRACTION
In the previous section we have discussed paradigms that let users control their brain activity. In a BCI the neurophysiologic
38
signals are acquired and translated into control command. To allow the control of external devices the brain waves have to be classified for the discrimination of different classes of signals. In many cases the first step for classification of neurophysiologic signals is to acquire labeled training data. Thus, the subject has to perform prescribed actions, while neurophysiologic signals are recorded and afterwards analyzed to learn the desired mapping from signals to classes.
After the data acquisition phase, significant features are extracted from the raw brain signals with the aim to transform the neurophysiologic signals into a representation that makes classification easy. In other words, the goal of feature extraction is to remove noise and other unnecessary information from the input signals, while at the same time retaining information that is important to discriminate different classes of signals. Another, related, goal of feature extraction is to reduce the dimensionality of the data that has to be classified.
In this section we only review some methods for feature extraction in BCIs. To achieve the goals of feature extraction, neurophysiologic a priori knowledge about the characteristics
39
of the signals in the temporal, the frequency, and the spatial domain is necessary. Depending on the type of signals to be classified this knowledge can take many different forms. A more exhaustive review of feature extraction methods for BCIs can be found in [28]. To date, nonlinear methods for signals analysis are also used in many research context and in this thesis the extraction of a nonlinear parameter is proposed for BCI.
2.5.1 Time Domain
The presentation of particular stimuli or the actions of the user of a BCI system cause changes in the amplitude of neurophysiologic signals in the time domain, at specific time interval. P300 and MRPs are signals that can be characterized with the help of time domain features. A strategy that is often used to separate these signals from background activity and noise is lowpass or bandpass filtering, optionally followed by downsampling. Indeed, most of the energy of the P300, SCPs, and MRPs is concentrated at low frequencies. Lowpass
40
filtering, together with downsampling thus allows to remove unimportant information from high frequency bands. In addition, the dimensionality of the signals is reduced. Examples for systems in which filtering and downsampling have been employed are the P300 BCI described by Sellers and Donchin [40] and the system for classification of MRPs described by Blankertz et al. [41].
An alternative to filtering is to use the wavelet transform of the signals. Systems based on the discrete wavelet transform (DWT), as well as systems based on the continuous wavelet transform (CWT) have been described in the literature. An example for the use of the DWT is the P300-based BCI system described by Donchin et al. [42].
Besides the use for the EEG signals P300 and MRP, time domain features are also used in BCI systems based on microelectrode arrays, that is an invasive technique for recording activity from single neurons or from small groups of neurons.
41
2.5.2 Frequency domain
Frequency domain features are related to changes in oscillatory activity. Such changes can be evoked by presentation of stimuli or by concentration of the user on a specific mental task. Since the phase of oscillatory activity is usually not time-locked to the presentation of stimuli or to actions of the user, time domain feature extraction techniques cannot be used. Instead, feature extraction techniques that are invariant to the exact temporal evolution of signals have to be used. The most commonly used frequency domain features are related to changes in the amplitude of oscillatory activity. For example in systems based on motor imagery, the band power in the mu and beta frequency bands at electrodes located over the sensorimotor cortex is used as a feature.
During specific tasks the synchronization between signals from different brain regions can occur and might indicate that these regions communicate. This characteristic can be considered a second type of frequency domain features. The communication between the brain regions permits to discriminate different signals features for different cognitive tasks. The use of
42
synchronization features in combination with band power features was explored by Gysels and Celka [43] in a BCI based on the cognitive tasks like the left and right hand movement or the composition of words. Also Brunner et al. [44] used synchronization features in combination with band power features in BCI based on other cognitive tasks. In both studies the combining synchronization and band power features led to classification accuracy that was superior to that obtained with only synchronization or band power.
2.5.3 Spatial domain
Generally the feature extraction techniques described above use data from only one electrode, the synchronization features are an exception that are extracted from bivariate time series. In many systems however, data from more than one electrode is available. The goal of spatial feature extraction methods is to find efficient combinations of features from more than one electrode.
43
When a user perform a cognitive task some changes occur in specific brain regions. The changes in band power, P300 peaks, or other features are usually stronger at electrodes over brain regions that are related to specific cognitive task. Thus, for performing spatial feature extraction method only electrodes that carry useful information for a particular task is used. A spatial feature extraction consists in applying spatial filtering algorithms before further processing takes place. Spatial filtering corresponds to building linear combinations of the signals measured at several electrodes. Denoting by s(t)∈ RE
the signal from E electrodes at time t, spatial filtering can be expressed as sˆ(t)=Cs(t). Here the F × E matrix C contains the coefficients for F spatial filters and the vector
F
R t
sˆ( )∈ contains the spatially filtered signals at time t. To determine the filter coefficients different methods can be used. For example for motor imagery based BCIs, it has been shown that spatial filtering with a Laplacian filter can increase performance [45]. Simple Laplacian filters can be built by subtracting the mean signal of the surrounding electrodes from the signal of each electrode. Applying a Laplacian filter
44
corresponds to spatial high-pass filtering, focal activity which is characteristic for motor imagery tasks is thus enhanced. In other methods for spatial feature extraction, filter coefficients are computed from a set of training data. An
algorithm which is very popular in the area of motor imagery based BCI systems is the common spatial patterns (CSP) algorithm [46]. The CSP algorithm determines spatial filters that maximize the temporal variance of data recorded under one condition and minimize the temporal variance of data recorded under a second condition.
Another method for computing the coefficients of spatial filters from training data is independent component analysis (ICA). In ICA algorithms it is assumed that a set of multichannel signals s(t) is generated by linearly mixing a set of source signals x(t): s(t) = Mx(t).
The goal is to compute a matrix F that allows one to reconstruct the source signals x by multiplying s with F. To achieve this without having information about M, one assumes that the source signals are statistically independent. The ICA algorithm thus computes F such that the signals s(t) multiplied with F are maximally independent. In the case of EEG signals,
45
the idea underlying the application of ICA is that the signals measured on the scalp are a linear and instantaneous mixture of signals from independent sources in the cortex, deeper brain structures, and noise [47]. ICA has been mainly used in P300-based BCIs as a feature extraction method. In such systems ICA is used to separate multichannel EEG into several components, corresponding to sources in the brain or noise, for example from eye blinks. By retaining only components that have a P300 like spatial distribution or show P300 like waveforms, the signal to noise ratio can be improved.
2.5.4 Nonlinear methods
Nonlinear time series analysis focuses on methodologies that distinguish chaotic signals from noise, and how properties of chaos can be used to model and classify dynamical systems [48]. The analysis of nonlinear dynamics has a fundamental role for studying magnetoencephalography (MEG), electroencephalography (EEG) and other brain signals with the purpose of characterizing, for example, normal resting activity
46
[49] and pathological states [50]-[51]. Different nonlinear parameters are investigate in literature like the maximum Lyapunov exponent, the asymptotic distance, the entropy, the Higuchi dimension, the detrended fluctuation analysis.
To date, the Lyapunov exponent calculation ( λ) have been applied to a wide range of biological and biomedical phenomena. One of the biggest areas of interest has been in analyzing functional brain activity (i.e., EEG or MEG) with the aim to detect early the disease onset. Stam, for instance, suggests that the most promising potential clinical applications appear to be in identifying and predicting epileptic seizures and sleep disorders [51]. Another area where Lyapunov exponent calculations have been applied extensively is in analyzing the heart rate variability, so in the electrocardiography (ECG) analysis. In this area Perkiomaki presented an interesting review [52].
The nonlinear behaviour of time series is characterized by successive phenomena of stretching and folding. It is important to note that, while λ is only sensitive to the stretching mechanism, another non linear parameters, the asymptotic distance, is sensitive to both the stretching and the folding
47
mechanisms. Also the evolution of the asymptotic distance
∞
d [53]-[54] has been studied in literature for characterizing
nonlinear dynamics in the six experimental datasets. One of the method for evaluating d is the implementation introduced by ∞
Sapuppo that is computationally less onerous then the conventional methods [48].
Another important indicator used for non linear analyses is the entropy. It has been introduced by Pincus to quantify the regularity of a sequence [55]. He demonstrates that a larger value of entropy correspond to more irregularity in the data. Hornero suggests that nonlinear analysis techniques could be useful in Alzheimer’s disease diagnosis [50]. The results of his work show that EEG and MEG background activities in Alzheimer’s disease patients are less complex and more regular than in healthy control subjects.
The fractal dimension is a nonlinear parameter that quantify the complexity and the self similarity of a time series. This indicator can be computed using various algorithms for example that proposed by Higuchi [56].
In recent year also the detrended fluctuation analysis (DFA) method [57] has become a widely-used technique for providing
48
a simple quantitative parameter to represent the correlation properties of a signal [58]-[59]. In the biomedical context, it has successfully been applied to diverse fields such as DNA sequences, neuron spiking, human gait, and heart rate dynamics [57]-[60]-[61]
Since the first nonlinear EEG studies [5] several steps forward have been done, and the nonlinear analysis of EEG has been widely used for diagnosis of neurovegetative pathologies. For example in Alzheimer's Disease a lower value of correlation dimension, maximum Lyapunov exponent and sample entropy, than in healthy control subjects have been found. In addition, Daly analyzed the performance of the Wackermann parameters in the classification of single-trial ERP responses [62] for BCI. In this thesis the Lyapunov exponent has been extracted from brain signals acquired during a motor imagery task in a BCI system.
In mathematics the Lyapunov exponent or Lyapunov characteristic exponent of a dynamical system is a quantity that characterizes the rate of separation of infinitesimally close trajectories, thus quantize the sensitivity to initial conditions.
49
Given a chaotic system, two trajectories starting from very close randomly chosen initial conditions will diverge exponentially at a rate given by the largest Lyapunov exponent [63]-[64]. Thus, the largest Lyapunov exponent can be defined using the following equation where δ(t) is the average divergence at time t and C is a constant that normalizes the initial separation: t Ce t) 1 ( λ δ = (1)
When plotting ln|δ(t)| versus t, the result is a curve that is close to a straight line with a positive slope of λ, indeed:
t C
t) ln 1
(
lnδ = +λ (2)
The curve is never exactly straight. It has wiggles because the strength of the exponential divergence varies somewhat along the attractor. The exponential divergence must stop when the separation is comparable to the “diameter” of the attractor – the trajectories obviously can’t get any farther apart than that. This explains the leveling off or saturation of the curve in Figure 7. The value of saturation is the parameter d∞.
50
Figure 7 - Example of divergence curve.
The number λ is often called the Lyapunov Exponent although actually n different Lyapunov exponents exist for a n-dimensional system. This value coincided with the largest Lyapunov exponent. Moreover λ depends on which trajectory is studied, thus the true value of λ is obtained by averaging over many different points on the same trajectory.
Given a time series a direct method to calculate the largest Lyapunov exponent λmax is thought the formula of the
prediction error between very close trajectory [5]. Here it is reported the formula used in the TISEAN software for the calculation of λmax [65]-[5]:
51
∑
= + + − − = N n n nn k nn k n s y y y y Nt 1 max 1 ln λ (3)where ynn is the nearest neighbour of yn, ts is the sampling time
and N is the time series length. The Lyapunov exponents are fully representative of the sensitivity to initial condition (stretching phase) of a given nonlinear dynamical system, being positive for chaotic behaviours [66]. Often it is sufficient to establish the existence of at least one positive Lyapunov exponent to define chaotic dynamics [26].
52
C
HAPTER
3
E
XPERIMENTAL PROTOCOLS AND
RESULTS ANALYSIS
3.1 EEG EXPERIMENTAL PROTOCOL
Signal processing and classification methods are essential tools in the improvement of Brain Computer Interface technology. In this thesis a new approach based on nonlinear time series analysis to extract EEG signals features is proposed. In
53
particular a fast algorithm that computes the largest Lyapunov exponent was used. This signal processing approach was tested offline considering three sessions of imaginary motor tasks. The results obtained reveal the capability and the potentiality of this method in respect to the classical approach [77].
Dataset1 -14 electrodes Dataset2 -16 electrodes Dataset3 -16 electrodes 1-Training session 60s 1-Training session 60s 1-Training session 60s 2-Training session 60s 2-Training session 60s 2-Training session 60s 3-Training session 60s 3-Training session 60s 3-Training session 60s
Table 1 - Experimental data sets over a three-day time period.
For our experiment the user, without any muscular involvement, modifies his neuronal activity in the primary sensory-motor areas performing a motor imagery task. During the training session, the computer screen is either blank, or displaying an arrow pointing left or right. The two different stimuli appear for several times in a random sequence. Depending on the direction of the arrow, the subject is instructed to imagine a movement of the left hand or of the
54
right hand. If the screen was blank the user is instructed to have a rest. The same task was performed three times in three
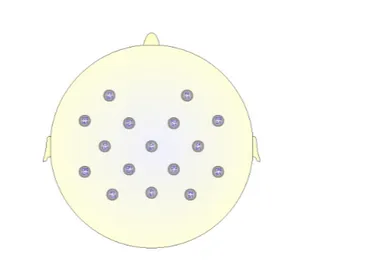
different days by an healthy right-handed subject (female, aged 28 years) who wore a EEG cap with integrated electrodes. The EEG potentials were recorded using two channels configuration: for the first session the signals was acquired at 14 locations (FC5, FC1, FC2, FC6, C3, Cz, C4, CP5, CP1, CP2, CP6, T7, Pz and T8) and for the second and third sessions at 16 locations (replacing T7 and T8 with P3, P4, F3 and F4) sites in the standard 10-20 System and digitized at 2000 Hz. This change has been decided to have augmentative information after a first view of the results obtained for the first trial.
55
Figure 8 - Electrodes configuration used for the experiment. 16 channels
positioned according to the international 10-20 system.
3.1.1 Analysis strategy
For this thesis different tools have been used to analyze the brain signal acquired from the user that performs an imagery movement protocol. The BCI2000 software has been used for data acquisition, stimulus presentation and brain monitoring applications. Moreover, BCI2000 allows us to convert the measured brain signals in a format suitable for MATLAB analysis. The BCI2000 software tool has been implemented by
56
Schalk et al. [66] with the purpose to facilitate the research and the applications on brain computer interaction. The BCI2000 is a general-purpose system for brain-computer interface and it is available for free for non-profit research and educational purposes. It consists of four modules that communicate with each other: source (data acquisition and storage), signal processing, user application, and operator interface. The modules communicate through a protocol based on TCP/IP, thus each one can be written in any programming language and can be run on any machine.
The brain signal recorded using the BCI2000 have been then elaborated with MATLAB software. The MATLAB language has been used for programming the algorithm that allowed us to obtain the results discussed in section 3.1.3. The signals acquired during all the training sessions were filtered in six different bands: delta (1-4 Hz), theta (4-8 Hz), alpha (8-12 Hz), beta I (12-16 Hz), beta II (16-20 Hz), and gamma (20-49 Hz. In each band and for all the channels the power and the Lyapunov exponent ( λ) were computed. The DivA algorithm introduced by Bucolo et al. has been used for computing the λ parameter. Different set of data were extracted depending on the stimulus:
57
the imagination of the right hand, the imagination of the left hand or the resting phase. Then, the correlation coefficient V [67] associated with the two conditions, Left (LA) and Right (RA) arms imaginary movement versus rest phase (RP) were evaluated The total variance was calculated according to the following expression:
∑
= − = n x x n V 1 2 ) ( 1 µ (4)where x and m are the amplitude and the average value of the EEG signal for a specific channel and n is the number of
samples (in our experiments, n = 200). This measure provides a way to select the frequency band and locations where the EEG signals are more influenced by the task (left and right arm imagery).
58
3.1.2 Lyapunov exponent extraction: algorithm implementation
For our experiment DivA, an alternative methodology for the extraction of the asymptotic distance and of the Lyapunov exponent λ was used [7]. This implementation results to be computationally less onerous than the conventional ones, since it is not based on the time-delay embedding concept and also no intermediate computational steps are needed to obtain the final result being particularly suitable for real time analysis. Let us assume that x denotes a k-dimensional vector, and consider the dynamical system specified by the discrete map:
) (
1 n
n G x
x + = (5)
Let us consider N couples of trajectories starting from two nearby points separated by a small distance h0, xi xi0
) ( 0 − ' £ h: 0 ) ( 0() ) ( i n i j G x x = ( '(0)) ) ( ' i n i j G x x = (6)
Averaging the N couples of trajectories, the mean distance between trajectories after j iteration can be defined as:
59
∑
= − = N i i j i j j x x N d 1 ) ( ' ) ( 1 (7)where the |•| operator denotes the usual norm. The dj
asymptotic value is defined as:
∑
= ∞ → ∞ = n j j n n d d 1 1 lim (8)It is well known that, after n iterations, the map of the time diverging distance can be expressed as:
n n n
n e d e d d
d +1 = λ 0 = λ =Λ (9)
where λ is the Lyapunov exponent of system. After a sufficiently large number of iterations, the folding process takes place to keep the trajectories bound in the phase space. To take this phenomenon into account, the (9) can be considered as a first order expansion of d∞ and, in the hypothesis that d n<1 for any n, it includes a second order
correction term representing the folding action:
2
1 n n
n d d
60 The fixed points of (10) are:
0
* =
d and d**= d¥ = L- 1
G (11)
The characteristic values describing the evolution of nearby trajectories are Λ, Γ, and d ∞, although only two of these are
actually needed because of the relationship (11).
The aim of DivA algorithm, given a signal s(t) (i.e. given a time series), is to compute the divergence (dj) among
trajectories xi.
The algorithm starts with the choice by the operator of an initial condition x0(0) and a distance h0, which identifies a small
range [(x0- h0/2), (x0+ h0/2)] that generally depends on the
resolution of the signal s(t) and on the number of trajectories found. Then, points whose y-coordinate belongs to the range [(x0- h0/2), (x0+ h0/2)], are extracted; these points represent a
set of candidate to become starting points of the algorithm in relation to the equation (6). The first starting point found is assumed to be x *≡x0(0), this point will be used as reference
point for the following steps.
61
in x*. Among the points in the set of the candidate starting points, only those whose derivative meets constrain (12) will represent the final set of starting points from which trajectories will be calculated. )) ( var( ' ) ( 0 ) 0 ( 0 x p s t x& − & i = ⋅ (12) Parameter p in (12) is the slope ratio and is chosen, by user empirically, small enough so that pairs of trajectories that have a different initial slope are discarded, thus decreasing the number of trajectories for the calculation of the d j, but not too
strict so that a sufficient number of trajectories, respecting the requirement on the range and the initial slope, can be extracted. The term var(s’) represents the variance of the derivative of signal s(t).The constrain on the slope has been introduced in order to collect all points having the same properties in the zero order and first order dynamics.
By means of the above described steps, set of starting points is found: X=(x0(i), i=0,…n). Each point x0(i) identifies a trajectory
made up of all the samples in the range: [x0(i),(x0(i)+lenght_trj1)], where length_trj is the length of the
62
them is computed, both the stretching and the folding effects are taken into account, and the asymptotic behaviour of the system can be studied. Moreover, all the combinations among points x0(i) will be considered, discarding those couples whose
distance (in samples) is inferior to the parameter minimum
trajectories delay (tdmin), and their differences will be
computed thus obtaining dj.
The d∞, representing the asymptotic value of dj, is then
extracted and used as a parameter for characterizing the nonlinear dynamics of the system. Moreover, from the computed curve dj, the maximum Lyapunov exponent can be
extracted as the initial slope of the curve. This extraction can be computed in different ways, polynomial fit, custom equation fit or in empiric way. This last method is the one used in this thesis. The slope is simply computed considering the straight line joining the first occurrence of the lowest value with the first value settle around the asymptotic value of dj.
63
3.1.3 Results and discussions
The signals acquired during all the training sessions were filtered and the power and λ were computed. Then, the correlation coefficients associated with the two conditions, Left (LA) and Right (RA) arms imaginary movement versus rest phase(RP) were evaluated.
As it is expected from previous well-known results, according to the International 10-20 System, the evolution of the power in gamma band, reveals that imagination of hands or arms movement cause a radial current flow in the sensory-motor area close to the positions C3 or C4, respectively associated with the right and the left arms [68] (see Fig.11). Figure 9 plots the space-frequency map of the correlation coefficient (r) for λ, it is possible to distinguish in the gamma-band a higher level of sensitivity during the LA imaginary activity in the electrode C4 (6) and during the RA in C3 (13).
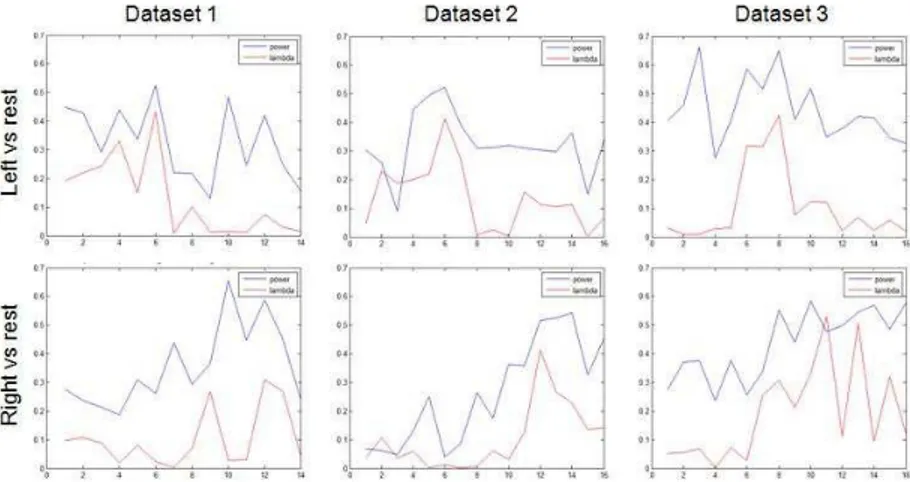
The same conclusion can be drawn considering Fig.10 where for each dataset the r-value for both power (blue line) and λ (red line) in gamma band versus the channels have been taken
64
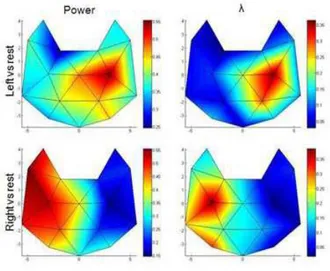
into account. In addition Fig. 11 shows for both parameters the head maps of the r-value averaging the dataset 2 and 3. The first row of pictures is referred to the LA activity and the second to the RA.
Figure 9: Space-frequency map of the correlation coefficient for λ, the first
image on the left reports the LA versus rest and the second image on the right the RA versus rest.
These results could lead to investigate on the potentiality of this new parameter to drive a BCI system. In this direction first of all a series of statistical comparisons were performed, to confirm the attitude of this feature to characterize LA-RA activity:
-between λ in C4 during LA and RA (n1 = n2 = 45, t = 4,1 and p = 0,0071%);
65
-between λ in C3 during LA and RA (n1 = n2 = 45, t = -2,9 and p = 0,42%);
-between λ in C4 and in all the other channels during the LA (n1 = 45, n2 = 645, t = 3,8 and p = 0,012%);
-between λ in C3 and in all the other channels during the RA (n1 = 45, n2 = 645, t = 1,7 and p = 8%);
where t=t-test value, n1 and n2=samples size, and p=probability of observing a value as extreme or more extreme than the obtained t-value. The rejection of the null hypothesis at the 5% significance level has been confirmed in the first three cases, meanwhile in the last comparison is required the 8%. In this contest considering the size of the sample n1 and n2 a power of about 60% can be assumed.
From these results it is possible to confirm the previous analysis and further more can be enhanced the attitudes of the subject investigated to an higher level of brain wave control during the LA than the RA. For both tests involving channel C4 bigger t values were obtained.
To point out on the parameter sensitivity the indicator D=maxleft-maxright has been evaluated, where maxleft and maxright are the maximum r value of the signal recorded from