1
UNIVERSITY OF MESSINA
PH.D. COURSE IN “SURGICAL AND MEDICAL BIOTECHNOLOGIES” XXXIII CYCLE
(COORDINATOR: PROF. GIOVANNI SQUADRITO)
AQUAPORIN-1 EXPRESSION AS PREDICTIVE MARKER OF CHEMO-RESISTANCE IN OVARIAN HIGH-GRADE SEROUS CARCINOMA: A COMPARATIVE STUDY BETWEEN PREOPERATIVE PERITONEAL BIOPSIES AND SURGICAL SAMPLES
Ph.D. Candidate: Dr. Giuseppe Angelico
Supervisor:
Prof. Antonio Ieni
______________________________
2 INDEX
1. Epithelial ovarian cancer
1.1. Epidemiology and risk factors
1.2. Pathogenesis and molecular subgroups 1.3 High-Grade Serous Carcinomas
1.3.1 Gross features 1.3.2 Histopathology
1.3.3 Neoplastic dissemination
1.3.4 Clinical presentation, Diagnosis and Staging 1.3.5 Treatment strategies
1.3.6 Pathological chemotherapy response score (CRS)
1.4. Aquaporin 1 (AQP1) role in carcinogenesis, tumor progression and metastasis
2. Aims of the study 3. Materials and methods
3.1. Patient Selection and Clinical Data 3.2. Pathology Evaluation
3.3. Immunohistochemistry 3.4. Statistical analysis
4. Results
4.1. Patients baseline characteristics 4.2 AQP1 Immunohistochemistry
4.3 AQP1 and omental chemotherapy response 4.4 AQP1 and clinico-pathological characteristics
5. Discussion 6. Conclusion
7. Declaration of interests 9. References
3
1. Epithelial ovarian cancer
Epithelial ovarian cancer (EOC) represent the most lethal gynaecological malignancy,
being the fifth cause of female related cancer death, with an estimated total of 225,500
diagnosed each year [1,2]. Its incidence and mortality are constantly increasing, mainly
because the majority of women are diagnosed in advanced stage [1, 2].
In fact, most EOC cases are detected at International Federation of Gynecology and Obstetrics
(FIGO) stage IIIC or IV. Most patients relapse within the first 5 years of the initial treatment,
and only 20%–25% patients are effectively cured [1-5].
The two main prognostic indicators are FIGO stage at diagnosis and size of residual disease
after surgery. Poor survival rates are partly the result of late stage at presentation, many
patients being stage III–IV at diagnosis [1-5].
From a pathological point of view, EOC are subdivided into serous, mucinous, endometrioid,
clear cell, transitional cell, squamous, mixed epithelial and undifferentiated types. Except for
squamous and undifferentiated tumors, there are benign, borderline, and malignant
subcategories within all of these categories [6].
1.1. Epidemiology and risk factors
Like other epithelial malignancies, EOC is more frequently diagnosed more in older
women, with a median age of diagnosis is at 63 years, therefore, as global life-expectancies
continue to increase, the number of newly diagnosed cases is expected to improve [1,7].
The higher incidence rates are observed in Northern and Central/Eastern Europe; intermediate
incidence rates are observed in North America, Western Europe and Australia; and lower
incidence rates in Asia and Africa [1, 2, 7].
Regarding the most relevant risk factors, a heritable component related to genetic factors, has
4
observed in women with an affected first-degree mainly due to germline mutations in the
tumour-suppressor genes BRCA1 and BRCA2, also related to increased risk of developing
breast cancer in these same relatives [7,8]. Overall, 10–20% of EOCs arise as a consequence
of these germline BRCA1 and BRCA2 mutations. BRCA-related EOCs, usually present at an
earlier age and are usually high-grade serous carcinomas [7,8].
However, in BRCA1/2 wild-type population, many other genes play an important
pathogenetic role, these include BRIP1, RAD1C, RAD1D BARD1, CHEK2, MRE11A,
RAD50, PALB2 and ATM, all involved in the homologous recombination (HR)-mediated
pathway of DNA repair [9-11].
Mutations in genes involved in DNA mismatch repair, mainly observed in women with Lynch
syndrome are also related to an increased risk of EOCs, mainly clear-cell and endometrioid
subtypes [1].
Regarding non-genetic related risk factors, endometriosis is the main clinical condition related
to an increased risk of developing EOC, particularly clear-cell and endometrioid subtypes,
which are known to arise from endometriotic cysts [1].
Other potential risk factors include the number of ovulatory cycles, nulliparity, obesity,
diabetes, smoking and usage of perineal talc [1].
1.2. Pathogenesis and molecular subgroups
According to the most accepted pathogenetic model of ovarian cancer, the fallopian
tube represents the primary site of origin for incidentally detected high-grade serous
carcinomas (HGSCs), both in women with BRCA mutations or the general population [5-7].
Moreover, to fully understand the origin of EOC, the following pathogenetic concepts must
5
1. A subset of well to moderately differentiated tumors, mainly endometrioid, clear cell,
mucinous, borderline and low-grade serous subtypes, are thought to arise from the ovarian
cortex, probably from cortical inclusions or endometriosis [6, 12,13].
2. A second subset of tumors, which represent the most common subtypes, are regarded as
high-grade müllerian carcinomas [1,6,12,13]. These neoplasms are all related to TP53
mutations; defects in DNA repair and germ-line mutation in either BRCA1 or BRCA2 also
contribute to their pathogenesis. Tumors previously diagnosed as high-grade endometrioid
and transitional carcinomas that contain TP53 mutations are now regarded as morphological
variants of high-grade serous carcinoma (HGSC): SET variant (solid, endometrioid-like, or
transitional).
The origin of “classic-type” HGSCs seem is closely related to the distal fallopian tube, since
about 75% of cases show a concomitant serous tubal intraepithelial carcinoma (STIC).
On the other hand, the SET group is associated with an STIC in 25% of cases.
Other possible sites of origin include the ovarian parenchyma, endometriosis, adenofibromas,
peritoneal or ovarian surface epithelium.
3. Peritoneal surface is thought to represent the site of origin of a small subset of EOCs,
mainly borderline serous tumors and endometrioid carcinomas. The most probable sites of
origin are represented by müllerian inclusions (endosalpingiosis or endometriosis)
[1,6,12,13].
Regarding the molecular Pathogenesis of EOC, in recent years their molecular signatures
have been increasingly refined, permitting investigators to uncover pathways and biomarkers
that distinguish the individual groups and provide both pathogenetic information as well as
potential diagnostic and therapeutic targets [1,13]. The most relevant molecular pathways in
6 1.3 High-Grade Serous Carcinoma (HGSC)
HGSCs account for about 80% of ovarian carcinomas and are most commonly
observed in the postmenopausal age groups, with a mean age at presentation of 56 years [1].
Their clinical manifestations are usually related to an ovarian mass or abdominal swelling.
HGSCs account for almost 90% of stage III and IV ovarian tumors. In fact, only 16% of
tumors are stage I, with 11% stage II, 55% stage III, and 18% stage IV [1,2].
1.3.1 Gross features
The macroscopic appearance of HGSCs is similar to other types of poorly
differentiated ovarian tumors, ranging from cystic and papillary tumors to entirely solid
masses, which involve both ovaries in about two-thirds of all cases [1,6]. On rare occasions
the tumor is entirely exophytic presenting with patches or hard plaques on the ovarian surface.
1.3.2 Histopathology
On microscopic examination, HGSC typically display a solid growth of cells with
slit-like fenestrations. Other frequently encountered growth patterns include papillary (fibrous
papillae and micropapillae), nested, glandular, cribiform and single cells pattern [1,6,13]. In
some areas, the tumor architecture is closely reminiscent of the surface epithelium of the
fallopian tube. These patterns are often admixed and accompanied by areas of extensive
necrosis. HGSCs which simulate the appearance of endometrioid or transitional cell
carcinoma are now referred as SET (“Solid, pseudo-Endometrioid and/or Transitional cell
carcinoma-like”) tumours [1,6,13]. It has been shown that SET tumours are frequently
associated with BRCA1 mutations and contain an increased number of tumour-infiltrating
lymphocytes compared to classical HGSC [1,6,13].
The neoplastic cells of HGSC are characterized by high-grade nuclear atypia with large,
7
nucleoli [1,6,13]. The mitotic index is often elevated, exceeding 12 mitoses/10 high power
fields. Stromal concentric calcifications referred as psammoma bodies, are also frequently
encountered.
The most reliable immunohistochemical markers to support the diagnosis of HGSOC are
represented by PAX8, a marker indicative of Müllerian origin, WT1, P16 and Cytokeratin 7
[1,6,13]. Most cases also show nuclear stain for estrogen and progesterone receptors.
Missense mutations in TP53, typical of HGSOC, are usually correlated with positive
immunohistochemical staining for p53, which is diffuse and present in >75%of neoplastic
cells. If, the gene contains a nonsense mutation, the resultant staining pattern would be almost
totally negative and is referred as “null-type” pattern [14].
1.3.3 Neoplastic dissemination
Rather than metastasizing through blood or lymphatic drainage, HGSC typically
spreads by direct extension in the peritoneal cavity involving all organs and structures it
encounters [1]. Moreover, neoplastic cells have the ability to exfoliate from the primary
tumour, either singly or in clusters, and spread in the peritoneal fluid implanting to distant
organs or tissues, which develop secondary neoplastic nodules [1].
The omentum represents the most common site of neoplastic dissemination, although every
organ or structure within the peritoneal cavity may be involved [1].
Despite neoplastic spread outside the peritoneal cavity is uncommon, certain extra-peritoneal
sites are frequently involved in advanced stages, these include pelvic and/or para-aortic lymph
nodes, liver, spleen, and the diaphragmatic barrier including the pleural space [1].
Advanced stage patients frequently develop neoplastic ascites secondary to obstruction of the
lymphatic drainage by tumor growth or to the secretion of vasoactive and angiogenic factors
8 1.3.4 Clinical presentation, Diagnosis and Staging
The majority of HGSC cases are diagnosed with late stage disease since there are no
effective screening strategies for the diagnosis of ovarian cancer at early stage [1].
Genetic screenings are useful to detect BRCA mutations in patients with a family history of
breast and ovarian cancer. In these patients, a prophylactic surgery such as bilateral
salpingo-oophorectomy, may be an effective strategy to significantly reduce the risk of developing
EOC [1,11].
The clinical presentation of HGSC is often nonspecific; the most common symptoms include
abdominal pain, nausea, constipation, anorexia, diarrhoea and acid reflux [1]. Other
symptoms include fatigue, back pain, tenesmus, as well as elevated urinary frequency [1].
If case of suspected EOC, the patient will undergo a pelvic and rectovaginal examination
along with transvaginal or abdominal ultrasonography, CT or MRI and measurement of
CA125 blood levels [1].
Peritoneal carcinomatosis with the accumulation of large volumes of ascites is usually
observed in advanced disease. In these cases, laparoscopic surgery can be performed to obtain
a bioptic tumour sample essential for the diagnosis and the staging of the disease [1].
In fact, the 2014 FIGO staging system is based on the degree of disease dissemination at
diagnosis. At stage I, the cancer is confined to the ovaries or fallopian tubes; stage II disease
includes neoplastic spread to other pelvic organs including the uterus; stage III involves tumor
spread within the peritoneal cavity beyond the pelvis; stage IV disease includes tumor spread
beyond the peritoneal cavity (inguinal and other extra-abdominal lymph nodes, spleen, liver
or lung) [15].
9 1.3.5 Treatment strategies
Primary debulking surgery (PDS) with adjuvant taxane-platinum chemotherapy represents
the standard treatment for advanced ovarian cancer [1,3-5]. Complete gross tumor resection is
the main goal of PDS and represents the most reliable predictor of clinical outcome.
The chemotherapy protocol, based on the use of platinating agents, is referred as
“platinum-based therapy”. This represents the therapeutic standard of care for ovarian cancer patients and is the same irrespective of the EOC subtype involved.
In detail, the actual treatment protocol consists of 75 mg/m2 cisplatin intravenous infusion,
plus 135 mg/m2 paclitaxel infused over 24 h every 3 weeks for a total of 6 cycles [1,3-5].
Neoadjuvant chemotherapy (NACT) with platinum-containing agents followed by interval
debulking surgery (IDS) represents an alternative treatment strategy, especially for patients
that are too ill to undergo surgical cytoreduction or for patients with advanced disease for
whom complete resection is impossible. In these cases, patients undergo 3 cycles of
chemotherapy, followed by surgical cytoreduction and lastly 3 cycles of chemotherapy
[1,3-5].
NACT has been increasingly used to treat women with advanced stage EOC given the
favourable results observed in two randomized controlled phase III trials which demonstrated
similar progression-free survival (PFS) and overall survival (OS) after neoadjuvant
chemotherapy and interval debulking surgery compared with surgery alone [1,3-5].
In detail, The European Organization for Research and Treatment of Cancer-National Cancer
Institute of Canada Clinical Trials Group (EORTC-NCIC) randomized trial reported a median
progression-free survival (PFS) and OS of 12 and 29 months for the PDS group and 12 and 30
months for the NACT group, respectively [4]. Similarly, the CHORUS trial, reported a
median PFS and OS of 11 and 23 months for the PDS group and 12 and 24 months for the
10
1.3.6 Pathological chemotherapy response score (CRS)
NACT followed by IDS provides an opportunity to establish a pathological tumor
response score to chemotherapy [1,3-5]. Several validated scoring systems have been reported
in solid tumors including breast, esophageal, gastric and rectal cancers and are essential to
guide treatment decisions after surgery [16-19].
In EOC, it is well known that the histopathological assessment of NACT response represents
the most important prognostic tool to establish the rate of complete citoreductive surgery and
to predict patient outcome [20-27].
Currently, the chemotherapy response score (CRS) system proposed by Böhm et al., is
considered the most reliable histopathological grading system for assessing NACT response
in OC [20-27].
Specifically, it consists of a three-tier CRS based on the evaluation of omental residual
disease, which shows a good correlation with progression-free survival and overall survival:
Score 1: No or minimal tumor response; Score 2: Partial tumor response; Score 3: Complete
or near-complete response [23].
This scoring system was recently included into the International Collaboration on Cancer
Reporting (ICCR) and the College of American Pathologists (CAP) guidelines for
histopathologic reporting of ovarian carcinoma [24]. Moreover, several studies have validated
the CRS system in external cohorts of EOC patients [20-27].
In a recent study conducted by our group on a large series of EOC patients, we confirmed that
CRS represents a reliable surrogate to early predict patient survival and risk of early relapses
[22].
Moreover, for the first time, we demonstrated the prognostic significance of adnexal CRS,
originally considered by Böhm et al. as less reproducible to score and with no prognostic
11
1.4. Aquaporin 1 (AQP1) role in carcinogenesis, tumor progression and metastasis Despite the considerable advances in the pre-operative diagnosis and treatment
strategies, the majority of OC still recur and develop chemoresistance with poor 5-year
survival [1,2,28]. Therefore, novel prognostic biomarkers are needed to predict the biologic
behaviour and therapeutic response, improving the OC patient’s clinical outcomes. In this
field, some previous studies highlighted the potential role in carcinogenesis, tumor
progression and metastasis development of different cancers by Aquaporin 1 (AQP1), a small
trans-membrane water channel protein [29-42]. Aquaporin (AQP) gene was first identified in
1992 as a water transport channel. Since 1992, 13 AQP genes have been discovered to be
widely expressed in numerous human tissues [29-42]. AQPs play an important role in fluid
homeostasis since their main function is to facilitate passive water transport across the plasma
cell membrane. Several studies have demonstrated that AQPs are also expressed in a variety
of tumor types and are strictly related to different tumor biological functions [29-42].
In this regard, in a recent study performed by our group, we demonstrated the
immunohistochemical expression of AQP1 in a series of malignant pleural mesotheliomas
related to fluoroedenite fibers exposure [33]. In this study, a significantly longer OS was
found in the group with AQP1 overexpression, with delayed recurrences and death for the
disease. By contrast, earlier recurrences and the worst prognoses were encountered in patients
who showed a low immunohistochemical expression of AQP1 [33]. In another study, we also
demonstrated that AQP1 immunoistochemistry can also be performed on pleural effusions
cytological samples where we observed similar prognostic differences in terms of OS and
PFS when comparing AQP1+ and AQP- cases [34].
At the same time, several studies have demonstrated the prognostic role of AQP1 in different
solid tumors including breast cancer, brain tumors, prostate adenocarcinoma, lung
12
However, only few scientific papers have investigated the prognostic role of AQP1
expression in EOC [38-43]. In detail, when ovarian carcinomas were divided by histological
types, low AQP1 expression correlated with poorer prognosis in clear cell variant, while high
AQP1 content has been related to poorer prognosis in mucinous and endometrioid carcinomas
[43].
2. Aims of the study
Consequently, the aim of the present study is to investigate the AQP1
immunohistochemical expression in a series of advanced stage high-grade serous ovarian
carcinoma. We expect to clarify its potential relationship with response to chemotherapy and
with patient’s prognosis in order to verify if AQP1 may be considered an additional useful
biomarker in OC patients.
3. Materials and Methods
The study complied with the Ethical Principles for Medical Research Involving Human
Subjects according to the World Medical Association Declaration of Helsinki; the
non-interventional, retrospective nature of our study did not require any informed consent, even if
a written informed consent has been obtained from each patient before surgical procedures.
The clinical information had been retrieved from the patients’ medical records and pathology reports. Patients’ initials or other personal identifiers did not appear in any image. Finally, all samples were anonymized before histology and immunohistochemistry; therefore, no further
13 3.1 Patient Selection and Clinical Data
A cohort of 32 patients presenting with peritoneal carcinosis documented by
diagnostic peritoneal biopsies, which confirmed the histological diagnosis of high-grade
serous ovarian carcinoma, were included in the study. All patients met the following
additional inclusion criteria: International Federation of Gynecology and Obstetrics (FIGO)
stage IIIC/IV, platinum-based NACT, and complete clinical response after neoadjuvant
chemotherapy: score 0 according to the surgical scoring system for the IDS residual disease
(0, no residual disease; 1, ≤ 1 cm residual disease; 2, >1 cm residual disease; 3, Unknown).
All selected patients, on the basis of clinical, serologic, instrumental data, and/ or
surgical exploration were considered as non-eligible for primary debulking surgery. IDS was
performed either by laparotomy or minimal invasive surgery according to pre-operative
evaluation, preference and experience of surgeons. After surgical procedures, all patients were
routinely evaluated with clinical visits and CT-scan examination after three cycles of NACT
and the IDS was proposed after the third cycle, if there was any evidence of progressive
disease. After concluded initial treatment, the follow-up was scheduled for all patients, every
3–4 months for 2–3 years and successively, every 6 months for the next 3 years.
3.2 Pathology Evaluation
The histological diagnosis of HGSC, which allowed us to include 32 peritoneal biopsies in
our study, was rendered on the basis of the following histopathological and
immonohistochemical criteria:
i) Neoplastic cells growing in solid, papillary, glandular structures with high
grade nuclear atypia, large, hyperchromatic and pleomorphic nuclei
14
iii) Positive immunohistochemical stain for PAX8, WT1, P16 and cytokeratin 7
along with negativity for the following antibodies: cytokeratin 20, CDX2,
GATA3.
iv) Complete absence or nuclear overexpression in >75% of tumor cells for p53;
these immunohistochemical staining patterns are essential to support the
diagnosis of HSOC and denote an underlying TP53 mutation.
The histological CRS following IDS was determined in the omental sites according to the
three-tiered CRS proposed by Böhm et al. [23]. All the omental and ovarian formalin-fixed
paraffin embedded tissue blocks were sectioned at 4–5 μm intervals, stained with
haematoxylin and eosin (H&E) and reviewed by a team of experienced pathologists (GFZ,
AS, GT and GA), who were blind of clinical data and each other results to assign the CRS of
1–3 for the omental samples. Fleiss-Cohen weighted k statistics were used to assess the
concordance rate of CRS in high grade OC. k values between 0 and 0.2 were regarded as no
agreement, between 0.21 and 0.4 as fair agreement, between 0.41 and 0.6 as moderate
agreement, between 0.61 and 0.8 as substantial agreement and between 0.81 and 1 as almost
perfect agreement.
As previously reported, the histological CRS was determined as follows: Score 1: No or
minimal tumor response (mainly viable tumor with no or minimal regression-associated
fibro-inflammatory changes, limited to a few foci; cases in which it is difficult to decide between
regression and tumor-associated desmoplasia or inflammatory cell infiltration); Score 2:
partial tumor response (multifocal or diffuse regression associated fibro-inflammatory
changes, with viable tumor ranging from diffuse sheets, streaks or nodules, to extensive
regression with multifocal but easily identifiable residual tumor; Score 3: Complete or
near-complete response (mainly regression, with few irregularly scattered individual tumor cells or
15
disagreement, slides were jointly discussed by using a double-headed microscope, until
agreement was reached.
3.3 Immunohistochemistry
Additional sections from the most relevant histological samples were cut for
immunohistochemistry.
Tumor tissue biopsies were obtained at first surgery for all cases. Tissue specimens were
fixed in 10% neutral buffered formalin and were paraffin embedded according to standard
procedures. 4-5-micrometer sections of representative blocks from each case were
deparaffinized in xylene, rehydrated, and treated with 3% H2O2 in tris buffered saline (TBS)
for 5 minutes to block endogenous peroxidase activity. Antigen retrieval procedure was
performed by microwave oven heating in citrate buffer (pH 6).
AQP1 immunohistochemistry was evaluated in preoperative peritoneal diagnostic biopsies
from all patients before they received chemotherapy. In this way, we ensured that our
immunohistochemical results were not altered by drug-changes in tissue samples. Four-five
μm thick sections were cut, mounted on xylane-coated slides (Dako, Glostrup, Denmark), stained with hematoxylin and eosin (H&E) and examined using a Zeiss Axioplan light
microscope (Carl Zeiss, Oberkochen, Germany) for a preliminary morphological evaluation,
avoiding the presence of structural alterations. Moreover, on parallel sections, AQP1 (B-11,
Santa Cruz Biotechnology, Santa Cruz, CA, USA; wd of 1:100) was applied using a Ventana
Benchmark immunostainer (Ventana Medical Systems, Inc., Oro Valley, AZ, USA). The
reaction was then visualised with 3-3' diaminobenzidine tetrahydrochloride, and the slides
were counterstained with Mayer's haemalum. Only membrane labelling was considered
specific, and this pattern of labelling was confirmed from 10 high-power (×400) fields (Figure
2A). Positive and negative controls for AQP1 were used to test the specificity of the
immunoreaction. Vascular endothelial cells and non-neoplastic mesothelial cells served as
16
and replaced by non-immune serum or phosphate buffered saline solution (pH 7.6). Finally,
representative photomicrographs were captured using a digital camera (AxioCam MRc5, Carl
Zeiss).
In addition, as elsewhere suggested [33,34], the percentage of immunostained cells was
assessed by semi-quantitative optical analysis according to a four-tiered system (0 = negative;
> 1% to 24% positive cells = focal staining; >25 to <49% positive cells = not uniform
staining; ≥50% positive cells = diffuse staining). Cases showing a value more than >1%, as the median of immunoreactive neoplastic cells, were considered positive for AQP1
expression.
Moreover, for diagnostic purposes, the following IHC stains, supporting the diagnosis of
HGSC were performed: pankeratin cocktail (AE1/AE3, 1:50, Dako, Carpinteria, CA); PAX-8
(polyclonal, 1:100, Protein Tech, Chicago, IL); anti-ERα (Clone 1D5, Dako, ready to use);
anti-PR (clone PgR 1294, Dako, dilution 1:50); WT1 (Clone 6F-H2, Dako, ready to use); p16
(E64H, 1:3 of pre-dilute, Ventana, Tuscon, AZ); anti-p53 (DO-7, pre-dilute, Dako), Ki67
(MIB, pre-dilute, Dako), CK7 (Clone OV-TL 12/30 pre-dilute, Dako); CK20 (Clone Ks20.8,
pre-dilute, Dako); GATA3 (clone EP368 pre-dilute, Dako) and anti-Human CDX2
(EPR2764Y Rabbit Monoclonal, pre-dilute, Roche Ventana Medical System, Inc).
IHC stain results were assessed semiquantitatively as follows: negative (no cells stained),
focal positive (≤ 10% cells stained), patchy (11% to 49% cells stained) and diffusely positive (≥ 50% of cells stained).
3.4 Statistical Analysis
To assess the predictive value of AQP1 for omental residual disease, Fisher exact test
was performed using the SPPS Statistics 23 software (SPSS Inc, USA). Statistical analysis
was carried out by chi‐square test to analyze associations between high and low AQP‐1 expression and clinico-pathological parameters such as age, stage, CRS, and outcome. A P
17
value less than 0.05 was considered statistically significant. The sample size was determined
in order to achieve a power of 0.80, an alpha of 0.05 and the hazard ratio of 2 between the two
groups. Cancer-specific survival analysis was performed using the Kaplan-Meier method, and
for comparison of the survival curves, the Mantel-Cox log-rank test was used.
Progression-free survival was defined as the time elapsed between the date of diagnosis and
evidence of recurrence, as assessed by imaging or clinically, or date of last follow-up. Overall
survival was defined as the time elapsed between the date of diagnosis and death or date of
last censored. Median follow-up was calculated according to the inverted Kaplan-Meier
technique. Overall survival and progression-free survival curves were estimated by the
Kaplan-Meier product limit method and compared by log-rank test. For progression-free
survival and overall survival, Cox proportional hazards models were used to assess treatment
effect at univariate and multivariate analyses.
4. Results
4.1 Patient Baseline Characteristics
A total of 32 women (mean age 62 years, age range 42–86 years) with advanced stage
IIIC-IV ovarian high-grade serous carcinoma treated with neoadjuvant chemotherapy and
interval debulking surgery were identified and included in the study. According to the surgical
scoring system for the IDS residual disease, all patients were considered score 0.
Moreover, 27 patients had stage IIIC disease, and 5 had stage IV disease. In our study cohort,
10, 17, and 5 patients had omental CRS of 1, 2, and 3, respectively. The k value for the CRS
18
All clinico-pathological and immunohistochemical data are analytically summarized in Table
1.
4.2 AQP1 Immunohistochemistry
The immunohistochemical expression of AQP1 was documented by the linear (partial)
and/or circumferential (complete) membranous staining, not exclusively lining the apical
cellular portion of neoplastic elements (Figure 2A). Taking into consideration a cut-off of > 1
% positive tumor cells, 20 (62.5%) cases showed positive AQP1 staining (AQP1+), while 12
(37.5%) cases were considered negative (AQP1-) (Figure 2C). In detail, positive cases were
immunohistochemically scored as follows: diffuse (6 cases), not uniform (4) and focal (10).
4.3 AQP1 and omental chemotherapy response
In our study cohort, 10, 17, and 5 patients had omental CRS of 1, 2, and 3,
respectively.
In the AQP1+ group, the statistical analysis (Fisher exact test) showed a significant
association of AQP1 expression with poor chemotherapy response in omental tissues CRS1-2
(p= 0.0039). In fact, all positive cases showed an omental response score of 1 and 2 (Figure 3
A, B), while a complete response score (CRS3) was never observed (Table 2). By contrast, in
the AQP1- group, 5 cases showed a complete pathological omental response (Figure 3 C,D),
while 7 cases were considered as poor responders (CRS1-2).
4.4 AQP1 and clinico-pathological characteristics
The follow-up of patients ranged from 12 to 60 months (mean follow-up 33,65
months). During the follow-up observation period, nine patients died of the disease, while the
19
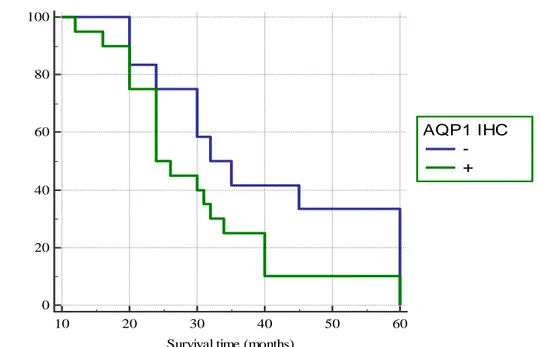
No significant relationship emerged between AQP1 expression and other clinico-pathological
variables; only a statistical trend has been observed for the patient’s age. Among younger
patients (<50aa) we more frequently noted loss of AQP1 expression. Finally, The
Kaplan-Meier survival curves, documenting patient survival times stratified according to the AQP1
immunostaining showed a moderate difference in survival rates between positive and negative
cases. In detail, starting from the initial pathological diagnosis, the AQP1- and AQP1+ groups
showed a median survival time of 32 and 24 months, respectively (p = 0,1012) (Figure 4).
5. Discussion
AQP1 has been investigated in several neoplastic tissues, in which a significant
association between its expression, tumor phenotype and survival outcomes has been
documented [30-43]. In particular, the high AQP1 expression has been associated with poor
prognosis in numerous cancers, including ovarian carcinoma, lung cancer, prostate
adenocarcinoma, brain tumors and breast cancer [30-43]. By contrast, AQP1 high expression
in mesotheliomas is associated with improved survival rates, as elsewhere by us reported
[33-35].
In two previous studies performed by our group, we documented the immunohistochemical
expression of AQP1 in a series of malignant pleural mesotheliomas related to fluoroedenite
fibers exposure [33,34]. AQP1 showed positive immunostain in neoplastic mesothelioma cells
from both histological and cytological samples from pleural effusions. We also demonstrated
a statistically significant association between AQP1 overexpression patient’s survival; in fact,
we observed a mean OS of 26.3 months for patients with >50% AQP1 expression versus a
mean OS of only 8.9 months for patients with <50% AQP1 expression. This relationship
between higher levels of AQP1 in MPM tissues and a better prognosis was quite different to
20
lung adenocarcinoma and carcinomas of the gastrointestinal tract, for which increased levels
of AQP1 are associated with a poorer prognosis [36]. However, similar results have been
observed by other authors when analysing AQP1 expression in malignant mesotheliomas
related to asbestos exposure [35].
Recently, in a gynaecological context, some Authors have immunohistochemically
evaluated the expression of AQP1, 3, 5, and 9 in a total of 300 ovarian carcinomas using
tissue microarrays, by demonstrating that AQPs can be considered useful prognostic markers
in ovarian carcinoma [43]. However, the correlation with prognosis depends on the
histological type of ovarian carcinoma; specifically, high AQP5 expression is related to
poorer prognosis in serous carcinoma, while low AQP1 expression was evident in clear cell
carcinomas with poorer prognosis [43]. Moreover, high AQP1 expression is associated with
poorer prognosis in mucinous and endometrioid carcinomas [43].
Although controversial results are reported concerning AQP1 expression and tumor
progression or metastasis development, only few data are available in the literature regarding
the association between AQP1 and response to chemotherapy [44-46]. Recently, in patients
with stage II–III colorectal cancer treated 5-FU-based adjuvant chemotherapy, positive AQP1
expression was associated with an increased DFS rate compared with that of AQP1-negative
ones [44]; therefore, it has been suggested that AQP1 may be a candidate biomarker
predictive of response to 5-fluorouracil-based adjuvant chemotherapy [44]. Furthermore, in
prostatic adenocarcinoma cell lines, AQP1 was suppressed by ginsenoside Rg3, together with
cell migration [45]. A down-regulation of AQP1 has been reported in lung cancer cell lines
treated by combination therapy of celecoxib and afatinib [37]. Moreover, different subtypes of
AQPs play different roles in ovarian cancer cell in vitro, suggesting thus AQPs might be
associated with chemotherapy sensitivity [46]. In detail, the cisplatin effects were different
between since the expression of AQP1 mRNA decreased significantly, while expression of
21
In the present study, we investigated the immunohistochemical expression of AQP1 in
pre-operative peritoneal samples obtained from advanced stage serous OC. We have shown
that a sub-group of these OC exhibited an evident immunohistochemical AQP1 expression in
comparison to a negative one. Although no relationship between clinico-pathological
parameters and AQP1 has been encountered in our cohort, we have thought to be of interest to
verify if AQP1 expression is able to predict the chemotherapy response following NACT and
IDS. In detail, evaluating the omental tissues chemotherapy response, a significant
association was observed between AQP1 expression and poor chemotherapy response
CRS1-2; in addition, a complete response score (CRS3) was never noted in AQP1+ patients.
Consequently, it may be hypothesized that AQP1 could represent a useful predictive
biomarker of tissue response to platinum-based chemotherapy in patients affected by high
grade serous OC.
Moreover, accordingly to previous observations regarding the relationship between
AQ1 and patient outcome in carcinomas of different sites, such as ovary, lung, prostate, brain
and breast [31-43], we have documented a sensible trend for better survival in patients with
negative AQP1 immunoexpression.
Finally, regarding the pathological assessment of omental residual disease, as expected, CRS
revealed significant prognostic differences in terms of survival time. In detail, the mean OS of
patients with CRS1, 2 and 3 was 26, 32, and 39 months, respectively.
Therefore, our study confirms that complete or near-complete pathologic response assessed in
the omental samples of advanced-stage EOC patients after neoadjuvant chemotherapy is
predictive of better survival. However, the prognostic role of CRS system has been already
validated and confirmed by previous studies, also performed by our group [20-27].
In fact, in a previous study, we already documented significant differences in terms of OS and
PFS according to CRS evaluated in omental samples [22]. In detail, in a cohort of 161 EOC
22
the median OS was 41 and >50 months, respectively. Moreover, we have also found
significant differences between ovarian CRS1 and ovarian CRS2 in terms of OS being the
median OS for ovarian CRS1 patients 41 months vs. a median OS of >50 months observed for
ovarian CRS2 patients. However, no significant differences were observed in terms of PFS
between ovarian CRS1 and CRS2 groups.
Based on all the above-mentioned findings, the combined use of CRS scoring system and
AQP1 immunohistochemistry has the potential to be a surrogate of a more precise prognostic
classification of chemotherapy response, and patient’s survival. In the near future, if our results will be validated on larger series, or if novel prognostic biomarkers will be discovered,
the histological and immunohistochemical evaluation of peritoneal biopsies will allow
clinicians to identify subgroups of patients with different outcomes, with a possible reduction
of the effective number of surgical procedures for good responders.
6. Conclusions
Our data may stimulate future research in expanding the comprehension of
platinum-resistance mechanisms in ovarian cancer, since we retain the water permeability regulation of
AQP1 may play an important role in drug metabolism and drugs chemo-sensitivity as
elsewhere previously reported [35-38].
According to our results, we have demonstrated that high grade serous OC could be classified
in 2 predictive groups on the basis of AQP1 expression at the time of the pre-operative
diagnostic peritoneal biopsy. The first group AQP1+ patients exhibited a poor pathological
response in omental samples, indicating an eligibility for cytoreductive surgery rather than
candidate for NACT. Nevertheless, the results from the present study need to be furtherly
validated on larger cohorts to establish the biological role of AQP1 as well as its clinical
23
7. Declaration of interest
The author has no proprietary, financial, professional or other personal interest of any
nature in any product, service or company. The author alone is responsible for the content and
24
8. References
1. Lisio MA, Fu L, Goyeneche A, Gao ZH, Telleria C. High-Grade Serous Ovarian
Cancer: Basic Sciences, Clinical and Therapeutic Standpoints. Int J Mol Sci.
2019;20(4):952.
2. Siegel RL, Miller KD, Jemal A. Cancer statistics, 2019. CA Cancer J Clin 2019,
69:7-34.
3. Chang S-J, Bristow RE. Evolution of surgical treatment paradigms for advanced-stage
ovarian cancer: redefining 'optimal' residual disease. Gynecol Oncol 2012, 125:483–
92.
4. Vergote I, Tropé CG, Amant F, Kristensen GB, Ehlen T, Johnson N, et al. European
Organization for Research and Treatment of Cancer-Gynaecological Cancer Group;
NCIC Clinical Trials Group. Neoadjuvant chemotherapy or primary surgery in stage
IIIC or IV ovarian cancer. N Engl J Med 2010, 363:943–53.
5. Kehoe S, Hook J, Nankivell M, Jayson GC, Kitchener H, Lopes T, et al. Primary
chemotherapy versus primary surgery for newly diagnosed advanced ovarian cancer
(CHORUS): an open-label, randomised, controlled, non-inferiority trial. Lancet 2015,
386:249–57.
6. Prat J, D'Angelo E, Espinosa I. Ovarian carcinomas: at least five different diseases
with distinct histological features and molecular genetics. Hum Pathol. 2018;80:11-27.
7. Webb, P.M.; Jordan, S.J. Epidemiology of epithelial ovarian cancer. Best Pract. Res.
Clin. Obstet. Gynaecol. 2017, 41, 3–14.
8. Stratton, J.F.; Pharoah, P.; Smith, S.K.; Easton, D.; Ponder, B.A. A systematic review
and meta-analysis of family history and risk of ovarian cancer. Br. J. Obstet.
25
9. Song, H.; Dicks, E.; Ramus, S.J.; Tyrer, J.P.; Intermaggio, M.P.; Hayward, J.; et al.
Contribution of Germline Mutations in the RAD51B, RAD51C and RAD51D Genes
to Ovarian Cancer in the Population. J. Clin. Oncol. 2015, 33, 2901–2907.
10. Ramus, S.J.; Song, H.; Dicks, E.; Tyrer, J.P.; Rosenthal, A.N.; Intermaggio, M.P.; et
al. Germline Mutations in the BRIP1, BARD1, PALB2 and NBN Genes in Women
with Ovarian Cancer. J. Natl. Cancer Inst. 2015, 107, djv214.
11. Norquist, B.M.; Harrell, M.I.; Brady, M.F.; Walsh, T.; Lee, M.K.; Gulsuner, S.; et al.
Inherited Mutations in Women with Ovarian Carcinoma. JAMA Oncol. 2016, 2, 482–
490.
12. Kindelberger DW, Lee Y, Miron A, et al. Intraepithelial carcinoma of the fimbria and
pelvic serous carcinoma: Evidence for a causal relationship. Am J Surg Pathol.
2007;31(2):161-169.
13. Gilks CB, Prat J. Ovarian carcinoma pathology and genetics: recent advances. Hum
Pathol. 2009;40(9):1213-1223.
14. Köbel M, Ronnett BM, Singh N, Soslow RA, Gilks CB, McCluggage WG.
Interpretation of P53 Immunohistochemistry in Endometrial Carcinomas: Toward
Increased Reproducibility. Int J Gynecol Pathol. 2019;38 Suppl 1(Iss 1 Suppl
1):S123-S131.
15. Javadi S, Ganeshan DM, Qayyum A, Iyer RB, Bhosale P. Ovarian Cancer, the Revised
FIGO Staging System, and the Role of Imaging. AJR Am J Roentgenol.
2016;206(6):1351-1360.
16. Best LMJ, Mughal M, Gurusamy KS, et al. Non-surgical versus surgical treatment for
oesophageal cancer. Cochrane Database Syst Rev 2016;85.
17. Sammour T, Price BA, Krause KJ, et al. Nonoperative management or 'watch and
wait' for rectal cancer with complete clinical response after neoadjuvant
26
18. Ryan JE, Warrier SK, Lynch AC, et al. Assessing pathological complete response to
neoadjuvant chemoradiotherapy in locally advanced rectal cancer: a systematic
review. Colorectal Dis 2015;17:849–61.
19. von Minckwitz G, Untch M, Blohmer J-U, et al. Definition and impact of pathologic
complete response on prognosis after neoadjuvant chemotherapy in various intrinsic
breast cancer subtypes. J Clin Oncol 2012;30:1796–804.
20. Petrillo M, Zannoni GF, Tortorella L, Pedone Anchora L, Salutari V, Ercoli A,
Margariti PA, Scambia G, Fagotti A. Prognostic role and predictors of complete
pathologic response to neoadjuvant chemotherapy in primary unresectable ovarian
cancer. Am J Obstet Gynecol 2014, 211:632.e1-8.
21. Cohen PA, Powell A, Böhm S, Gilks CB, Stewart CJR, Meniawy TM, Bulsara M,
Avril S, Brockbank EC, Bosse T, et al. Pathological chemotherapy response score is
prognostic in tubo-ovarian high-grade serous carcinoma: A systematic review and
meta-analysis of individual patient data. Gynecol Oncol 2019, 154:441-448.
22. Santoro A, Angelico G, Piermattei A, Inzani F, Valente M, Arciuolo D, Spadola S,
Mulè A, Zorzato P, Fagotti A, et al. Pathological Chemotherapy Response Score in
Patients Affected by High Grade Serous Ovarian Carcinoma: The Prognostic Role of
Omental and Ovarian Residual Disease. Front Oncol 2019, 9:778.
23. Böhm S, Faruqi A, Said I, Lockley M, Brockbank E, Jeyarajah A, Fitzpatrick A, Ennis
D, Dowe T, Santos JL, et al. Chemotherapy response score: development and
validation of a system to quantify histopathologic response to neoadjuvant
chemotherapy in tubo-ovarian high-grade serous carcinoma. J Clin Oncol 2015,
33:2457–63.
24. McCluggage WG, Judge MJ, Clarke BA, Davidson B, Gilks CB, Hollema H,
Ledermann JA, Matias-Guiu X, Mikami Y, Stewart CJ, et al. International
27
primary peritoneal carcinoma: recommendations from the International Collaboration
on Cancer Reporting (ICCR). Mod Pathol 2015, 28:1101–22.
25. Liang M, Prendergast E, Staples J, Holschneider C, Cass I. Complete pathologic
response at interval debulking surgery following neoadjuvant chemotherapy predicts
improved survival in women with advanced epithelial ovarian cancer in a
multi-institutional cohort. Gynecol Oncol. 2016,143:197.
26. Lee JY, Chung YS, Na K, Kim HM, Park CK, Nam EJ, Kim S, Kim SW, Kim YT,
Kim HS. External validation of chemotherapy response score system for
histopathological assessment of tumor regression after neoadjuvant chemotherapy in
tubo-ovarian high-grade serous carcinoma. J Gynecol Oncol 2017, 28:e73.
27. Rajkumar S, Polson A, Nath R, Lane G, Sayasneh A, Jakes A, Begum S, Mehra G.
Prognostic implications of histological tumor regression (Böhm's score) in patients
receiving neoadjuvant chemotherapy for high grade serous tubal & ovarian carcinoma.
Gynecol Oncol 2018, 151:264-268.
28. Zhang XY, Zhang PY. Recent perspectives of epithelial ovarian carcinoma. Oncol Lett
2016, 12:3055-3058.
29. Connolly DL, Shanahan CM and Weissberg PL: The aquaporins. A family of water
channel proteins. Int J Biochem Cell Biol 30: 169‑172, 1998.
30. Ribatti D, Ranieri G, Annese T and Nico B. Aquaporins in cancer. Biochim Biophys
Acta 2014, 1550-1553.
31. Wang J, Feng L, Zhu Z, Zheng M, Wang D, Chen Z and Sun H. Aquaporins as
diagnostic and therapeutic targets in cancer: How far we are? J Transl Med 2015,13:
96.
32. Tomita Y., Dorward H., Yool A.J., Smith E., Townsend A.R., Price T.J., Hardingham
J.E. Role of Aquaporin 1 Signalling in Cancer Development and Progression. Int. J.
28
33. Angelico G, Caltabiano R, Loreto C, Ieni A, Tuccari G, Ledda C, Rapisarda V.
Immunohistochemical Expression of Aquaporin-1 in Fluoro-Edenite-Induced
Malignant Mesothelioma: A Preliminary Report. Int J Mol Sci. 2018,19(3).
34. Angelico G, Ieni A, Caltabiano R, Zeppa P, Tuccari G. Aquaporin-1 expression in
fluoro-edenite-induced mesothelioma effusions: An approach by cell-block procedure.
Cytopathology. 2018, 29:455-460.
35. Kao, S.C.; Armstrong, N.; Condon, B.; Griggs, K.; McCaughan, B.; Maltby, S.;
Wilson, A.; Henderson, D.W.; Klebe, S. Aquaporin 1 is an independent prognostic
factor in pleural malignant mesothelioma. Cancer 2012, 118, 2952–2961.
36. Mobasheri A, Airley R, Hewitt SM and Marples D. Heterogeneous expression of the
aquaporin 1 (AQP1) water channel in tumors of the prostate, breast, ovary, colon and
lung: A study using high density multiple human tumor tissue microarrays. Int J Oncol
2005, 26: 1149-1158.
37. Yang JH, Shi YF, Chen XD, Qi WJ. The influence of aquaporin-1 and microvessel
density on ovarian carcinogenesis and ascites formation. Int J Gynecol Cancer 2006,
16(Suppl 1):400–405.
38. Yang JH, Yu YQ, Yan CX. Localisation and expression of aquaporin subtypes in
epithelial ovarian tumours. Histol Histopathol 2011, 26:1197–1205.
39. Takal MK, Baykal C, Başer E, Kaya MD, Dursun P, Ozen O, Haberal AN, Ayhan A.
Does Aquaporin-1 expression have clinical significance in serous epithelial ovarian
cancer? J Turk Ger Gynecol Assoc 2013;14:130-5.
40. Xuejun C, Weimin C, Xiaoyan D, Wei Z, Qiong Z, Jianhua Y. Effects of aquaporins
on chemosensitivity to cisplatin in ovarian cancer cells. Arch Gynecol Obstet 2014,
290:525–532.
41. Wang Y, Fan Y, Zheng C, Zhang X. Knockdown of AQP1 inhibits growth and
29
42. Chetry M, Li S, Liu H, Hu X, Zhu X. Prognostic values of aquaporins mRNA
expression in human ovarian cancer. Biosci Rep 2018,38:BSR20180108.
43. Sato K, Miyamoto M, Takano M, Furuya K, Tsuda H. Different Prognostic
Implications of Aquaporin-1 and Aquaporin-5 Expression among Different
Histological Types of Ovarian Carcinoma. Pathol Oncol Res 2020, 26:263-271.
44. Imaizumi H, Ishibashi K, Takenoshita S, Ishida H. Aquaporin 1 expression is
associated with response to adjuvant chemotherapy in stage II and III colorectal
cancer. Oncol Lett 2018, 15:6450–6456.
45. Pan XY, Guo H, Han J, Hao F, An Y, Xu Y, Xiaokaiti Y, Pan Y, Li XJ. Ginsenoside
Rg3 attenuates cell migration via inhibition of aquaporin 1 expression in PC-3M
prostate cancer cells. Eur J Pharmacol 2012;683:27–34.
46. Liu YH, Zhu WL. Effects of cetuximab combined with afatinib on the expression of
30
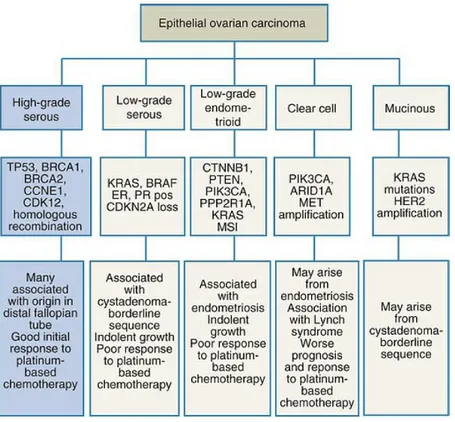
FIG. 1. Ovarian epithelial carcinomas, relevant genetic alterations and notes on origin. Data from Banerjee S, Kaye SB: New strategies in the treatment of ovarian cancer: current
clinical perspectives and future potential. Clin Cancer Res 19[5]:961-968, 2013;
Konstantinopoulos PA, Matulonis UA: Current status and evolution of preclinical drug
31
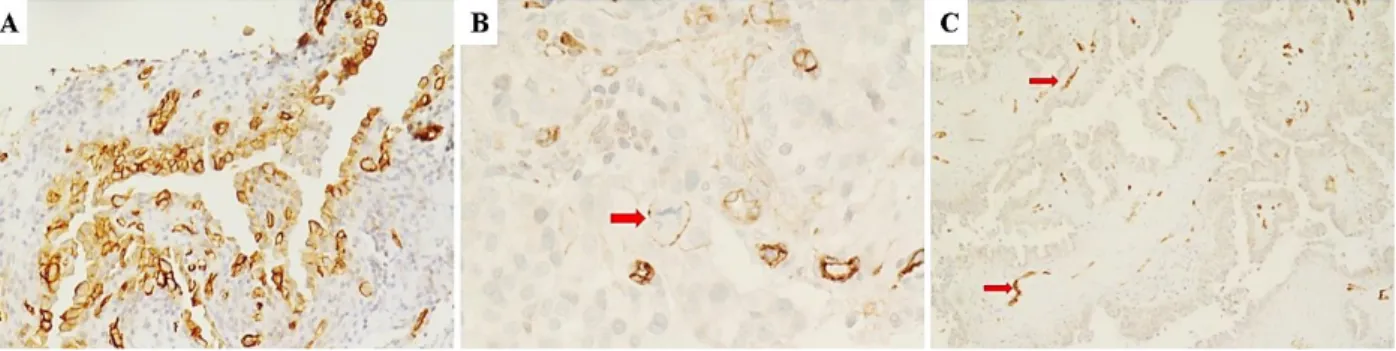
Figure 2. Different Immunohistochemical expression patterns of AQP1 in diagnostic biopsies of high grade serous ovarian carcinomas. A) Diffuse positivity for AQP1 showing linear and circumferential membranous staining is depicted. B) Another serous cacinoma case
showing focal staining for AQP1. Arrow indicates two adjacent neoplastic cells (a mitotic
figure is shown in the cell on the left) with linear and circumferential membranous staining.
C) Negative staining for AQP1 is depicted. Arrow indicates vascular endothelial cells which
32
Figure 3. Omental pathological response according to AQP1 IHC.
A) Diagnostic biopsy of a case of high grade serous ovarian carcinomas demonstrating diffuse
positivity for AQP1; B) after NACT and IDS this case showed an omental response score of
1: mainly viable tumor with no or minimal regression-associated fibro-inflammatory changes.
C) Another serous ovarian carcinoma case showing negative staining for AQP1. Scattered
vascular endothelial cells served as positive internal control (arrow). D) After NACT and IDS
this case showed an omental response score of 3: extensive fibro-inflammatory changes with
33 0 20 40 60 80 100 10 20 30 40 50 60
Survival time (months)
C um ul at ive s ur vi va l ( % ) AQP1 IHC -+
Figure 4. Survival curves of all cases of ovarian high-grade serous carcinomas in relation to immunohistochemical expression of AQP1.
34 TABLE 1. Patients’ Characteristics
Case Age Stage AQP1 IHC CRS Follow-up (months) Outcome
1 49 IIIC 0 (Negative) 3 60 A 2 42 IV 0 (Negative) 3 60 A 3 73 IV 0 (Negative) 3 30 A 4 37 IIIC 0 (Negative) 3 35 A 5 57 IIIC 0 (Negative) 3 45 A 6 55 IIIC 0 (Negative) 2 32 A 7 52 IIIC 0 (Negative) 2 24 A 8 68 IIIC 0 (Negative) 2 20 D 9 45 IIIC 0 (Negative) 2 60 A 10 48 IV 0 (Negative) 2 60 A 11 71 IIIC 0 (Negative) 1 20 D 12 63 IIIC 0 (Negative) 1 30 D
13 58 IIIC 25 (Not uniform) 1 40 A
14 73 IIIC 25 (Not uniform) 1 40 A
15 75 IIIC 25 (Not uniform) 1 12 D
16 68 IIIC 25 (Not uniform) 1 20 D
17 46 IIIC 50 (Diffuse) 1 24 A 18 49 IIIC 50 (Diffuse) 1 24 A 19 55 IIIC 50 (Diffuse) 1 24 A 20 61 IV 50 (Diffuse) 1 32 A 21 75 IIIC 80 (Diffuse) 2 24 A 22 72 IIIC 80 (Diffuse) 2 20 D 23 48 IIIC 5 (Focal) 2 20 D 24 53 IIIC 5 (Focal) 2 16 D 25 57 IIIC 5 (Focal) 2 26 A 26 60 IV 5 (Focal) 2 40 A 27 63 IIIC 1 (Focal) 2 60 A 28 52 IIIC 1 (Focal) 2 60 A 29 59 IIIC 1 (Focal) 2 30 A 30 64 IIIC 1 (Focal) 2 24 D 31 66 IIIC 1 (Focal) 2 34 A 32 50 IIIC 1 (Focal) 2 31 A
Legend: IHC (immunohistochemistry), CRS (complete response score), A (alive), D (dead for the disease)
35
Table 2. Distribution of CRS scores according to AQP1 staining.
CRS AQP1- AQP1+
1-2 7 20
3 5 0