THE SPHERE DRAG RHEOMETER: A NEW INSTRUMENT FOR
ANALYSING MUD AND DEBRIS FLOW MATERIALS
Anna Maria Pellegrino1, Anna Scotto di Santolo2 and Leonardo Schippa3
1,3
ENDIF, Universitá di Ferrara, Italy; 2 Università Pegaso, Italy
ABSTRACT: The present study focused on novel rheometrical tool for the determination of the rheological behavior of large particle mixtures with particular interest in the application to granular materials involving in fast landslides as mud and debris flows. The main goal is the development of the Sphere Drag Rheometer (SDR), a home-made large-scale rheometer that allow to estimate the rheological properties of these mixtures considering particles up to 50 mm grain size. The SDR is composed of a sphere rigidly joined to a support that moves at constant velocity into the mixture. Compared to standard rheometer, the SDR uses much higher volume of mixtures of wider grain size distribution next to that in situ. Several pyroclastic soils collected from the source area of debris flows occurred in Campania region (Southern Italy) were analyzed. The paper reports the experimental results on fine particles mixtures, large particle mixtures, and their comparison. The experimental results on fine mixture are compared with those obtained by conventional rheometrical tools reported in previous papers.
Keywords: Sphere Drag Rheometer, fine and large particle mixture, pyroclastic soils, Non-Newtonian fluids
1. INTRODUCTION
The paper focuses on an innovative rheometrical system for the determination of the rheological properties of fluids containing large particles, i.e. maximum grain size larger than 1 mm. The knowledge about the rheological properties of large particle fluids is of great and increasing importance because of their relevance in several fields like natural hazards, building materials, gas and oil, and food industry [1]. In the present study fast landslides as debris flows and the application of rheometry for debris flows are of primary interest. Debris flows put in danger people and animals, and cause damage in hilly and mountainous areas. More than 55000 people died in the last hundred years worldwide due to debris flows or combined debris flow and flood events. In Italy more than 4000 people die in the last fifty years due to debris flows and flooding phenomena. In order to protect people, animals and infrastructures from damage, hazard zone mapping and warning systems as well as structural protective measures must be considered depending on the specific situation. During the definition process of such protective measures, the debris flow modeling is becoming a more and more important task [2]-[3]. Numerical and physical modeling help in the hazard zones delineating and in the structural design and testing [4]. In order to understand and simulate the flow and the deposition process, an appropriate rheological model is a very useful physical concept for mud, debris and hyper-concentrated flows [5]. The simplest method is to assimilate the flowing mass
to a continuous viscous fluid and refers to rheological models derived from the resistance formula of Newtonian and Non-Newtonian fluids [6]. When a rheological model is considered, only the material flow curve, e.g. expressing the shear rate-shear stress relation, is required. Nowadays, efficient rheometrical apparatuses for the determination of the rheological parameters of mixtures and fluids containing fine particles exist and the experimental methods related to them are widely consolidated [5]-[7]-[8]-[9]-[10]. For mixtures and fluid containing large particle, the study of the influence of the grain size is more complicated. Experimental devises equipped with a large geometrical configurations are required and such apparatuses are few and not commercially developed [11]-[12]-[13]-[14]-[15]. The debris flow materials hereby considered presents a wide grain size distribution and a small content of fine particles. Therefore, in order to estimate the rheological properties of these mixtures (i.e., considering the whole grain size distribution), a home-made experimental large-scale rheometer was design and built, the Sphere Drag Rheometer (SDR). The paper describes the main features of the SDR rheometer, presents the conversion theory used to express the measured data as rheological parameters. Then, the SDR experimental results with fine water-soil mixtures are illustrated and compared with those from conventional rheometrical tools in order to assess the validity of the calibration procedure. Finally the results on coarse water-soil mixtures were analyzed and compared with cone test. The system could be an efficient rheometrical tool for the investigation of
fluids containing particles up to 10 mm grain size. 2. THE SPHERE DRAG RHEOMETER SDR 2.1 Characteristics and procedures
Referring to the works of [14]-[16], we developed an innovative system for measuring the motion’s resistance for large particle mixtures called SDR. The SDR is composed of a sphere, with variable diameters D, rigidly joined to a support that moves at constant velocity into the mixture. The sphere is connect to a load cell that measures the drag force necessary to move the ball through the fluid at the imposed speed. The system, illustrated in Fig. 1, is composed by a cylindrical container (i.e. having radius dc equal to 130 mm,
height hc equal to 60 mm and sample volume equal
to 0.5 l) in which the material sample are located and of an eccentric sphere (i.e. with a variable eccentricity r, relative to the motor, varying from 20 to 46 mm) fixed to a thin vertical shaft. The device can be equipped with different spheres having diameters ranging from 8 to 18 mm.
Fig.1 Upside: geometrical scheme of the SDR rheometer. Downside: complete configuration of the SDR rheometer.
The main components of the SDR apparatus are (see Fig. 1): a base station with two motors (i.e., a “slow motor” goes from 0.4 to 9.5 rpm and a “fast motor” goes to 10 to 260 rpm); a telemeter as broadcasting system; load cells having different full scale FS (i.e., one equal to 250 g and the other equal to 1000 g); a box for the electronic controlling; a reed (i.e. a magnetic position sensor); a software called SMV_V1 developed ad hoc for the SDR rheometer control. The experiment consists in measuring the drag force FD
at a specified rotational speed Ω, while the sphere makes one full rotation within the material sample. In Fig. 2a the measured points, obtained during one full rotation of the sphere, for different values of Ω, are showed. For each imposed velocity the value of the required drag force FD (value at which
the sphere starts moving through the material sample) is evaluated as the average between the measured points in a full rotation, of the sphere, as illustrated in Fig. 2b. The apparent flow curve was obtained by applying an increasing and decreasing rotational speed ramp. In order to ensure the stability of the measurements, each value of velocity was imposed for 30 seconds. This time was in agreement with the experimental results carried out with conventional rheometer on the same pyroclastic debris flow materials as described in [5].
Fig.2 Silicon oil with viscosity equal to 60 Pa·s. a) Measurements of FD during a full rotation of the
sphere (D=18mm) at different imposed rotational speed Ω (diamonds 1.24 rad/s, squares 2.27 rad/s, triangles 3.28 rad/s, circles 4.19 rad/s, stars 5.15 rad/s, crosses 6.93 rad/s, little dashes 7.83 rad/s, big dashes 8.63 rad/s); b) Resulting flow curve FD
-Ω.
2.2 Calibration of the SDR rheometer
The SDR rheometer was calibrated using several reference materials for which the rheological behavior was already analyzed and well-known. Tests were performed on different Newtonian viscous materials (i.e. glycerin and silicone oils at different peculiar viscosity) and on Non-Newtonian viscous materials with yield stress
(i.e. hair gel and tomato sauce). After, the calibration was carried out using a representative soil-water mixture, composed by water and kaolin, in order to approach the feasibility of the experimental apparatus with particles-fluid suspensions close to debris flow material mixtures tested in traditional rheometer before [5]. The kaolin-water mixture was reconstituted according to the total solid volumetric concentration ΦT,
defined as the ratio of the volume of solids to the total volume (water plus solids), as follow:
S S T f g TOT S W
V
V
V
V
V
(1)where VTOT, VW, VS are, respectively, the total
volume, the volume of water and the volume of solid in the sample, and Φf, Φg are, respectively the
solid volumetric concentration of fine particle and the solid volumetric concentration of coarse particle of the mixture. The complete description of the calibration is reported in [17].
2.3 Conversion of measured data into rheological parameters
Unlike traditional rheometers, the measuring system adopted for the SDR is not based on the classic shear flow between two parallel surfaces but on the flow regime around the object, a sphere that moving as in Fig.3. For this reason it was defined an appropriate theory of conversion that allow to relate the two schemes of flow.
Fig.3 Schematic principal task for the sphere drag measuring system on the left. Scheme of the classic shear flow on the right.
The analytical solution of the free motion of an object into a Newtonian fluid goes back to the work of [18]-[19] reported in [20]. The problem of the motion of an object of spherical shape through a Yield Stress Fluid is more complex than the case of Newtonian Fluid and requires a different treatment. No simple solutions were found yet and various analytical expressions were also been proposed [21]-[22]-[23]. All the theoretical works, which assume a simple yielding behavior, predict a particle velocity progressively decreasing to zero as the applied force tends to the critical value for incipient motion. The experimental results
presented in the literature are in agreement with this basic expectation, namely, that the object can move through the fluid only when the force applied to it becomes greater than a critical one. In the case of Yield Stress Fluid we assume that the fluid remains perfectly rigid in its solid regime and follows a constitutive equation such as Herschel & Bulkley in its liquid regime as:
n
c
k
c
(2) In Eq. (2), τ is the shear stress (Pa), τc is theyield stress (Pa), is the shear rate (s-1), k is the consistent coefficient (Pa·sn) and n is the dimensionless pseudo-plasticity index. The considered conversion theory is applicable only in the treatment of Yield Stress Fluid. As observed in [5] the soil-mixtures considered in the present study are Yield stress Fluid and their behavior is well described using the Herschel & Bulkley model (Eq. (2)). In this condition the drag force FD
can be computed as following:
D
1
napp
C c
F
k
F
(3)Where k is an increasing, positive, dimensionless function of the surface of the object and decrease towards a critical, minimum value kc
and FC is the critical drag force FC equal to:
4
C c c
F
R
k
(4) Where R is the sphere radius. Considering the numerical work of [23], the relationship between the measured sphere velocity and the apparent shear rate is the following:app
v
l
(5) Where v is the linear velocity of the sphere(m/s) and l is equal to 1.35 multiplied the radius of the sphere R. The complete description of the applied conversion theory is reported in [17].
The extensive description of the laboratory activity on calibration of the SRD rheometer with Newtonian viscous materials and on Non-Newtonian viscous materials with yield stress is reported in [25].
3. MATERIALS AND METHODS
The SDR experimental results reported are related to pyroclastic soils which are representative of real debris flows and subaerial and submarine landslide occurred in Southern Italy.
The soil A and B derives from the most recent deposits produced by the volcanic activity of mount Somma/Vesuvius and they are sandy silt with a small clay fraction [24].
Regarding soil S, the material derives from the volcanic deposits related to the very recent Strombolian activity of the summit craters that covered the Sciara del Fuoco depression [26] and consists mainly of sand with a small gravel fraction and there are no silt or clay fractions. The main grain size distribution of the three soils considered is reported in Fig. 4.
Fig.4 Gran size distribution of the considered soils. The geotechnical and mechanical properties of such materials are well documented in literature [24]-[26].
All the experiments involved mixtures of dry soils with different amounts of water. The materials were mixed with appropriate amount of distilled water in order to obtained mixtures having different solid volumetric concentrations Φ according to Eq. (1). A total amount of about 500 ml of mixture (distilled water and soils) was pre-pared and each sample was continuously mixed for the time needed to obtain a fairly homogeneous mixture. The whole sample was used performing SDR test. The entire experimental program was carried out at constant temperature equal to 20°.
Fine-grained mixtures composed with soil A and soil B (i.e., mixtures composed by soil fraction with a particle diameter less than 0.5 mm) were tested in order to compare the data to those obtained using standard rheometer [5]. Also coarse-grained mixtures (i.e., mixtures composed by soil fraction with a particle diameter up to 0.5 mm) were tested.
The complete experimental program is illustrated in Tab. 1.
4. RESULTS ON FINE AND LARGE
MIXTURES
The fine-grained water-soil A and B mixtures were tested with SDR rheometer according to experimental program described in Tab. 1. The
experimental data obtained are reported in Figs. 5 and 6 for soil A and soil B, respectively, at different solid volumetric concentrations Φ. Table 1 Experimental program.
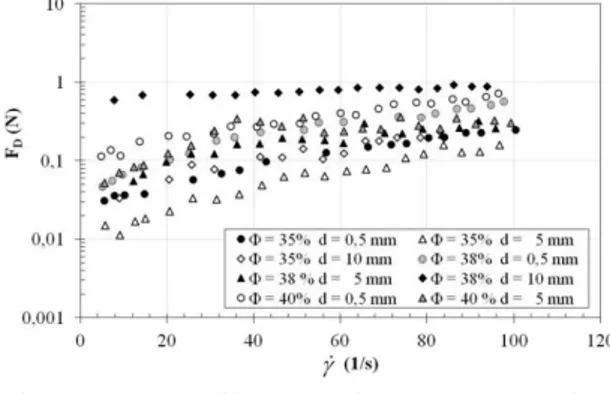
Test (#) Soil (-) ΦT (%) Φf (%) Φg (%) dMAX (mm) 0 A 32 32 - 0.5 1 A 35 35 - 0.5 2 A 38 38 - 0.5 3 A 40 40 - 0.5 4 A 42 42 - 0.5 5 A 35 28 7 5.0 6 A 38 31 7 5.0 7 A 40 32 8 5.0 8 A 35 21 14 10.0 9 A 38 24 16 10.0 10 B 32 32 - 0.5 11 B 35 35 - 0.5 12 B 38 38 - 0.5 13 B 30 21 9 5.0 14 B 32 22 10 5.0 15 B 35 25 10 5.0 16 B 38 29 9 5.0 17 S 55 - - 0.5
The graphs report the evolution of the drag force FD as a function of the apparent shear rate.
For each mixtures considered, the apparent shear rate was derived from the value of the imposed rotational speed Ω according to Eq. (5). In this way we defined the experimental flow curve in which the measured drag force FD is related to the
calculated apparent shear rate. Then the experimental flow curves (e.g., symbols in Figs. 5 and 6) were compared with the theoretical curve (e.g., lines in Figs. 5 and 6) obtained starting to the conversion theory and using the Eqs. (3) and (4). First, we note that there is a good match between the measured data and those obtained through the application of the conversion theory. The water-soil mixtures behave like Non-Newtonian fluid and flow resistance increases with the increasing of shear rate regardless the value of solid concentration. The solid fraction clearly influences the rheological behavior of the materials. Although it is not possible to precisely identify the value of the critical drag force FD associated to each
mixtures, especially for more dilute mixtures (e.g., because of the lack of measurement points at very low rotational speed), even though the data show a trend equal to that obtained with tests in standard rheometer [5]. The resistance force is strictly influences by the solid volumetric concentration.
The intrinsic strength of the mixtures increases as the particle fraction increases and there is a critical value of drag force below which the flow is possible.
The coarse-grained water-soil A and B mixtures were tested with SDR rheometer according to experimental program described in Tab. 1. The experimental data obtained are reported in Figs. 7 and 8 for soil A and soil B, respectively, at different solid volumetric concentrations Φ and different grain size distribution. The graphs report the evolution of the drag force FD as a function of the apparent shear
rate.
Fig. 5 Fine-grained water-soil A mixtures at several values of solid volumetric concentration Φ: comparison between SDR measured data (symbols) and theoretical curve (lines).
For each mixtures considered, the apparent shear rate was derived from the value of the imposed rotational speed Ω according to Eq. (5). In this way we defined the experimental flow curve in which the measured drag force FD is
related to the calculated apparent shear rate. Also in this case, the coarse-grained water-soil mixtures behave like Non-Newtonian fluid and the flow resistance increases with imposed shear rate regardless the value of solid concentration.
Fig.6 Fine-grained water-soil B mixtures at several values of solid volumetric concentration Φ: comparison between SDR measured data (symbols) and theoretical curve (lines).
The solid fraction also influences the rheological behavior of the materials. The data show a trend equal to that obtained with tests on fine-grained mixtures. We note that the resistance force is strictly influences by the grain size distribution and increases as the size particles increases (Fig. 7) according to [12] and [13].
Fig. 7 Coarse-grained water-soil A mixtures at several values of solid volumetric concentration Φ and different grain size distribution according to Tab. 1.
Fig. 8 Coarse-grained water-soil B mixtures at several values of solid volumetric concentration Φ and grain size distribution according to Tab. 1.
Fig. 9 Water-soil A mixtures: comparison between fine-grained and coarse-grained mixtures according to Tab. 1.
The experimental results obtained on coarse-grained water-soil A and B mixtures were compared with those obtained on fine-grained
water-soil A and B mixtures according to experimental program described in Tab. 1. The comparisons obtained are reported in Figs. 9 and 10 for soil A and soil B, respectively, at different solid volumetric concentrations Φ and different grain size distribution. We observe that, at equal total solid volumetric concentration, the adding of the solid fraction with a diameter less than 5 mm brings to a reduction of the characteristic resistance of the mixture regardless the material tested.
Fig. 10 Water-soil B mixtures: comparison between fine-grained and coarse-grained mixtures according to Tab. 1.
Moreover, the addition of the fraction of particles with a diameter less than 5 mm corresponds to a solid volumetric concentration of coarse particles Φg of about 8-10% of the entire
total solid concentration, this result becomes consistent with several previous experimental observations ([12]-[13]) and with the experimental results obtained through tests on the same coarse-grained mixtures with conventional measurement systems reported in [15]. Several studies have already demonstrated that the addition of coarse particles brings to an increase of the rheological characteristics of the mixture but, for relatively low solid volumetric concentration, a minimum depletion in fine particles fraction within the mixture does not seem to be sufficient to induce a increase of rheological parameters ([12]-[13]-[14]- [15]).
Different considerations can be done when the solid fraction with a diameter less than 10 mm is added. We observe that, at equal total solid volumetric concentration, there is an increase of the characteristic strength of the mixture. Indeed, it is noted that the addition of the fraction of particles with a diameter less than 10 mm corresponds to a solid volumetric concentration of coarse particles Φg of about 14-16% of the entire total solid concentration.
5. COMPARISON BETWEEN SDR AND CONE TEST YIELD STRESS
Although it is not possible to precisely identify the value of the critical drag force FD associated to
each mixtures, especially for more dilute mixtures (e.g., because of the lack of measurement points at very low rotational speed), even though the data show a trend equal to that obtained with tests in standard rheometer. The resistance force is strictly influences by the solid volumetric concentration. The intrinsic strength of the mixtures increases as the particle fraction increases and there is a critical value of drag force below which the flow is possible.
The water-soil S mixture was tested with SDR rheometer according to experimental procedure described in section 3. In this case, only a mixture at solid volumetric concentration Φ equal to 55 % was considered because of the effects related to settling and phase’s separation became relevant at lesser solid fraction. In Fig. 11 the results relative to the sweep test carried out are reported. The graphs report the evolution of the drag force FD as
a function of the apparent shear rate. The apparent shear rate was derived from the value of the imposed rotational speed Ω according to Eq. (5). In this way we defined the experimental flow curve in which the measured drag force FD is
related to the calculated apparent shear rate. It is worth noted that the value of the measured drag force FD is almost constant in the range of the
applied rotational speed. In fact it was not possible to investigate the response of the water-soil S mixtures at larger shear rates because of the sensitivity of the load cells. In this way we deduced the critical value of the drag force FD at
which the mixture starts to flow but no information are available regarding the behaviour of the material during the flow.
The presence of a yield resistance force confirms that this material behave as a Non-Newtonian fluid in its liquid regime as demonstrated in several works on the rheological behavior of pyroclastic Strombolian soils [26]-[27]. Unfortunately, no tests in standard rheometer on water-soil S mixture were performed because of the grain size distribution of the material (Fig. 4).
So the comparison between the experimental flow curve obtained with SDR (Fig. 11) and the theoretical curve obtained using the Eqs. (3) and (4) it was not possible. For this reason, the water-soil mixture composed with water-soil S was preliminarily analyzed using a cone shaped penetrometer. The penetrometer test allows measurement of the critical stress separating the solid and the liquid regime closer to the field conditions (i.e., flow over steep slopes). In this way it was possible to verify the data obtained with the SDR rheometer related to the critical resistance for the water-soil S mixture. The cone is
placed in contact with the surface of the material sample located in cylindrical container. After the zero measurement, the cone is allowed to fall for 5 s.
Then the final measurement of the cone tip penetration is signed which represents the magnitude of the cone tip penetration dP.
Fig. 11 Water-soil S mixtures: comparison between fine-grained and coarse-grained mixtures according to Tab. 1.
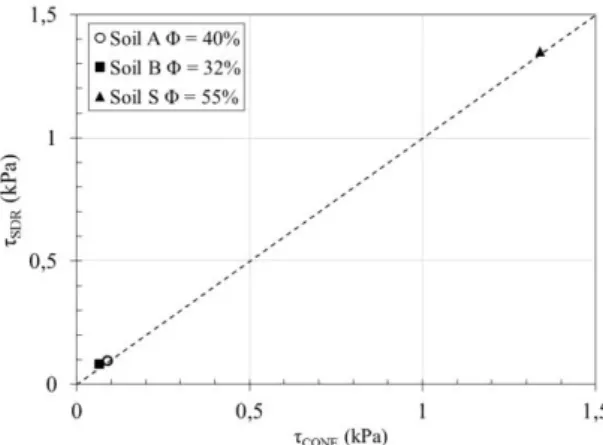
Fig. 12 Comparison between experimental result from SDR rheometer and cone penetration test in terms of yield stress τ.
The shear strength τcone is calculated using the
following correlation:
9,8
2cone
K M d
P (5)Where K is a dimensionless constant function of the summit angle of the cone having mass M. The penetrometer test was also performed on two water-soil mixtures composed with soil A and B according to the experimental program in Tab. 1 as terms of comparison. Fig. 11 reports the comparison between the value of shear stress obtained with the penetration test τcone and the
value of shear stress obtained with the SDR
rheometer test τSDR for the three water-soil
mixtures considered. It is worth noted that there is a very good match between the results obtained with different tools. This achievement represents a further validation of the feasibility of the experimental apparatus SDR with particles-fluid suspensions close to debris flow material mixtures. 6. CONCLUSION
The paper reports the experimental evidences related to an innovative large scale rheometer (Sphere Drag Rheometer, SDR) developed for determining the viscous properties of materials involved in rapid flow-like phenomena as subaerial and submarine landslides. The experimental data carried out on several water-soil mixtures are presented. The obtained experimental results, conveniently converted into rheological parameters, show that the SDR rheometer is able to analyze flowing materials similar to those involved into pyroclastic debris flows. The results are also compared with data obtained using standard rheometrical tools in order to furtherly confirm the feasibility of the SDR rheometer for fine and coarse mixture on tilting test and cone tests.
7. REFERENCES
[1] Forterre Y & Pouliquen O, Flows of dense granular media, Annual Review of Fluid Mechanics, 40, 2008, 1-24.
[2] Scotto di Santolo A & Evangelista A, Some observations on the prediction of the dynamic parameters of debris flows in deposits in the Campania region of Italy, Journal of Natural Hazards, 50, 2009, 605–622.
[3] Pudasaini SP, A General Two-Phase Debris Flow Model, Journal of Geophysical Research, 117, 2012, F0310.
[4] Pellegrino AM, Scotto di Santolo A & Schippa L, Numerical modeling of a debris flow event occurred in Campania region, southern Italy: consideration on the rheological model parameters on the run-out, in Proc. Latest Trends in Engineering Mechanics, Structures, Engineering Geology, 2014.
[5] Scotto di Santolo A, Pellegrino AM, Evangelista A, Coussot P, Rheological behaviour of reconstituted pyroclastic debris flow, Geotechnique Journal, 62 (1), 2012, 19-27.
[6] Coussot P, Mudflow Rheology and Dynamics, IAHR Monograph series, Balkema.
[7] O’Brien JS & Julien PY, Laboratory analysis of mud-flow properties, Journal of Hydraulic Engineering 114, 1988, 877-887.
[8] Kaitna R, Rickenmann D & Schatzmann M, Experimental study on the rheologic behaviour of debris flow material, Acta Geotechnica 2, 2007, 71-85.
[9] Bisantino T, Fischer P & Gentile F, Rheological characteristics of debris-flow material in South-Gargano watersheds, Nat. Hazards Earth Syst. Sci. 54, 2010, 209-223. [10] Jeong SW, The viscosity of fine-grained
sediments: A comparison of low-to medium-activity and high-medium-activity clays, Eng. Geol. 154, 2013, 1-5.
[11] Bagnold RA, Experiments on gravity-free dispersion of large solid spheres in a Newtonian fluid under shear, Royal Society A 225, 1954, 49-63.
[12] Coussot P & Piau JM, A large-scaled field concentric cylinder rheometer for the study of the rheology of natural coarse suspensions, Journal of Rheology 39, 1995, 105-124. [13] Ancey C & Jorrot H, Yield stress for particle
suspension within a clay dispersion, Journal of Rheology 45, 2001, 297-319.
[14] Schatzmann M, Bezzola GR & Minor HE, Rheological Behaviour of Fine and Large Particle Suspensions, Journal of Hydraulic Engineering 129, 2009, 796-803.
[15] Scotto di Santolo A, Pellegrino AM & Evangelista A, Experimental study on the rheologic behaviour of pyroclastic debris flow, Journal of Natural Hazards and Earth Systems Science 10, 2010, 1-8.
[16] Müller M, Tyrach J & Brunn PO, Rheological characterization of machine applied plasters. ZKG International 52,1999, 252-258.
[17] Pellegrino AM, Scotto di Santolo A & Evangelista A, A new rheometer for mud and debris flow, Volcanic Rocks & Soils, Rotonda et al. (eds), 2016.
[18] Stokes GG, On the effect of the internal friction of fluids on the motion of pendulums, Trans. Camb. Phil. SOC. 9, 1851, 8-106. [19] Einstein A, Investigation of the Brownian
Movement, Ann. Physik 19, 1906, 289-306. [20] Lapple CE & Shepherd CB, Calculation of
particles trajectories, Industrial and Engineering Chemistry 32, 1940, 605.
[21] Ansley RW & Smith TN, Motion of spherical particles in a Bingham plastic, AIChE Journal, 13, 1967, 1193-1196.
[22] Beris AN, Tsamopoulos JA, Armstrong RC & Brown RA, Creeping motion of a sphere through a Bingham plastic, Journal of Fluid Mechanics 158, 1985, 219-244.
[23] Beaulne M & Mitsoulis E, Creeping motion of a sphere in tubes filled with Herschel-Bulkley fluids, Journal of Non-Newtonian Fluid Mechanics 72, 1997, 55-71.
[24] Picarelli L, Evangelista A, Rolandi G, Paone A Nicotera MV, Olivares L, Scotto di Santolo A, Lampitiello S, Rolandi M, Mechanical properties of pyroclastic soils in Campania Region. In Proc. of 2nd Int. Workshop on Characterisation and Engineering Properties of Natural Soils, 2007.
[25] Pellegrino AM, Studio teorico sperimentale del comportamento reologico dei terreni coinvolti nelle colate rapide, Ph.D. Thesis, 2012.
[26] Tommasi P, Chiocci F, Marsella M, Coltelli M & Pompilio M, Preliminary analysis of the December 2002 instability phenomena at Stromboli volcano, In Picarelli (ed), Int. Workshop on Occurrence and Mechanisms of Flows in Natural Slopes and Earthfills, Sorrento 2003.
[27] Chevrel MO, Platz T, Hauber E, Baratoux D, Lavallée Y & Dingwell DB, Lava flow rheology: A comparison of morphological and petrological methods, Earth and Planetary Science Letters, 384: 109–120, 2013.
International Journal of GEOMATE, Sept., 2016, Vol. 11, Issue 25, pp. 2512-2519.
MS No. 5269 received on June 11, 2015 and reviewed under GEOMATE publication policies. Copyright © 2016, Int. J. of GEOMATE. All rights reserved, including the making of copies unless permission is obtained from the copyright proprietors. Pertinent discussion including authors’ closure, if any, will be published in Sept. 2017 if the discussion is received by March 2017.