1
Ph.D. course in Sciences, technologies and biotechnologies for
the sustainability
Department for Innovation in Biological, Agro-food and Forest
systems (DIBAF)
University of Tuscia
New methodological approaches for zoning
the Italian territory according to the
wildfire risk
Leone Davide Mancini
Supervisor: Prof. Maurizio Sabatti
Tutor: Prof. Piermaria Corona
2
Abstract:
In the European Mediterranean Region wildfires can cause significant and unpredictable damage to infrastructures, settlements, human lives, natural resources and ecosystem services. By means of geodatasets (i.e. burned areas, Corine Land Cover and High Resolution Layers) and socioeconomic data, fire proneness of woodland types in Italy, wildfire spatial patterns and human drivers were assessed. Mediterranean pine forests, and transitional woodland-shrub are the woodland types most preferred in terms of fire occurrence and recurrence. Large fires and megafires hold a significant share of total burned area. The findings suggest a positive relationship between the distance from built-up areas and fire incidence (i.e. ratio between burnt forest area and total forest area), whereas a negative relation was found between distance from built-up areas and fire frequency. A comparative approach based on the use of multiple statistical models allowed to point out that wildfire regime is closely related to human activities. Wildfires frequency, severity and intensity have different correlation profiles, highlighting the need to consider different dimensions in fire risk assessment. In general, a disadvantaged economic context associated to unemployment and predominance of rural workers, disparities in per-capita income and (changing) demographic structures leads to higher fire risk. The proposed analyses provide information that are central to any approach to fire management. The findings of this study support advancements in prioritization of fire prevention, suppression measures, economic incentive allocation, and landscape planning.
Key words: wildfire regime; woodland types; fire recurrence; spatial patterns; anthropogenic factors; multi-model approach
3
1. Introduction
One of the main environmental risks in Europe is wildland fires. On average, ca. 380.000 hectares burn and ca. 64.000 fires occur each year in Europe (European Commission, 2015). Wildfires can cause significant and unpredictable damage to infrastructures, settlements, human lives, natural resources and ecosystem services (e.g. tourism, soil protection, biomass production, carbon sequestration, habitat provision, recreation). Moreover, they affect policies and governance concerning the protection and enhancement of forest landscapes (Carmo et al. 2011, Kolström et al. 2011, Corona et al. 2015). For that reasons, the sustainable management of the European forests, which occupy nearly half of Europe’s total area (FOREST EUROPE, UNECE and FAO, 2011), requires the understanding of the factors that influence fire occurrence and its environmental and socio-economic consequences.
Wildfires affect mainly Mediterranean ecosystems (Pausas et al., 2008; Miranda et al., 2008; Dimitrakopoulos et al., 2011; Costa et al., 2011). However, wildfire events recently appear to extent also to countries experiencing less frequent or less severe forest fires until a few years ago (e.g. Great Britain, Norway and Sweden), demonstrating the dynamic nature of the forest fire problem and the potential influence of Global Change (Moriondo et al., 2006).
Frequency, intensity and severity of forest fires vary largely across countries, depending on the conditions prevailing in each area (e.g. Moreno et al., 1998; Westerling et al. 2006). Climate (temperature regimes, abundance and frequency of precipitations) (e.g. Gillett et al. 2004; Mermoz et al. 2005; Moriondo et al., 2006; Pausas and Paula 2012), weather (e.g. Bessie and Johnson 1995; Elia et al. 2016), landscape fuel conditions (e.g. Romme 1982; Elia et al. 2015a), soil moisture (e.g. Finney 2001), ignition agents (e.g. Malamud et al. 2005; Elia et al. 2015b) and human pressure (e.g. Rollins et al. 2001; Lafortezza et al. 2015) has been proved to mainly affect fire risk.
Type, patterns and conditions of vegetation and fuels also significantly influence the number and size of wildfires. The fuels provided by the main tree species primarily drive its “baseline” flammability level (Xanthopulos et al. 2012, Corona et al. 2014), i.e. the relative ease by which a fuel will ignite and burn with a flame (Stacey at al. 2012, Fares at al. 2017). Xanthopoulos et al. (2012) proposed an assessment framework to assign a baseline flammability index to vegetation classes of the European Forest Types classification (Barbati et al. 2007, Barbati et al. 2014). Certain woodland types (e.g. shrublands or conifers) are at much greater risk of being affected by fire than others (i.e. greater fire proneness or fire incidence), because of differences
4
in management, vegetation structure and fuel load composition (Moreira et al. 2011, Ganteaume et al. 2013, Barros and Pereira 2014, Oliveira et al. 2014, Pereira et al. 2014).
Human-induced fires represent the vast majority of wildfires in many regions of the world (Goldammer and Crutzen, 1993; Gill et al. 2013; Moritz 2014), particularly in the countries of the Mediterranean Region (Pausas and Fernández-Muñoz 2012; Ganteaume et al. 2013; San-Miguel-Ayanz et al. 2013), where it is estimated that more than 90% of forest fires are man-caused (Leone et al. 2009; Vélez 2009; FAO 2007).
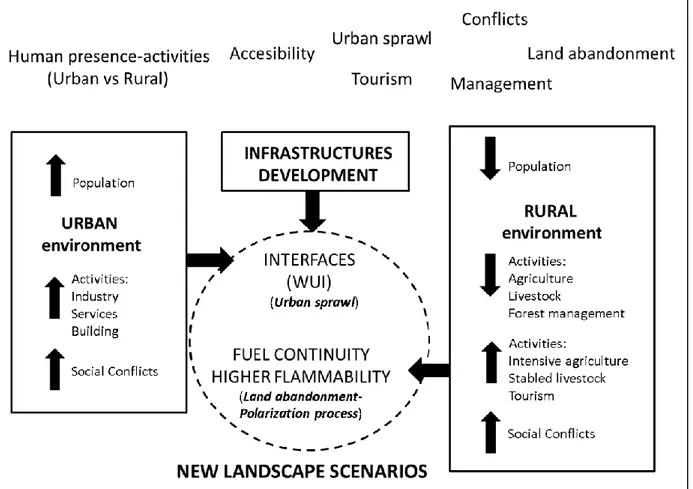
Humans affect fire regime also suppressing fire and indirectly by conditioning vegetation (fuel) through the type and intensity of land use (Moreira et al. 2011). The radical changes of the rural socio-economic systems in the European Mediterranean Region from the second part of the XX century (e.g. depopulation of rural areas, decline of traditional uses of grazing and firewood, reduction of forests as a raw material producer, increasing of recreational uses) (Leone et al. 2003; Hill et al. 2008; Ganteaume et al. 2013; Moreno et al. 2014; Viedma et al. 2015) have created conflicts and additional driving factors of fires (Fig.1).
5
Built-up areas and human pressure into the countryside have not only converted and altered farms and forests but have also produced a mixture of urbanized and rural lands. In addition, the expansion of human settlements into fire-prone landscapes has led to the creation of landscapes where built-up areas merge with wildland areas, namely Wildland-Urban Interfaces (WUI, see e.g. Lampin-Maillet et al. 2010) (Theobald and Romme, 2007). The interplay of biophysical and socioeconomic factors creates here particular conditions for potential fire ignition and spread, such as fuel load accumulation, lack of management, proximity to main roads and built-up areas, and seasonal peaks of population density. These landscapes, requires specific fire protection strategies and forces a change in approach from that of tackling fires to defending people, infrastructures, resources and housing asset values (Galiana et al. 2016). In this context, forest fires can cause remarkable damages to people living in these areas similar to the damages that has recently affected cities like Lisbon (Miranda 2004), Athens (Salvati and Ferrara 2014), Moscow (Shaposhnikov 2014; Porfiriev 2014) and Coimbra (BBC News 2017). Among Mediterranean countries, Italy represents one of the most prone areas to wildfires. In Italy, more than 80% of fires are estimated as human-induced (WWF 2014; Schmutz et al. 2013); over the past 20 years, a total of 1,100,000 ha of forest land have been burnt. An average of 11,000 fires occur annually, devastating more than 50,000 ha of forests. The largest wildfires are concentrated in southern Italy and main islands (CFS 2014). In northern Italy, wildfires occur mostly over the first quarter of the year (from January to March), a period when herbaceous vegetation is dry due to low temperatures and becomes prone to ignition; such a condition is especially common in the foothills of the Alps, up to 800 meters, and at high elevations in the Apennines. By contrast, in southern Italy the highest probability of wildfire occurrence is essentially in the third quarter of the year (from June to August); lack of rain (low level of soil moisture) and high air temperatures, possibly coupled with strong winds especially at an elevation up to 700 meters a.s.l., determine dry fuel conditions favoring fire ignition and spread (Corona et al. 2015). Moriondo et al. (2006) found that future scenarios of climate change in Italy are expected to produce the highest increase in annual extreme events in all Mediterranean Europe.
Wildfire geodatasets (i.e. datasets of the perimeters of wildfires) have a high potential to assess fire risk and wildfires drivers over large areas. This kind of information is currently available in many Countries of Mediterranean Europe (Chiriacò et al. 2013). In Italy, the National Forest Service (Corpo Forestale dello Stato, CFS) and the Forest Services of autonomous Regions have provided wildfires data since 1970. Vector geodataset of the areas affected by wildfires
6
(forest and rural areas), recorded by ground-based GPS surveys, is currently available for the years 2007-2014. The dataset currently covers 17 of the 20 EU-NUTS2 level administrative units of Italy (i.e. Sardinia, Sicily and all the Regions with ordinary statute), totalling 95% of the area burned during this period.
A proper quantification of fire occurrence and recurrence amongst different woodland types is essential to quantify need and priorities in fire management (Vazquez et al. 2015). The fire proneness of land cover types in Mediterranean Europe has been investigated in several studies (e.g. Nunes et al. 2005, Bajocco and Ricotta 2008, Moreira et al. 2009, Carmo et al. 2011, Marques et al. 2011, Barros and Pereira 2014; Oliveira et al. 2014, Pereira et al. 2014, Salvati et al. 2015). Some studies have highlighted the need to connect burned areas perimeters to fire affected land cover types, to gain an understanding of differences in fire proneness amongst woodland types (e.g. Gonzalez et al. 2006, Silva et al. 2009, Corona et al. 2014, Oliveira et al. 2014). However, at least to my knowledge, no published study has addressed fire recurrence at very large scale (e.g. national scale) in Mediterranean woodlands using annual time series of the wildfires perimeters, despite the most critical effects on ecosystem resilience are produced by recurrent fire events with short return periods (Moreira et al. 2011, Ricotta and Di Vito 2014, Barbati et al. 2015; Lisa et al. 2015).
To understand and predict spatial patterns of forest fire occurrence and recurrence is also crucial to improve the effectiveness of fire management resource allocation throughout large territories (Moreira et al. 2011). This is a remarkably complex research issue due to the multiple biophysical and socioeconomic drivers interacting over different spatial and temporal scales (e.g. Senici et al. 2010; Costa et al. 2011; Aldersley et al. 2011). Assessing and understanding the spatial patterns of wildfires may be a difficult task owing to limitations in fire recording protocols and the complexity of concurrent factors affecting wildfire ignition and spread. However, this knowledge is essential to design and promote sustainable land management strategies incorporating effective measures for fire prevention and suppression (Hann and Bunnell 2001; Stephens and Ruth 2005; Williams 2013).
In the last decade, proximity to cities was considered and studied, as an important factor increasing wildfire probability (e.g.Yang et al. 2008; Liu et al. 2012). Gralewicz et al. (2012) identified human proximity and elevation as influential factors of fire susceptibility in Canada. Human impact on fire occurrence and recurrence is primarily a product of population density and road accessibility (Gralewicz et al. 2012). Darques (2015) consider the distance to populated places might play a crucial role in determining the growth pattern of wildfires. Based
7
on this evidence, the use of proximity measures to built-up areas in assessing human influence on forest fires has been largely implemented in recent literature (Ganteaume et al. 2013). At the same time, elevation is expected to substantially influence fire ignition and spread through fuel moisture and altitudinal zonation of forest vegetation types (Fares et al. 2017). All other factors being equal, fuel moisture tends to increase with elevation (Hayes 1941; Bessie and Johnson 1995; Heyerdahl et al 2001), while the forest types corresponding to the different altitudinal belts are characterized by intrinsically different flammability levels (Xanthopoulos et al. 2012; Corona et al. 2015; Fares et al. 2017).
In the Mediterranean Region, various studies have investigated the spatial patterns of wildfires (e.g. de Vasconcelos et al. 2001; Kalabokidis et al. 2002; Koutsias et al. 2002; Amatulli et al. 2006; Badia-Perpinyá & Pallares-Barbera 2006; Lozano et al. 2007; Lozano et al. 2008; Calcerrada et al. 2008; Sebastián-López et al. 2008; Martínez et al. 2009; Romero-Calcerrada et al. 2010; Catry et al. 2010; Badia et al. 2011; Marques et al. 2011; Moreno et al. 2011; Oliveira et al., 2012; Ganteaume et al. 2013; Martinez-Fernandez et al. 2013; Rodrigues et al. 2014), but none of them have used complete (i.e. all wildfires) and medium-long term data on a national scale. Moreover, none of the studies has investigated the Italian territory and it is widely known in geography that spatial objects change their nature when observed at different scales (Prestemon et al., 2002). Further, all those studies did not account for recurrent wildfires despite their key role in driving ecological processes and forest resilience (Moreira et al. 2011; Ricotta and Di Vito 2014; Barbati et al. 2015).
While climate change and intrinsic spatiotemporal variability of key variables such as rainfall, temperature, relative humidity and wind are relatively well-known factors affecting wildfire risk, earlier studies have evidenced how the impact of socioeconomic factors on wildfire regime is less investigated (and probably more complex) than the impact raised by biophysical drivers (Millington et al. 2009; Fernandes 2016). Accordingly, a better knowledge of the main anthropogenic factors shaping spatial patterns of fire ignition and wildfire spread and intensity is a crucial step to improve effectiveness of fire detection, fighting and prevention strategies (Fernandes et al. 2014; Ganteaume et al. 2013).
Earlier studies have assessed the most relevant human-related factors affecting wildfire distribution and intensity in the European Mediterranean countries, considering separately land-use (e.g. Sebastan Koutsias et al. 2010; Carmo et al. 2011; Moreno et al. 2011; Verdù et al. 2012; Barros & Pereira 2014; Oliveira et al. 2014a), landscape attributes (e.g. Costafreda- Aumedes et al. 2013; Madrigal et al. 2013; Martin-Martin et al. 2013; Salvati & Ferrara 2014;
8
Gallardo et al. 2015; Salvati & Ranalli 2015), agricultural features (e.g. Kalabokidis et al. 2007; Koutsias et al. 2010; Oliveira et al. 2014b; Rodrigues & De La Riva 2014; Alvarez-Diaz et al. 2015), population distribution and characteristics (e.g. Martinez- Fernandez et al. 2013; Mourao & Martinho 2014; Oliveira et al. 2014b; Rodrigues & De La Riva 2014; Alvarez-Diaz et al. 2015; Gonzalez-Olabarria et al. 2015), infrastructure and place accessibility (e.g. Romero- Calcerrada et al. 2010; Costa et al. 2011; Moreno et al. 2011; Padilla & Vega-Garcia 2011; Vilar et al. 2011; Rodrigues et al 2014). Relatively few studies have focused on the influence of multiple anthropogenic factors together (Amatulli et al. 2006; Romero- Calcerrada et al. 2008; Sebastian-Lopez et al. 2008; Martinez et al. 2009; Moreira et al. 2010; Marques et al. 2011; Nunes 2012; Oliveira et al. 2012; Ortega et al. 2012; Ganteaume & Jappiot 2013; Martinez- Fernandez et al. 2013; Michetti & Pinar 2013; Chas-Amill et al. 2015). To our knowledge, Michetti and Pinar (2013) provided the only study which has investigated the influence of multiple anthropogenic factors on both frequency of fires and burned area at regional scale by using panel data approaches.
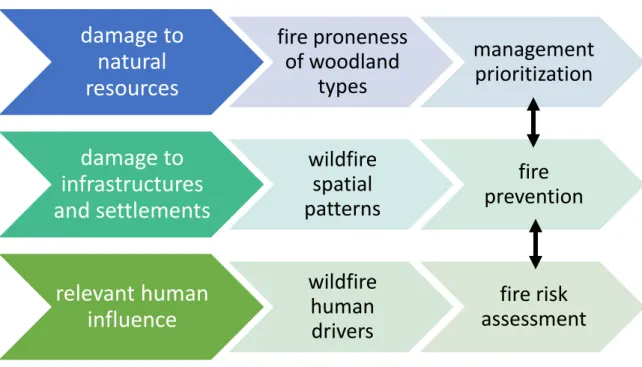
For the reasons outlined above this PhD thesis is articulated according to main three targets (Fig.2):
1. Investigation about the potential of very detailed time series of wildfire geodatasets for addressing questions that are central to any approach to fire management at large scale: which woodland types are most prone to fire recurrence? Which woodland types are most affected by WUI fires, large fires and megafires? Detailed evidence-based answers to such questions have practical application for fire management prioritization at Country and local levels.
2. Assessment of wildfire spatial patterns in Italy over a period of 8 years (2007-2014) to quantify fire occurrence and recurrence as a function of distance from built-up area.
3. Identify relevant human factors influencing long-term wildfire regime in Italy. By considering the latent relationship between local communities and the natural environment, it has been hypothesized that multiple anthropogenic factors impact differently the three dimensions of wildfires (frequency, intensity, severity) according to distinct territorial features, spatially-heterogeneous bio-physical conditions and the apparent (or latent) characteristics of local communities. Wildfire's regimes are supposed to be significantly affected by the intimate characteristics of complex socio-ecological systems, as defined by Redman et al. (2004). Based on this hypothesis, the present study identifies (and ranks the importance of) relevant human factors influencing long-term wildfire regimes in Italy at a spatially-detailed geographical scale
9
grounded on more than 8,000 municipal domains. A better understanding of the latent relationship with local socio-ecological systems allows evidencing the role of basic anthropogenic drivers affecting frequency, intensity and severity of wildfires, providing valuable information for fire risk assessment and contributing to decision-making in resource allocation for firefighting and prevention.
Figure 2: Issues and targets of the PhD thesis work
damage to
natural
resources
fire proneness
of woodland
types
management
prioritization
damage to
infrastructures
and settlements
wildfire
spatial
patterns
fire
prevention
relevant human
influence
wildfire
human
drivers
fire risk
assessment
10
2. Materials and methods
Study area
Italy is geographically located between 36° and 47°30’ North latitude and 5°30’ and 18°30’ East longitude, extending for 301,330 km2, 23% of which are classified as lowlands, 42% as uplands and 35% as mountainous land. Its complex orography is due to the presence of two main mountain ranges: the Alps in the North and the Apennines in the centre-south. Italian climate is highly variable following the latitudinal and altitudinal gradients and the distance from the sea, and generally ranges from Mediterranean warm to temperate cool.
Forest area is approximately 100,000 km2. Overall 32% of forest formations are included in the Alpine bio-geographical region, 16% in the Continental region, and 52% in the Mediterranean region (sensu the Habitat Directive of the European Commission 43/92). The most widespread forest formations are dominated by various oak species (Quercus spp.) and the European beech (Fagus sylvatica L.). A large portion of the broadleaved forests area is managed as coppices (Ciancio et al. 2006). Among conifers, the most widely represented forest types (sensu Barbati et al. 2014) are dominated by Norway spruce (Picea abies (L.) H.Karst.), followed by mountain pines (e.g., Pinus sylvestris L. and P. nigra J.F.Arnold) and Mediterranean pines (P. halepensis Mill., P. pinaster Aiton, and P. pinea L.). Mixed forests (sensu Bravo-Oviedo et al. 2014) are also widely spread.
Forest fires in Italy
Over the past 20 years, a total of 1,100,000 ha of forest land have been burnt in Italy. An average of 11,000 fires occur annually, devastating more than 50,000 ha of forests. The largest wildfires are concentrated in southern Italy and main islands (CFS 2014). This fact may explain why the few existing analyses on fire events mostly focus on southern Italy (e.g. Bajocco and Ricotta 2008). In northern Italy, wildfires occur mostly over the first quarter of the year (from January to March), a period when herbaceous vegetation is dry due to low temperatures and becomes prone to ignition; such a condition is especially common in the foothills of the Alps, up to 800 meters, and at high elevations in the Apennines. By contrast, in southern Italy the highest probability of wildfire occurrence is essentially in the third quarter of the year (from June to August); lack of rain (low level of soil moisture) and high air temperatures, possibly coupled with strong winds especially at an elevation up to 700 meters a.s.l., determine dry fuel
11
conditions favoring fire ignition and spread (Corona et al. 2015). Moriondo et al. (2006) found that future scenarios of climate change in Italy are expected to produce the highest increase in annual extreme events in all of Mediterranean Europe.
Data
Based on the perimeters of 33,504 single fires recorded from 2007 to 2014 and provided by the Italian National Forest Service (Corpo Forestale dello Stato, CFS), was compiled an 8-year fire history of Italy. The database contains all the fires that have been recorded by the CFS, and it was assumed that the dataset to be complete and reliable including even the smallest fires. The largest recorded size of burnt area was 10,550 ha, while the total burnt area during the study period was nearly 672,037 ha.
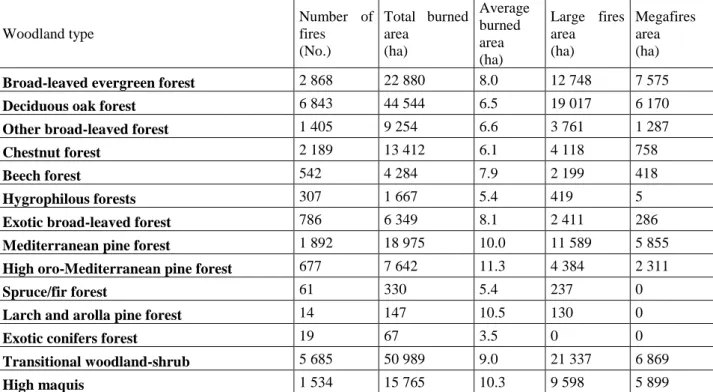
Corine Land Cover (CLC) database has been chosen as reference land cover map (CLC 2006; CLC 2012; EEA 2007). CLC is an European database in vector format available for the reference years 1990, 2000, 2006 and 2012; the minimum mapping unit is 25 ha and mapping technology is based on computer assisted visual interpretation of satellites images. CLC fourth hierarchical level, introduced in Italy since 2000, maps forest and semi-natural areas with a higher thematic detail compared to the standard CLC (ISPRA 2010), distinguishing, namely, the different physiognomies of woodland types reported in Table 1.
Woodland type Number of fires (No.) Total burned area (ha) Average burned area (ha) Large fires area (ha) Megafires area (ha)
Broad-leaved evergreen forest 2 868 22 880 8.0 12 748 7 575 Deciduous oak forest 6 843 44 544 6.5 19 017 6 170 Other broad-leaved forest 1 405 9 254 6.6 3 761 1 287
Chestnut forest 2 189 13 412 6.1 4 118 758
Beech forest 542 4 284 7.9 2 199 418
Hygrophilous forests 307 1 667 5.4 419 5
Exotic broad-leaved forest 786 6 349 8.1 2 411 286
Mediterranean pine forest 1 892 18 975 10.0 11 589 5 855 High oro-Mediterranean pine forest 677 7 642 11.3 4 384 2 311
Spruce/fir forest 61 330 5.4 237 0
Larch and arolla pine forest 14 147 10.5 130 0
Exotic conifers forest 19 67 3.5 0 0 Transitional woodland-shrub 5 685 50 989 9.0 21 337 6 869 High maquis 1 534 15 765 10.3 9 598 5 899
Table 1: Number of wildfires, total burned area, average burned area and contribution by large fires (i.e. >50 ha)
12
The forest High Resolution Layer (HRL) (FTY HRL 2012), including a 20-m resolution raster map of dominant leaf type provided by the Land-Copernicus environmental monitoring initiative carried out by the European Earth monitoring program (GMES), was used to distinguish forest fires from fires involving other non-urban land-use classes.
The Imperviousness Degree HRL (IMD HRL 2012), 20-m raster dataset, dated 2012 and provided by European Environment Agency, was used to identify built-up areas, referring to biophysical characteristics, and thus including roads, fabrics and settlements. The IMD map illustrates the spatial distribution of artificially sealed areas, including the level of soil sealing per area unit (IMD HRL 2012).
Four dummies were calculated for 7467 Italian municipalities classifying municipalities on the base of the occurrence (i) of at least one wildfire event during the study period, or (ii) a small fire (i.e. a fire smaller than the median size equal to 2,95 hectares), (iii) a large fire (> 50 hectares) or (iv) a mega fire (> 100 hectares). For the municipalities with at least a wildfire observed over the study period (n = 3831), other two variables were calculated: average burnt area per event (ha) and density of fires (number of events/km2), being log-transformed prior to analysis. Log-transformation may contribute to homogenize the statistical distribution of non-normal variables possibly improving model's and parameters' estimates.
A total of 39 variables supposed to influence fire regime directly and indirectly were derived from official data sources and classified under different typological domains (topography, agriculture, climate, disposable income, land-use, population, education and job market) affecting (directly or indirectly) wildfire regimes (Table 2). The selection of candidate variables quantifying anthropogenic factors associated to wildfire occurrence was based on an extensive literature review (Chuvieco et al. 2010; Koutsias et al. 2010; Loepfe et al. 2010; Moreira et al. 2010; Romero- Calcerrada et al. 2010; Oliveira et al.2012; Ortega et al. 2012; Michetti & Pinar 2013; Barros & Pereira 2014; Mourao & Martinho 2014; Oliveira et al. 2014; Oliveira et al. 2014b; Rodrigues et al 2014; Rodrigues & De La Riva 2014; Salvati & Ferrara 2014; Alvarez-Diaz et al. 2015; Chas-Amill et al. 2015; Gallardo et al. 2015; Gonzalez-Olabarria et al. 2015; Salvati & Ranalli 2015). Specific predictors assessing average climate characteristics were included in the following statistical analysis as control variables (e.g. Salvati et al. 2015). These 39 variables were standardized to minimize the impact of different measurement units in the analysis.
13
Acronym Name Theme Data source
Reference year
AC1 Road length/total area (km/km2) Accessibility Open Street Map 2016 AG1 Workers in primary sector (%) Agriculture Census of population 2011 AG2 Average size of farms (ha) Agriculture Census of agricolture 2010 AG3 Public-owned land in total agricultural area (%) Agriculture Census of agricolture 2010 AG4 Farms with a own web-site in total farms (%) Agriculture Census of agricolture 2010 AG5 Farms with organic crop in total farms (%) Agriculture Census of agricolture 2010 AG6 Livestock density (no. animals in grazed area (km2) Agriculture Census of agricolture 2010 CL1 Maximum air temperature of the warmest Month (°C) Climate WorldClim 1970-2000 CL2 Mean Temperature of Driest Quarter (°C) Climate WorldClim 1970-2000 CL3 Mean Temperature of Warmest Quarter (°C) Climate WorldClim 1970-2000 CL4 Precipitation of Driest Quarter (mm) Climate WorldClim 1970-2000 CL5 Precipitation of Coldest Quarter (mm) Climate WorldClim 1970-2000
LA1
Length of urban-forest contact in total landscape patch
perimeter (m/km2) Landscape Corine Land Cover 2012
LA2 Average patch size (ha) Landscape Corine Land Cover 2012 LA3 Average patch size/median patch size Landscape Corine Land Cover 2012 LA4 Coefficient of variation of patch size Landscape Corine Land Cover 2012 LA5 Perimeter to area patch ratio (km/km2) Landscape Corine Land Cover 2012 LA6 Pielou's eveness index of landscape diversification Landscape Corine Land Cover 2012 LU1 Built-up area (CLC code: 1.xx) in total area %) Land-use Corine Land Cover 2012
LU2
Dispersed urban area (CLC code: 112) in total urban area (%)
Land-use
Corine Land Cover 2012 LU3 Coniferous forests (CLC code: 311) in total forest area Land-use Corine Land Cover 2012 LU4 Forest land (CLC code: 3.1x) in total area Land-use Corine Land Cover 2012 EC1 Inequality in personal income (Gini Index) Income Ministry of Finance 2012 EC2 Average per-capita income Income Ministry of Finance 2012 PO1 Non-native inhabitants in total residents (%) Population Census of population 2011 PO2 Average family size Population Census of population 2011 PO3 Resident inhabitants per dwelling Population Census of population 2011
PO4 Illiterates or uneducated people in total residents (%)
Education and job
market Census of population 2011
PO5 Graduates in total inhabitants (%)
Education and job
market Census of population 2011
PO6 Activity rate (workforce in total inhabitants)
Education and job
market Census of population 2011
PO7 Unemployment rate (unemployed in total workforce)
Education and job
market Census of population 2011 PO8 Male to female ratio Population Census of population 2011 PO9 Workers in industry in total workers Population Census of population 2011 PO10 Job commuting in total inhabitants (%) Population Census of population 2011 PO11 Inhabitants in urban centres in total residents (%) Population Census of population 2011 PO12 Inhabitants in scattered houses in total residents (%) Population Census of population 2011
14
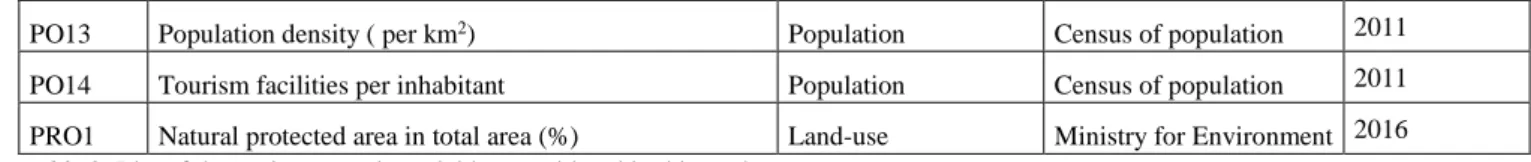
PO13 Population density ( per km2) Population Census of population 2011 PO14 Tourism facilities per inhabitant Population Census of population 2011 PRO1 Natural protected area in total area (%) Land-use Ministry for Environment 2016
Table 2: List of the socioeconomic variables considered in this study.
Data processing
A GIS operation of geometric intersection was carried out between 2007-2011 wildfire perimeters and CLC 2006 geodataset and between 2012-2014 wildfire perimeters and CLC 2012 geodataset. The same method, using CLC 2006 only, was applied to identify repeatedly burned areas in the period 2007-2014.
Following San-Miguel-Ayanz et al. (2013), in this work was considered large fires those larger than 100 hectares and megafires those larger than 500 hectares. In order to locate WUI fires, a buffer zone of 200 meters from urban settlements has been delineated, according to the distance defined at national level for human settlements protection by the Italian Civil Protection Department (Presidenza Consiglio Ministri 2007). A similar definition of WUI has been adopted by other Mediterranean Countries (e.g. Modugno et al. 2016).
Burned Area Selection Ratio (BASR) index has been chosen to measure wildfires incidence by woodland type. BASR is defined as the ratio between percentage of burned area of a given woodland type compared to the total burned woodland area and the percentage of the area of the woodland type compared to the total woodland area:
𝐵𝐴𝑆𝑅 =𝐴𝑏/𝑇𝑏 𝐴𝑟/𝑇𝑟
where 𝐴𝑏 is the burned area of the considered woodland type, 𝑇𝑏 is the total burned woodland
area, 𝐴𝑟 is the area of the considered woodland type and 𝑇𝑟 is the total woodland area.
BASR is founded on the principle of resource selection function (for previous relevant applications to forest fires, see e.g. Bajocco and Ricotta 2008, and Pezzati et al. 2009). If BASR for a given woodland type equals 1, then that type burned in proportion to its availability on the territory. If BASR is higher than 1, the type burned more often than expected due to chance, thus indicating fire preference. Conversely, if BASR is lower than 1, the type burned less than expected (i.e. fire avoidance).
BASR has been also used here for characterizing large fires and megafires and for fire recurrence analysis. In the first two cases, numerator consists of the ratio between burned area of woodland type and total woodland burned area of a given kind of fires. In the case of fire
15
recurrence, numerator consists of the ratio between area affected by repeated burning of a given woodland type and the total area affected by repeated burning in woodlands.
To assess the frequency and incidence of forest fire occurrence and recurrence the following analysis were carried out:
(i) It was created the distance raster from the built-up areas (i.e. pixels with imperviousness > 0%); for each fire polygon of the collected geodataset (see section above) was calculated the minimum value of the raster to assess the frequency distribution of fires according to 100-m distance class intervals from built-up areas; then, the frequency values were normalized with the forest area (i.e. fuel availability) present in the distance class. The mean value of the raster in fire polygons was used to assess the average burnt area according to the same distance classes from built-up areas;
(ii) for each forest polygon of the CLC map (CLC class 31) affected by fire, it has been estimated: the total area of the polygon, burnt area and incidence as the ratio between burnt area and the total area of the polygon; the mean incidence values for each distance class (100-m interval) from built-up areas was assessed;
(iii) to assess forest fire recurrence, we selected polygons where fire events occurred at least twice between 2007 and 2014 and estimated the frequency and incidence of recurring fires according to distance class (100-m ramp) from built-up areas.
A contour plot was used to investigate the spatial relationships between fire incidence and distance from built-up areas, including also elevation as a relevant influential factor, as mentioned in the Introduction. A contour plot diagram for a function of two variables is a curve connecting points where the function has the same value.
Lastly, Spearman's r nonparametric correlation analysis was used to assess apparent relationships between fire incidence and landscape variables (elevation and distance from built-up areas).
Based on the assumption that local-scale wildfire regimes and the underlying socioeconomic context are characterized by spatially heterogeneous attributes (Salvati et al., 2015), comparison of quantitative approaches modeling different functional forms and relationships between wildfires’ attributes (intended as the dependent variable) and the socioeconomic profile of local communities is considered an effective strategy to identify relevant independent variables influencing local-scale fires’ regimes (Viedma et al., 2009). A logistic regression (Hosmer et al. 2013) was run to assess impact of the considered independent variables on the probability of wildfires. This kind of regression has been widely used to model fire occurrence (e.g.
16
Chuvieco et al. 2010; Moreira et al. 2010; Badia et al. 2011; Padilla & Vega-Garcia 2011; Vilar et al. 2011; Verdu et al. 2012; Costafreda-Aumedes et al. 2013; Ganteaume & Jappiot 2013; Fernandes et al. 2014; Barbati et al. 2015; Gallardo et al. 2015). Logistic regression is based on the following function:
𝑓(𝑍𝑖) = 1 1 + 𝑒−𝑍𝑖
where the 𝑓(𝑍𝑖) value estimates the probability of occurrence of a certain binary outcome (in our case, a dummy variable of fire occurrence indicating presence (1) of at least one event during the entire time series in each studied municipality) and 𝑍𝑖 is a linear function of the 39 independent variables. Four separate models estimating maximum likelihood parameters were run to identify the most relevant variables influencing occurrence of (i) fire events, (ii) small fires, (iii) large fires and (iv) megafires (section 2.2). A step-wise logistic approach was adopted for each regression to select relevant variables that affect fire occurrence according to a probability threshold (p=0.05). AUC (Area Under the Curve) of the Receiver Operating Characteristic (ROC) was used as measure of logistic model accuracy (Fawcett 2006).
A multivariate approach comparing outputs of various exploratory approaches modeling different relationships between the dependent variable and the independent predictors was used to identify (and rank the importance of) candidate factors affecting (i) fires density and (ii) average burnt area as dependent variables. Models' choice was based on a literature review of econometric fire modeling (Sebastian-Lopez et al. 2008; Viedma et al. 2009; Costa et al. 2011, Oliveira et al. 2012; Nunes 2012; Chas-Amill et al. 2015; Marques et al. 2011; Barros and Pereira 2014; Silva et al.2015). Four models basing on both parametric and non-parametric methodologies were selected and developed in this study:
(i) an Ordinary Least Square model estimating linear relationship between the dependent variable and predictors; linear regression has been extensively adopted in fire modeling (e.g. Sebastian-Lopez et al. 2008; Viedma et al. 2009; Costa et al. 2011, Oliveira et al. 2012; Nunes 2012);
(ii) an interval regression (considering separately 0.25, 0.5 and 0.75 quantile intervals) using interval data for the dependent variable (Davidson & MacKinnon 2004; Wooldridge 2013); (iii) a quantile regression (Koenker and Bassett, 1978), a methodology used in fire modeling (e.g. Boer et al. 2009; Barros and Pereira 2014; Dennison et al. 2014) to estimate non-linear
17
impacts of predictors on selected quantiles of the wildfires' dependent variable (0.25, 0.5 and 0.75 quantiles were considered in this study);
(iv) a Generalized Linear Model (e.g. McCullagh & Nelder 1989; Marques et al. 2011; Silva et al. 2015) assuming the response variables (Y) to be mutually independent, with expectation related to a linear predictor E [Y] = g-1 (dTβ), where β is a vector of unknown regression
parameters, d is a vector of known dependent covariates and g is a known function called the link function. The link function relates the linear predictor and the mean of the distribution function. In this work we applied four functions (Gaussian, inverse Gaussian, negative binomial and Poisson) for the dependent variables and a log function as link.
The selected models allow estimation of both linear and non-linear relationships between each dependent variable and a wide set of predictors, under both compliance and relevant deviation from normality. For each statistical method tested in this study, the best-fit model’s parameter estimate was obtained from stepwise forward selection of predictors, with statistical significance threshold fixed at p <= 0.05.
It has to be stressed that a comparative approach based on the use of different (parametric and non-parametric) statistical methods modeling linear and non-linear relationships of variables with more or less evident deviations from normality – a condition typical of both wildfires’ and socioeconomic attributes - allows an internal validation of models outcomes’ stability (Salvati et al. 2015), based on the research hypothesis formulated in the Introduction. While presenting different goodness-of-fit according to the most representative statistical approach for the dependent and independent variables, stable outputs of the selected models were expected to provide comparable results, identifying the same relevant variables with similar coefficients (intensity and signs).
18
3. Results
Fire proneness of woodland types
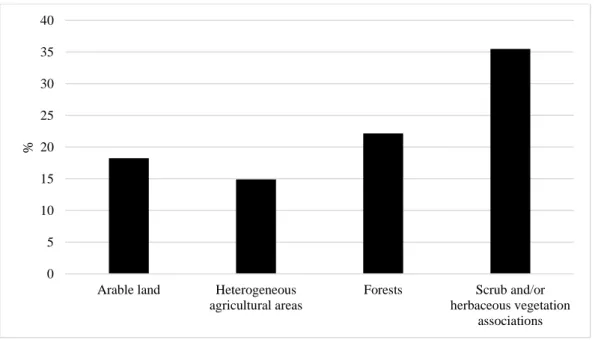
Since 1970, in Italy 46% of wildfires has occurred in the woodlands, with an annual mean surface of 48 700 ha. Annual mean number of fires has been 8700, with a decrease of about one third since 2 000 compared to previous decades. The most critical situations were recorded in 1985 for the number of fires (18 664) and in 2007 for the wooded burned area (116 602 ha). During the period covered by the time series of available wildfire geodatasets (2007-2014), the total burned area is 672,037 ha, corresponding to 2.4% of the land in Italy. The most fire-affected land cover class is scrub and/or herbaceous vegetation associations (35%), while forests represent 22% of the burned area (Fig.3).
Figure 3: Share of total burned area by land cover class in the period 2007-2014.
Between 2007 and 2014 fires have affected all woodland types. According to Mann Kendall non-parametric test (Kendall 1975), statistically significant decreasing trends (p<0.05) have occurred in most woodland types as concern total burned area, number of fires and average area of fires. Exotic broad-leaved forest and Mediterranean pine forest do not show any trend for total burned area and number of fires.
The incidence of fires varies substantially across woodland types (Tab.1). In absolute terms, transitional woodland-shrub and deciduous oak forest have recorded the highest values both in
0 5 10 15 20 25 30 35 40
Arable land Heterogeneous agricultural areas
Forests Scrub and/or herbaceous vegetation
associations
19
terms of number of wildfires (5 685 and 6 843, respectively) and of total burned area (50 989 and 44 544 hectares, respectively). Larch and arolla pine forest and high oro-Mediterranean pine forest present the highest value of average burned area (10.5 and 11.3 hectares, respectively).
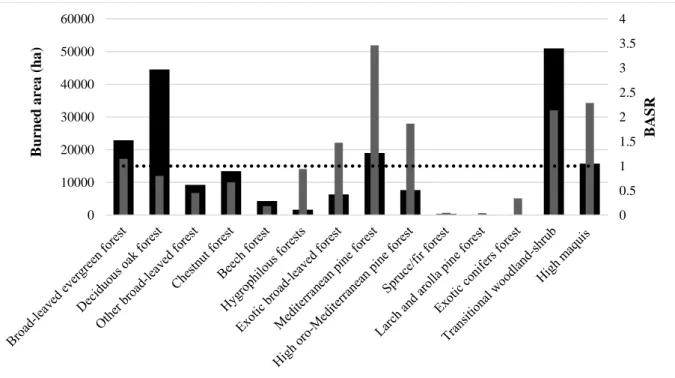
BASR ranges from 0.04 to 3.46 (Fig.4). The rate of fire incidence in deciduous oak, hygrophilous and broad-leaved evergreen forest types is balanced with their land coverage, with a BASR value close to 1, while wildfire shows a strong preference for Mediterranean pine forest (BASR 3.46) and, to a lesser extent, high maquis, transitional woodland-shrub and high oro-Mediterranean pine forest (BASR around 2). Spruce/fir and larch and arolla pine forest are the least affected types, in both absolute and relative terms.
Figure 4: Burned area (black histogram) and BASR values of burned area (grey histogram) by woodland type; the dashed line
represents BASR=1.
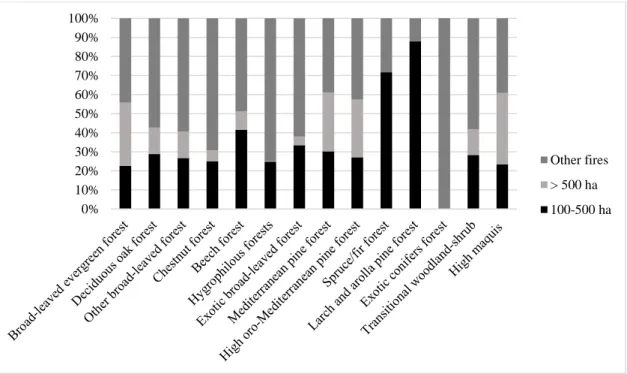
During the 2007-2014 period, 1 023 large fires (i.e. fire size >100 ha), corresponding to 317 996 hectares, have occurred in Italy and 115 of these are megafires (i.e. fire size >500 ha), corresponding to 142 946 hectares. Although large fires account for 2.3% of total fires, they represent the 47 % of total burned area. Similarly, megafires represent 0.25% of total fires, but 21 % of total burned area. Table 1 and Figure 5 highlight a breakdown by woodland types of the total area affected by largefires and megafires with respect to total burned area. Transitional
0 0.5 1 1.5 2 2.5 3 3.5 4 0 10000 20000 30000 40000 50000 60000 B ASR B urned a re a ( ha )
20
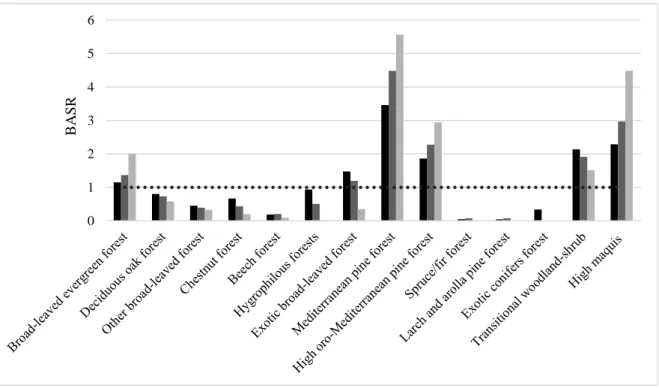
woodland-shrub, deciduous oak forest and broad-leaved evergreen forest are the woodland types most affected by extensive fires. In Mediterranean pine forests, high maquis, spruce/fir forests and larch and arolla pine forests the contribution of large and megafires exceeds 60 % of total burned area (Fig. 5). A comparison amongst the BASR values referred to total fires, large fires and megafires is shown in Figure 6. In the case of Mediterranean pine forest, high oro-Mediterranean pine forest and high maquis and transitional woodland-shrub all such values are greater than 1, and even much higher in the case of megafires and large fires, except for transitional woodland-shrub.
Figure 5: Contribution of large fires and megafires to the total burned area by woodland type.
0% 10% 20% 30% 40% 50% 60% 70% 80% 90% 100% Other fires > 500 ha 100-500 ha
21
Figure 6: BASR values of burned area (black histogram), BASR values of large fires (dark grey histogram) and BASR values
of megafires (light grey histogram) by woodland type; the dashed line represents BASR=1.
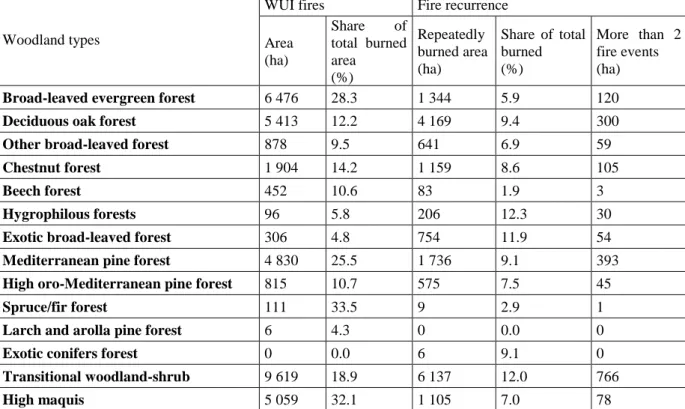
Overall, 5 411 woodland fire events, for a total of 143 850 hectares, have affected WUI space. These events represent 21% of total burned area and 12% of fire events number. Broad-leaved evergreen forest, transitional woodland-shrub, deciduous oak forest and high maquis have the highest values in terms of burned area (Tab. 3). The contribution to the total burned area is higher than 20% in high maquis, spruce/fir forest, broad-leaved evergreen forest and Mediterranean pine forest types.
0 1 2 3 4 5 6 B A SR
22
Woodland types
WUI fires Fire recurrence Area (ha) Share of total burned area (%) Repeatedly burned area (ha) Share of total burned (%) More than 2 fire events (ha)
Broad-leaved evergreen forest 6 476 28.3 1 344 5.9 120
Deciduous oak forest 5 413 12.2 4 169 9.4 300
Other broad-leaved forest 878 9.5 641 6.9 59
Chestnut forest 1 904 14.2 1 159 8.6 105
Beech forest 452 10.6 83 1.9 3
Hygrophilous forests 96 5.8 206 12.3 30
Exotic broad-leaved forest 306 4.8 754 11.9 54
Mediterranean pine forest 4 830 25.5 1 736 9.1 393
High oro-Mediterranean pine forest 815 10.7 575 7.5 45
Spruce/fir forest 111 33.5 9 2.9 1
Larch and arolla pine forest 6 4.3 0 0.0 0
Exotic conifers forest 0 0.0 6 9.1 0
Transitional woodland-shrub 9 619 18.9 6 137 12.0 766
High maquis 5 059 32.1 1 105 7.0 78
Table 3: Burned areas in the Wildland-Urban Interface and fire recurrence by woodland type.
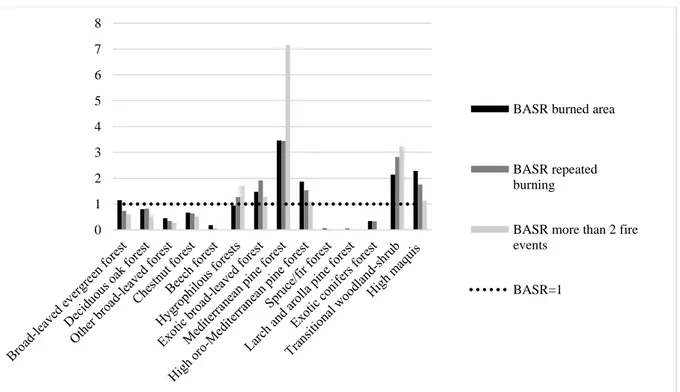
As shown in Figure 7, fire recurrence is a phenomenon that affects primarily scrub and/or herbaceous vegetation physiognomies (44%), but also a significant proportion of forests (18%). During the eight years covered by the time series, 19 396 hectares of woodlands have been affected by at least two fire events (9% of the woodlands burned area), of which 2 038 hectares burned more than twice (0.95% of woodland burned area). Larch and arolla pine forest type, spruce/fir forest and exotic conifers forest types are negligibly affected by fire recurrence, while transitional woodland-shrub is the most affected type (6 137 hectares), followed by deciduous oak forests (4 169 hectares), in the case of forest areas burned twice, and by Mediterranean pine forests (393 hectares) in the case of areas with more than two fire events (Tab. 3). The contribution of repeatedly burned area to total burned area is greater than 10% in transitional woodland-shrub, Mediterranean pine forests and hygrophilous forests. Mediterranean pine forest presents the highest values of BASR (i.e. 3.4), in terms of repeatedly burned area (Fig. 8), followed by transitional woodland-shrub and exotic broad-leaved forest (respectively, BASR = 2.8 and BASR = 1.9). In the case of area with more than two fire events Mediterranean pine forests are by far the most affected (BASR = 7.2), followed by transitional woodland-shrub (BASR = 3.2). 75 % of large fires and 86% of megafires have been affected by fire recurrence. Repeated burning affects 12% and 9% of the areas burned by large fires and megafires, respectively.
23
Figure 7: Share of total repeatedly burned area by land cover class in the period 2007-2014.
Figure 8: BASR values of total burned area (black histogram), BASR values of total repeatedly burned area (dark grey
histogram) and of repeatedly burned area with more than 2 fire events (light grey histogram) by woodland type; the dashed line represents BASR=1. 0 5 10 15 20 25 30 35 40 45 50
Arable land Heterogeneous agricultural areas
Forests Scrub and/or herbaceous vegetation associations % 0 1 2 3 4 5 6 7 8
BASR burned area
BASR repeated burning
BASR more than 2 fire events
24
Wildfire spatial patterns
Fire size (Fs) distribution in the 2007-2014 time interval is significantly explained by a power-law statistical function (PLSF) over many orders of magnitude, as shown for other case studies, e.g. by Malamud et al. (1998) and by Ricotta et al. (1999).The PLSF revealed that 24,347 events are less than 10 ha in size and only 996 fires extend to more than 100 ha; however, even if these last fires constitute less than 3% of the total fires recorded in Italy, they account for 47% of the total area burnt between 2007 and 2014 (Fig. 9).
Figure 9: Normalized frequency-size statistics of forest fires in Italy within the 2007-2014 time interval. The x-axis Fs indicates
burnt area and the y-axis ƒ(Fs) represents normalized frequency densities.
The distribution of forest fires by distance class from built-up areas (Fig. 10) shows a similar trend for both occurrence and recurrence of forest fires. The frequency of fire occurrence decreases as the distance from built-up areas increases, e.g. from 34% (100 m) to 13% (200 m). Fire recurrence decreases from 21% (100 m) to 15% (200 m). More than 70% of the fire events occur within 500 m from built-up areas, while more than 70% of the recurring fires are within 600 m from built-up areas.
25
Figure 10:Relative frequency of forest fire events according to distance class from the built-up areas normalized with forest
area values.
Fig. 11 shows the spatial variations in fire frequency by elevation. Fire frequency decreases as elevation increases. Fire occurrence and recurrence are extremely high up to 400 m a.s.l., and overall, 74% of forest fires and 77% of the recurring fires occur at elevations below 600 m a.s.l.
Figure 11:Relative frequency of forest fire events by elevation classnormalized with forest area values.
0 0.00005 0.0001 0.00015 0.0002 0.00025 0.0003 100 200 300 400 500 600 700 800 900 1000 1100 1200 1300 1400 Sta nd a rdized fre qu ency ( %/k m 2) Distance (m) Fire occurrence Fire recurrence 0 0.00005 0.0001 0.00015 0.0002 0.00025 100 200 300 400 500 600 700 800 900 1000 1100 1200 Sta nd a rdized fre qu ency ( %/k m 2) Elevation (m) Fire occurrence Fire recurrence
26
Forest fire incidence shows a more dispersed pattern at increasing distances from built-up areas (Fig. 12). However, the highest values of fire incidence (i.e., 15-20% for fire occurrence and 12-14% for fire recurrence) are observed at distances >1000 m; by contrast, the lowest values (i.e. <10% for fire occurrence and <3% for fire recurrence) are found within 200 m from built-up areas. This trend is also reflected by the distribution of average burnt area per event with respect to distance from built-up areas (Fig. 13).
27
Figure 13:Mean values of burnt area per event according to distance class from the built-up areas.
The share of forest lands affected by single or repeated burning decreases as elevation increases. Fire incidence ranges between 12% and 15% up to an elevation of <700 m, being systematically lower than 10% at an elevation of >1200 m a.s.l.; fire recurrence reaches the highest values in correspondence of the 100, 200 and 300 m a.s.l. elevation classes (13.7%, 9.1% and 8.5%, respectively) and the lowest values (<2%) above 1200 m a.s.l.
Figure 14 illustrates the values of fire incidence considering both distance from built-up areas and elevation. The contour plot shows areas where forest fire incidence reaches maximum values, i.e. at an elevation of approximately 800 m and a distance of 1800 m from built-up areas. Other critical values have been found for elevations less than 550 m and distances from built-up areas greater than 1800 m.
28
Figure 14:Contour plot diagram where fire incidence is shown as a function of elevation and distance from built-up areas.
In the case of fire recurrence incidence (Fig. 15), the highest values are recorded at an elevation of about 600 m and a distance of 2700 m from built-up areas.
Figure 15:Contour plot diagram where fire recurrence incidence is shown as a function of elevation and distance from
29
There is a positive statistical association between distance from built-up areas and both fire incidence (rs = 0.12, p < 0.05), fire recurrence incidence (rs = 0.07, p < 0.05) and average burnt area per event (rs = 0.27, p < 0.05). A negative association between elevation and fire incidence (rs = -0.10, p < 0.05) and fire recurrence (rs = -0.11, p < 0.05) can also be observed too.
Wildfire human drivers
A total of 44,341 fires were recorded in the study period (2007-2014) with a total burnt area approaching 672,000 ha, and an average size of wildfires slightly above 15 ha; the largest fire recorded extends over 10,550 hectares. The spatial distribution of the selected fire attributes is largely heterogeneous (Figure 16).
30
Figure 16: Study area, striped areas have missing values. a - Wildfires vector geodataset; b - Presence/absence (Legend 1) data
for the investigated municipalities; c - Average burned area variable divided into quartiles (Legend 2) for the investigated municipalities; d – Number of fires (n/km2) variable divided into quartiles (Legend 2) for the investigated municipalities.
Table 4 shows the results of logistic regressions established for the four dependent variables. The considered types of wildfires (i.e. small fires, large fires, mega fires, all fires) are characterized by a variable number of significant covariates. All the models have acceptable values of R2 (between 0.31 and 0.41) and good values of area under ROC curve (between 0.87 and 0.89). The model encompassing all fires has the best goodness of fit; the stepwise forward algorithm selected 23 variables with 20 variables being highly significant (p < 0.01). The most influential socioeconomic variables are LA4, LA6, LU4, PO4 and PO7 (positive coefficients) and LU1 LA3 and PO2 (negative coefficients). LA2, LA4, LA6 and LU4 (positive coefficients)
31
and LA2, LU1 and PO1 (negative coefficients) are the most relevant variables explaining small fires occurrence in the Italian municipalities. For this dependent variable the stepwise algorithm have selected 20 variables, all of them are highly significant (p < 0.01). The stepwise approach has selected 22 significant covariates for large fires: LA4, PO10 and PO7 with the highest positive coefficients and LA2, LU1 and PO6 with the highest negative coefficients. For the mega fires model, 19 variables have been selected; all of them are highly significant with exception of AG4 (p < 0.05). LA4, PO7 and PO10 have positive influence and LA3, LU1, and PO6 negative influence. Overall, LA4, LA6, LU1, PO1, PO14, PO7 and PRO1 prove to be significant variables in all the established models, with the same sign across the models. In all the models, climate variables are relatively important.
32
Variable
Fires Small fires Large Fires Mega Fires
Coeff p Coeff p Coeff p Coeff p Constant -0.03 -0.61 ** -2.86 ** -3.46 ** AC1 / / / -0.18 ** AG1 / / -0.22 ** -0.15 ** AG2 -0.15 ** -0.19 ** / / AG3 / -0.10 ** / / AG4 / / -0.30 ** -0.29 * AG5 / / / / AG6 / / / / CL1 0.65 ** 0.54 ** 0.43 * 0.54 ** CL2 0.59 ** 0.56 ** 0.38 ** 0.42 ** CL3 -0.92 ** -0.76 ** -0.62 ** -0.80 ** CL4 -0.64 ** -0.60 ** -0.90 ** -0.96 ** CL5 / / / / EC1 / 0.11 ** / / EC2 / / -0.29 ** / LA1 / / 0.19 ** / LA2 -0.23 -0.487 ** -0.87 ** / LA3 -0.39 * / / -0.82 ** LA4 0.55 ** 0.48 ** 0.49 ** 0.39 ** LA5 0.11 ** 0.08 * / / LA6 0.40 ** 0.34 ** 0.25 ** 0.20 ** LU1 -0.48 ** -0.29 ** -0.72 ** -0.58 ** LU2 0.27 ** 0.24 ** / / LU3 / / / / LU4 0.59 ** 0.58 ** 0.09 / PO1 -0.21 ** -0.22 ** -0.16 * -0.23 ** PO10 0.34 ** / 0.63 ** 0.57 ** PO11 / / -0.09 * / PO12 / / -0.10 * -0.15 ** PO13 / -0.23 ** / / PO14 0.08 * 0.16 ** 0.12 ** 0.17 ** PO2 -0.33 ** / / -0.23 ** PO3 / / -0.20 ** / PO4 0.42 ** 0.14 ** / / PO5 0.11 ** / / / PO6 -0.18 ** / -0.47 ** -0.53 ** PO7 0.42 ** 0.28 ** 0.38 ** 0.39 ** PO8 / / / / PO9 / / / / PRO1 0.13 ** 0.13 ** 0.12 ** 0.11 ** Pseudo R2 0.41 0.35 0.34 0.31 Log likelihood -3050 -3303 -2248 -1834 Area under ROC 0.895 0.871 0.884 0.882
33
Table 4: Results of the four step-wise logistic regression models relating presence (or absence) of wildfires over the study
period (2007-2014) to multiple factors profiling the local socioeconomic context in Italy at the spatial scale of local municipalities.
Results of the considered statistical models for the prediction of average burned area and fires density are reported in Tables 5 and 6. Significant negative coefficients are attributed to LU1, PO12 and PO6 in almost all the models with average burned area as dependent variable; positive coefficients are attributed to AG3, LA4, PO10 and PO7. For the fires density variable, the variables significant in almost all the models (negative sign) are AG1, AG3, EC1, EC2, LA4, PO6 and PO9, while those with positive sign are AC1, LA1, LA6, PO10 and PO7. Overall, fires density models reveal best fitting results and are characterized by more significant variables compared to average burned area models. In both cases linear models are the best models in terms of adjusted R2 and loglikelihood. An overall comparison of the influence of socioeconomic variables under model predicting fire occurrence, fire density and average burned area is reported in Table 7.
34
Variable Lin Reg Int Reg
Quantile regression GLM Q 0.25 Q 0.5 Q 0.75 Gauss - Log Inv Gauss - Log Neg Bin -
Log Pois - Log Coeff p Coeff p Coeff p Coeff p Coeff p Coeff p Coeff p Coeff p Coeff p
Constant 0.00 3.17 ** -0.47 ** 0.02 0.53 ** 2.26 ** 2.43 ** 2.33 ** 2.32 ** AC1 -0.06 ** -1.98 ** -0.05 * -0.09 ** -0.05 * / -0.19 ** -0.11 ** -0.11 ** AG1 / / / / / / -0.19 ** -0.08 ** -0.06 ** AG2 / / 0.04 * / 0.07 ** / 1.35 ** / -0.02 ** AG3 0.05 ** 0.94 * 0.05 ** 0.05 ** 0.04 * 0.07 ** 0.15 ** 0.07 ** 0.06 ** AG4 -0.06 ** -1.62 ** -0.10 ** -0.06 ** -0.11 ** -0.14 ** -0.15 ** / -0.05 ** AG5 / 1.19 ** 0.04 * 0.02 0.04 * / / / -0.02 ** AG6 / / / / / / -0.04 * -0.04 * -0.06 ** CL1 / / / / / / / / 0.18 ** CL2 0.07 ** / 0.13 ** 0.13 ** / / / / / CL3 / / / / / / / / -0.17 ** CL4 / -1.77 ** -0.16 ** -0.15 ** / / -0.12 * / / CL5 / / 0.15 ** 0.15 ** / / / / -0.06 ** EC1 / / / / / / / / 0.05 ** EC2 / -2.43 ** -0.09 * / / -0.19 ** -0.10 ** -0.17 ** -0.21 ** LA1 / / / 0.04 * / / / / 0.05 ** LA2 / / / / / / -0.06 ** / -0.03 ** LA3 -0.04 ** -0.97 * / -0.02 -0.05 * / / -0.09 ** -0.06 ** LA4 0.12 ** 3.35 ** 0.14 ** 0.11 ** 0.09 ** 0.08 * / 0.11 ** 0.09 ** LA5 / / -0.04 * / -0.03 / / / / LA6 0.04 ** 1.58 ** / 0.03 * 0.03 0.09 ** / 0.09 ** 0.10 ** LU1 -0.10 ** -2.55 ** -0.07 ** -0.09 ** -0.11 ** -0.32 ** / -0.24 ** -0.25 ** LU2 / / / -0.05 ** / / / / -0.02 ** LU3 / / / / / / 0.11 * 0.06 ** 0.06 ** LU4 -0.07 ** -2.34 ** / -0.09 ** -0.10 ** -0.20 ** / -0.16 ** -0.18 ** PO1 -0.05 ** / / -0.05 * / / / -0.07 ** -0.08 ** PO10 0.14 ** 6.14 ** 0.16 ** 0.17 ** 0.20 ** / -0.01 0.14 ** 0.12 ** PO11 -0.04 * / / / -0.06 ** -0.10 ** / -0.05 ** -0.08 ** PO12 -0.06 ** -1.28 ** / -0.05 ** -0.04 * -0.10 * -0.10 ** -0.13 ** -0.15 ** PO13 / / / / / / / 0.08 ** 0.06 ** PO14 / / / / / / / / / PO2 / / / -0.06 ** / / / / / PO3 -0.08 ** -2.62 ** -0.03 / -0.10 ** / / -0.12 ** -0.13 ** PO4 / / / 0.04 / -0.21 ** / -0.12 ** -0.15 ** PO5 / 1.94 ** 0.08 ** 0.05 ** / -0.10 * / -0.05 * -0.06 ** PO6 -0.21 ** -7.21 ** -0.20 ** -0.22 ** -0.26 ** -0.23 ** -0.24 ** -0.23 ** -0.20 ** PO7 0.17 ** 5.80 ** 0.18 ** 0.14 ** 0.18 ** 0.07 * / 0.11 ** 0.07 ** PO8 / / / / / -0.08 ** / -0.06 ** -0.05 ** PO9 / / / / / / -0.08 / 0.03 ** PRO1 / / / / / 0.09 ** / 0.05 ** 0.08 ** Adj R2 0.17 0.16 0.14 0.13 0.09 Log lik. -5065 -5426 -17665 -17081 -12944 -41079
Table 5: Results of the regression model identifying the most relevant socioeconomic predictors for average burned area at the
35
Variable Lin Reg Int Reg
Quantile regression GLM Q 0.25 Q 0.5 Q 0.75 Gauss - Log Inv Gauss - Log Neg Bin -
Log Pois - Log Coeff p Coeff p Coeff p Coeff p Coeff p Coeff p Coeff p Coeff p Coeff p
Constant 0.00 3.03 ** -0.51 ** 0.01 0.53 ** -1.74 ** -1.18 ** -0.98 ** -0.72 ** AC1 0.14 ** 3.64 ** 0.15 ** 0.13 ** 0.13 ** 0.10 ** 0.22 ** / 0.21 ** AG1 -0.13 ** -2.76 ** -0.11 ** -0.12 ** -0.15 ** -0.32 ** -0.14 ** -0.11 ** / AG2 / / -0.03 0.03 / -1.65 ** / / / AG3 -0.06 ** -1.96 ** -0.06 ** -0.06 ** -0.06 ** / -0.10 ** -0.13 ** -0.36 ** AG4 / / / -0.03 / / / / / AG5 -0.03 * -0.92 * / -0.04 * -0.04 * -0.29 ** / / / AG6 / / / / / / / / / CL1 / / 0.15 * / / 0.81 ** 0.47 ** / 0.25 ** CL2 0.07 * 1.34 / / 0.08 1.69 ** 0.10 ** / / CL3 0.15 ** 4.50 ** 0.36 ** 0.26 ** / 1.50 ** 0.66 ** 0.54 ** 0.22 ** CL4 -0.37 ** -9.21 ** -0.29 ** -0.33 ** -0.53 ** -1.52 ** -0.43 ** -0.42 ** -0.55 ** CL5 0.29 ** 7.87 ** 0.19 ** 0.25 ** 0.36 ** 1.48 ** 0.55 ** 1.03 ** 0.66 ** EC1 -0.07 ** -1.54 ** -0.05 * -0.08 ** -0.06 ** -0.13 ** -0.10 ** / -0.15 ** EC2 -0.18 ** -4.39 ** -0.12 ** -0.19 ** -0.19 ** -0.27 ** -0.09 ** / -0.18 ** LA1 0.09 ** 2.09 ** 0.09 ** 0.07 ** 0.07 ** 0.08 ** 0.20 ** 0.99 ** / LA2 0.04 ** / / 0.03 * / 0.09 ** / / 0.10 ** LA3 / / / / 0.04 * / / 0.18 ** / LA4 -0.13 ** -3.02 ** -0.12 ** -0.12 ** -0.14 ** -0.18 ** -0.18 ** -0.21 ** -0.18 ** LA5 -0.04 * -1.67 ** / -0.05 ** / / -0.14 ** / / LA6 0.13 ** 3.62 ** 0.15 ** 0.11 ** 0.13 ** 0.06 ** 0.15 ** 0.39 ** / LU1 / -1.27 * / / / -0.06 ** / -0.05 ** / LU2 -0.03 * / -0.05 ** / -0.05 * / -0.11 ** / -0.12 ** LU3 -0.03 * / / / -0.04 * -0.04 ** -0.11 ** / -0.09 ** LU4 0.07 ** 1.83 ** 0.07 ** 0.12 ** / / / / / * PO1 -0.10 ** -2.91 ** -0.11 ** -0.12 ** -0.07 ** -0.11 ** -0.07 ** -0.17 ** / PO10 0.12 ** 2.86 ** 0.10 ** 0.12 ** 0.19 ** / 0.15 ** 0.21 ** 0.14 ** PO11 / / / / / / -0.07 ** -0.15 ** -0.05 ** PO12 / / / / / / / -0.11 ** / PO13 -0.05 ** / -0.06 ** / / / -0.11 ** -0.21 ** -0.09 ** PO14 0.05 ** 1.19 ** / / 0.08 / / / / PO2 / / / / / -0.36 ** / / / PO3 / / / / / 0.44 ** 0.11 ** 0.22 ** 0.43 ** PO4 -0.05 * -1.09 -0.06 * -0.05 * / -0.10 ** -0.10 ** / / PO5 0.06 ** 1.52 ** / 0.06 * 0.07 ** 0.08 ** / / 0.14 ** PO6 -0.13 ** -3.33 ** -0.12 ** -0.10 ** -0.19 ** -0.08 ** -0.32 ** -0.23 ** -0.10 ** PO7 0.23 ** 6.03 ** 0.22 ** 0.22 ** 0.21 ** 0.08 ** 0.56 ** / 0.37 ** PO8 0.08 ** 1.66 ** 0.05 ** 0.06 ** 0.11 ** 0.06 ** 0.13 ** / / PO9 -0.09 ** -2.69 ** -0.08 ** -0.12 ** -0.12 ** -0.19 ** -0.19 ** / -0.32 ** PRO1 / / / / / 0.05 ** / / / Adj R2 0.41 0.37 0.24 0.26 0.26 Log lik. -4560 -4940 -2814 -8027 -6724 -21088
Table 6: Results of the regression model identifying the most relevant socioeconomic predictors for fire density at the spatial
36
Acronym Name Fire
occurrence
Average
burned area Fires density
AC1 Road length/total area (km/km2) - +
AG1 Workers in primary sector (%) -
AG3 Public-owned land in total agricultural area (%) + - AG4 Farms with a own web-site in total farms (%) -
EC1 Inequality in personal income (Gini Index) -
EC2 Average per-capita income -
LA1 Length of urban-forest contact in total landscape patch
perimeter (m/km2) +
LA4 Coefficient of variation of patch size + + -
LA6 Pielou's eveness index of landscape diversification + +
LU1 Built-up area in total area %) - -
PO1 Non-native inhabitants in total residents (%) -
PO10 Job commuting in total inhabitants (%) + +
PO12 Inhabitants in scattered houses in total residents (%) -
PO14 Tourism facilities per inhabitant +
PO6 Activity rate (workforce in total inhabitants) (%) - - PO7 Unemployment rate (unemployed in total workforce) (%) + + +
PO9 Workers in industry in total workers (%) -
PRO1 Natural protected area in total area (%) +
Table 7: Significant anthropogenic variables in most of the models for fire occurrence (significant in all the models), average
37
4. Discussion
Fire proneness of woodland types
In Italy, Mediterranean pine forest is the most preferred by fire, followed by high maquis, transitional woodland-shrub and high oro-Mediterranean pine forest. This fire preference ranking is in line with previous research findings indicating that Mediterranean coniferous forests show the highest fire incidence compared to other woodland types (e.g. Gonzalez et al. 2006, Silva et al. 2009, Barros and Pereira 2014). The same types, with the addition of broad-leaved evergreen forest, have also the highest fire incidence for large fires. Thus, for these woodland type fire incidence does not change with fire size.
Fire recurrence mainly affects Mediterranean pine forest too, followed by transitional woodland-shrub, high maquis, and high oro-Mediterranean pine forest. The high incidence of recurrent fire events in Mediterranean pine forest can lead to severe effects in terms of soil and vegetation degradation processes. Despite the high post-fire resilience, regeneration of Mediterranean pines may fail when time lag between fires is so short (Pausas et al. 2009, De las Heras et al. 2012). Even the high fire recurrence in transitional shrub-woodland requires attention for management, especially where such woodland type represents a stage of forest succession, as most often happens in Italy. Repeated fire disturbance may hamper or even reverse vegetation dynamics, and ultimately leads to land degradation.
In the considered period, there is an overall decreasing trend of total burned area, number of fires and average burned area. Our findings agree with the results by Turco et al. (2016) in the case of burned area. As concerns the trend of fire number, findings from previous studies are controversial: Turco et al. (2016) ascribe these differences to the different methods, datasets or studied periods. The significant declining trend here observed can be mainly explained by improvements of fire prevention and suppression measures, even under a fire management governance perspective (Corona et al. 2015), as well as by progresses in awareness and education occurred in the last decade.
Not surprisingly, large fires and megafires hold a significant share of total burned area, as observed over all the Mediterranean Europe (San-Miguel-Ayanz et al. 2013). On the other hand, fire recurrence does not seem to affect such areas with an incidence higher than that of other burned areas.
A perhaps unexpected finding is the huge impact of fires in WUI areas, as concern both their with respect to total burned area (21%) and their average size, that is 1.7-fold larger than the average size of all fires. Our outcome is in accordance with Modugno et al. (2016) that showed