University of Siena - Department of Medical Biotechnologies
Doctorate in Genetics, Oncology and Clinical Medicine (GenOMec)
XXXIII cycle (2017-2020)
Coordinator: Prof. Francesca Ariani
CfDNA-NGS Liquid Biopsy for solid cancers and vascular
malformations
Scientific disciplinary sector BIO/18 - Genetics
Tutor: Ph.D. candidate:
Dr. Frullanti Elisa Dr. Palmieri Maria
Academic Years: 2019/2020
MARIA
PALMIERI
18.11.2020
16:08:39
UTC
Alla mia famiglia,
che mi indica la via da tutta una vita.
Al mio lui,
ormai il mio tutto.
Dipartimento Cardiocerebrovascolare Unità Operativa di Chirurgia Vascolare
Direttore Dr. Aldo Arzini
Largo Ugo Dossena, 2 – 26013 Crema
Telefono: 0373 280420 Ufficio relazioni con il pubblico Mobile: 335 6060019 ASST Crema
e-mail: [email protected]
e-mail: [email protected]
Sito Internet: www.asst-crema.it
Corrections Chap 1.5
• 1According to the presence or absence of endothelial mitotic activity . Vascular malformation derive from errors in the first weeks of development of the embryo ( angiogenesis) and in later phase of the vessel formation ( vasculologenesis)
• 2According to the evolution of the therapy of vascular anomalies which is progressively becoming more endovascular than surgical we presumed that the examination of a blood specimen taken during vascular catheterism might give some information which could replace biopsies. In n cases of huge a-v shunts, intraosseous malformations , biopsies might be dangerous. But would it work? The most involved cells are endothelial cells and supportive cells which all are in contact with blood flow. We can assume that the death rate of these cell should be lower than that of neoplastic cells and for this reason we have chosen to take blood specimen as close as possible to the vascular lesion.
Vascular tumors classification Tumor histological
entity Benign Local aggressive and borderline Malignant
Tumor type and subtype infantile hemangioma congenital hemangioma rapidly involuting hemangioma (RICH) partly involuting hemangioma (PICH) non-involuting (NICH) spindle cell hemangioma epitheloid cell hemangioma lobular capillary hemangioma tufted angioma kaposiform hemangioendothelioma retiform hemangioendothelioma papillary intralymphatic angioendothelioma composite hemangioendothelioma kaposi sarcoma angiosarcoma epitheloid hemangioendothelioma
Vascular malformation classification
Flow component Vascular component Clinical malformation
Slow flow Capillary malformation CM cutaneous/mucosal (“port wine stain”)
▪ CM with soft tissue and/or bone overgrowth
▪ CM with central nervous system and/or ocular anomalies (sturge-weber syndrome)
▪ CM with arterio-venous malformation (CM-AVM)
▪ teleangiectasia in hereditary hemorrhagic teleangiectasia (HHT)
▪ cutis marmorata telangiectatica congenita (CMTC)
▪ naevus simplex (stork bite, angel kiss)
Slow flow Lymphatic malformation CM cutaneous/mucosal (“port wine stain”)
▪ CM with soft tissue and/or bone overgrowth
▪ CM with central nervous system and/or ocular anomalies (sturge-weber syndrome)
▪ CM with arterio-venous malformation (CM-AVM)
▪ teleangiectasia in hereditary hemorrhagic teleangiectasia (HHT)
▪ cutis marmorata telangiectatica congenita (CMTC)
▪ naevus simplex (stork bite, angel kiss)
Slow flow Venous malformation common VM
▪ glomovenous malformation (GVM)
▪ blue rubber bleb naevus VM syndrome
▪ cutaneo-mucosal VM (VMCM)
Fast flow Arterio venous malformation sporadic AVM
▪ AVM in HHT
Fast flow Arteriovenous fistula sporadic AVF
▪ AVF in HHT
Combined vascular malformation
slow flow CM VM Capillary venous malformation Slow flow CM LM Capillary lymphatic malformation Fast flow CM AVM Capillary artero venous
malformation
Slow flow LM VM Lymphatic venous malformation Slow flow CM LM VM Capillary lymphatic venous
malformation
Fast flow CM LM AVM Capillary lymphatic arterio venous malformation
Fast flow CM VM AVM Capillary venous arterio venous malformation
Fast flow CM LM VM AVM Capillary lymphatic venous arterio venous malformation
Vascular malformation associated with other anomalies
Slow flow CM VM LM With limb overgrowth Klippel Trenaunay syndrome Fast flow CM AVF With limb overgrowth
Parkes weber syndrome Slow flow Limb VM With limb overgrowth
Servelle Martorell syndrome Slow flow Limb VM With congenital limb hypertrophy Slow flow VM With /without spindle cell
hemangioma and encondroma ( maffucci syndrome)
Slow and fast flow LM VM CM. AVM With lipomatous overgrowth Sindrome di Cloves
Slow flow CM VM LM With asymmetric somatic overgrowth ( Proteus)
Fast Flow AVM VM With macrocephaly and lipomatous overgrowth ( PTEN hamartoma syndrome
ISSVA genetic classification of vascular anomalies (2014)
“Vascular anomaly Gene/locus Location Inheritance Capillary/venulocapillary malformation
Sturge-Weber syndrome (leptomeningeal and cutaneous venulocapillary malformation, aka “port-wine stain”)
a. GNAQ 9q21 Somatic Non-syndromic port-wine stain
b. GNAQ 9q21 Somatic Arteriovenous malformations
Capillary malformation-arteriovenous malformation (CM-AVM)
*RASA1 5q14.3 AD Parkes Weber syndrome
*RASA1 (in subset) 5q14.3 AD Hereditary hemorrhagic telangiectasia
HHT1 *ENG 9q34.11 AD
HHT2 ACVRL1/ALK1 12q13.13 AD
HHT3 Unknown 5q31.3-q32 AD
HHT4 Unknow 7p14 AD
Juvenile polyposis/HHT syndrome (JP/HHT)
*SMAD4 18q21.2 AD
HHT5/atypical HTT *BMP9/GDF2 10q11.22 Association only
HBT Unknown CMC1/5q14 Association only
Angiokeratoma
Fabry disease *GLA Xq22.1 XD
Progressive patchy capillary malformations
Angioma serpiginosum Unknown Xp11.3-Xq12 Association only Familial cerebral cavernous malformations (CCM)
CCM1 *KRIT1 7q21.2 AD
CCM2 *Malcavernin/CCM2 7p13 AD
CCM3 *PDCD10 3q26.1 AD
CCM4 Unknown 3q26.3-27.2
Venous malformations
Sporadic Venous malformations (VM)
*TEK/TIE2 9p21.2 Somatic
Familial venous malformations cutaneous-mucosal (VMCM)
c. TEK/TIE2 9p21.2 AD
Glomuvenous malformation (GVM)
*Glomulin/GLMN 1p22.1 AD
Verrucous venous malformation (VVM)/verrucous hemangioma
MAP3K3 17q23.3 Somatic
Lymphatic malformations, lymphedemas, and complex syndromes
CLOVES *PIK3CA 3q26.32 Somatic
Klippel-Trenaunay syndrome (KTS)
d. PIK3CA 3q26.32 Somatic
Fibro-adipose vascular anomaly (FAVA)
*PIK3CA 3q26.32 Somatic
Macrocephaly-capillary malformation
PIK3CA 3q26.32 Somatic
“Microcephaly-capillary malformation (MICCAP)
*STAMBP 2p13.1 AR
Nonne-Milroy syndrome
*FLT4/VEGFR3 5q34-35 AD/AR
Primary hereditary lymphedema (Nonne-Milroy-like syndrome)
*VEGFC 4q34 AD
“Hypotrichosis lymphedema telangiectasia (HLT)
e. SOX18 20q13.33 AD/AR
Primary hereditary lymphedema
f. GJC2/Connexin 47 1q41-42, 4q34 AD Lymphedema distichiasis
g. FOXC2 16q24.1 AD
Primary lymphedema with myelodysplasia (Emberger syndrome)
h. GATA2 3q21.3 AD
Primary generalized lymphatic anomaly (Hennekam syndrome)
i. CCBE1 18q21.32 AR
Microcephaly with or without chorioretinopathy, lymphedema, or mental retardation syndrome j. KIF11 10q23.33 AD Lymphedema-choanal atresia k. PTPN14 1q41 AR Proteus syndrome l. AKT1 14q32.3 Somatic
PTEN hamartoma tumor syndrome (PHTS) Bannayan-Riley-Ruvalcaba syndrome (BRRS)
Cowden syndrome (CS)/Cowden-like syndrome
*PTEN, *SDHB, *SDHD, KLLN 10q23.3 AD “Proteus-like” syndrome
*PTEN 10q23.3 AD
PTEN-related Proteus syndrome (PS)
*PTEN 10q23.3 AD ” Massimo Vaghi
VAGHI
MASSIMO
10.10.2020
16:03:30
UTC
Dipartimento di Biotecnologie Mediche
Dipartimento di Biotecnologie Mediche Genetica Medica
Policlinico Santa Maria alle Scotte (I piano III lotto), V.le Bracci, 2 – 53100 Siena (Italia) Tel. +39 0577 233303 Fax +39 0577 233325 – http://www.biotecnologie.unisi.it/sezione.php?sez=5
CF 80002070524 P.IVA 00273530527
Siena,12th November 2020
To Whom It May Concern,
In accordance of what required by Prof. Costa I corrected the grammatical errors and I highlighted the novel aspects about the use of liquid biopsy in vascular malformations.
In accordance of what required by Dr. Vaghi I expanded the introduction with major focus on angiodysplasias and I added the entire classification of vascular malformations provided by the ISSVA.
The thesis has been sanded back to the reviewers after the corrections in the current version.
Maria Palmieri
PhD Student DOCTORATE in GENETICS, ONCOLOGY and CLINICAL MEDICINE (GenOMec)
INDEX
Abstract ... 1
1 Introduction ... 2
1.1 Liquid biopsy ... 2
1.2 Circulating cell-free DNA ... 3
1.3 Clinical Application of liquid biopsy in cancers ... 6
1.4 Tumor heterogeneity and therapy selection ... 9
1.5 Vascular malformations and liquid biopsy ... 10
1.6 Aim’s project ... 17
2 Materials and methods ... 18
2.1 Patient samples collection ... 18
2.2 Cell-free Plasma Isolation ... 18
2.3 Cell-free Nucleic Acid Isolation ... 19
2.4 cfDNA quantity check ... 20
2.5 cfDNA quality check ... 20
2.6 Library preparation ... 21
2.7 Library quality check ... 22
2.8 Library qPCR quantification ... 22
2.9 Ion Proton™ Sequencing ... 23
2.10 Sequencing Analysis ... 25
2.11 Cell-free Nucleic Acid Isolation ... 27
2.12 Preparation of sequencing libraries ... 27
2.13 Illumina NextSeq 550 Sequencing ... 28
2.14 Sequencing Analysis ... 29
3 Results ... 30
3.2 PIK3CA-CDKN2A clonal evolution in metastatic breast cancer and multiple points cell-free DNA analysis ... 30
3.3 Two-point-NGS analysis of cancer genes in cell-free DNA of metastatic cancer patients ... 34
3.4 A pilot study of next generation sequencing-liquid biopsy on cell-free DNA as a novel non-invasive diagnostic tool for Klippel-Trenaunay syndrome ... 44
3.5 MET somatic activating mutations are responsible for lymphovenous malformation and can be identified using cell-free DNA next generation sequencing liquid biopsy ... 51
3.6 Cell-free DNA next-generation sequencing liquid biopsy as a new revolutionary approach for arteriovenous malformation ... 56
4 Discussion and Conclusion ... 61
4.1 Discussion ... 61
4.2 Conclusion ... 63
1
Abstract
The liquid biopsy is a new emerging and repeatable low risky approach able to detect drive mutations that characterize the tumor, to monitor cancer evolution over time, and to overcome the standard tissue biopsy limits. The biomarker par excellence is the circulating cell-free DNA (cfDNA) that was the principal leading actor of this study.
The scope of this study was to perform different liquid biopsy analysis both in metastatic cancer and in vascular malformations patients to detect, from a precision medicine perspective, the sniper clone responsible for the tumor evolution or the vascular malformations.
The cfDNA was extracted from plasma coming from peripheral and/or efferent vein of vascular malformation. The obtained cfDNA was used to perform the libraries using two different genes panel of 52 and 77 cancer-driver genes, respectively the Oncomine™ Pan-Cancer Cell-Free Assay and AVENIO ctDNA Expanded Kit.
The most frequent mutations that we found in metastatic patients were the SNV in TP53, follow by PIK3CA, KRAS, and CNV in FGFR3. In the majority of cases, the mutations found at first liquid biopsy were confirmed by an increased allele frequency at the second one.
In vascular anomalies affected patients, the PIK3CA, MET, and KRAS mutated genes were found in Klippel-Trenaunay syndrome, in lymphovenous malformations, and in artero-venous malformations respectively, with a very low allele frequency percentage.
In conclusion, repeated analysis of liquid biopsy lead to the identification of key cancer genes and the following of clonal evolution over time. Moreover, the liquid biopsy is suitable not only for cancer patients but also for the diagnosis of vascular malformation. Our data prove that in the new era of precision medicine, this novel approach, based on the combination of NGS and liquid biopsy from the efferent vein at the vascular malformation site, allows to detect even low-grade somatic mosaicism responsible for the vascular phenotype. This approach let to bypassing the need for a highly risky tissue biopsy and lead to a tailored personalized treatment.
2
1 Introduction
1.1 Liquid biopsy
It has long been known that the conventional setting of "one size fits all" cancer treatment is not beneficial in most patients due to inter and intra-tumor heterogeneity. For this reason, the emerging precision medicine for cancer treatment able to provide "the right treatment for the right patient at the right time" is needed. In this scenario, thanks to Next-Generation Sequencing (NGS) technology, a new technique is gaining importance and could make possible to achieve the goal of precision cancer medicine: the liquid biopsy [1].
In the last decades, it has been studied that during the tumor progression, an active or passive intratumoral escape of cellular components occurs [2]. The liquid biopsy refers to isolation and analysis of this material derived from the tumor. It begins to be increasingly applied as it represents a minimally invasive tool that offers the possibility of capturing the tumor molecular characteristics and its evolution in real-time [3].
These tumoral components include intact circulating tumor cells (CTCs) that intravasate into the bloodstream at low frequency and can be isolated from a background of healthy blood cells. Tumor cells also release subcellular particles, the exosomes, or extracellular membrane-encased vesicles that contain tumor-specific proteins and nucleic acids. Moreover, it is possible to isolate circulating cell-free nucleic acid derived from tumor cells, including microRNAs (miRNAs), non-coding RNA, cfRNA (less stable), and cfDNA [4] Figure 1.
3
Figure 1. Release and extraction of cfDNA from the blood. cfDNA is released from healthy, inflamed or diseased (cancerous) tissue from cells undergoing apoptosis or necrosis [5].
During my Ph.D research work, I focused on the analysis of tumoral cfDNA, which is the most studied and relevant biomarker analyzed through liquid biopsy approach. The cfDNA can come from several different fluids for specific tumor types such as blood, saliva, urine, stool, cerebrospinal fluid (CSF), pleural fluid, and ascites [6]. Among them, blood is the most utilized one [7].
1.2 Circulating cell-free DNA
First reported by Mandel and Metais in 1948, the cfDNA represented the fragmented DNA found in the non-cellular component of the blood [8]. The discovery of circulating cell-free DNA (cfDNA) remained obscure for several years until scientists observed differences between the characteristics of cfDNA from healthy and diseased individuals. Several studies have reported increased concentrations and cancer-associated mutations of cfDNA in cancer patients [9], [10], [11].
4
In 1997 was found out the presence of circulating fetal DNA in maternal plasma and serum in pregnant women, and this discovery had important clinical implications for the non-invasive prenatal test [12].
CfDNA is generally found in the bloodstream as double-stranded fragments of about 150 to 200 base pairs in length. The fragments are often associated with histone proteins; this explains the typical cfDNA length, which is rapidly cleared, having a half-life of an hour or less [13]. In healthy persons, the cfDNA released from cells in the blood is very low (~10 to 15 ng per mL), while it ranges between 0-5 and >1000 ng/ml in patients with cancer. However, a high level of cfDNA is not always specific to tumor presence Figure 2.
Figure 2. The figure lists the three main fases of cfDNA life cycle [13].
The cfDNA high concentration in the blood is frequently due to detected under tissue stress, pregnancy, inflammation, diabetes, injury conditions, or sepsis [6]. Other mechanisms, including phagocytosis, pyroptosis, and active secretion, may contribute to cfDNA release. Although the exact mechanism responsible for the active release of cfDNA remains not clear, it could be a consequence of genomic instability [13].
In cancer patients, the cfDNA is released from tumor cells as circulating tumor DNA (ctDNA); it is highly fragmented DNA with a short half-life in the blood (∼ 2.5 h) and
5
represents the only 0.1% of the overall cfDNA [6]. The ctDNA can be specially distinguished from cfDNA by specific molecular characteristics such as variants, copy number variations, methylation, and amplifications or deletions associated with tumor [14].
Of course, the ctDNA can come from both primary and metastatic sites since cancer cells closely interact with vascular cells and release DNA into the bloodstream. ctDNA can also be released through other mechanisms, such as that implemented by migrant cancer cells called CTC. These cancer cells can enter into the bloodstream directly, but they are not the only ones, as there are cancer cell exosomes [15] that contribute to the release of ctDNA [13]. The origin and process by which tumor DNA is released and enters circulation have been extensively studied, and to date, we are aware of several mechanisms [16].
Growing tumors have been shown to experience periods of apoptosis or heightened necrosis that is responsible for ctDNA release. Apoptosis seems to produce shorter cfDNA fragments with lengths of approximately 150-200 bps, while necrosis seems to produce larger cfDNA fragments, up to thousands of base pairs [17].
Furthermore, it has also been shown that the ctDNA released by cultured cancer cells is related to the percentage of cells in phase G1. An increase in the release of ctDNA by differentiated cells suggests the hypothesis of an active release of nucleic acid enclosed within exosomes, which well protects it from blood degradation [18].
In healthy people, the release of cfDNA from the normal apoptotic process is well controlled, and the rapid elimination of nucleic acid explains the low amount of cfDNA detectable in the blood. On the other hand, in patients suffering from tumors, chronic inflammation, and excessive cell death, the clearance is overloaded and not sufficient, resulting in an accumulation of cfDNA in pathological conditions [19].
Besides the elimination of ctDNA from the bloodstream through clearance mechanisms, it has been reported that other cells in the body might uptake cfDNA circulating in blood performing horizontal gene transfer that can result in alterations in the recipient host cells. This process could be a key event in the initiation of molecular metastasis of the tumor [20].
Moreover, ctDNA amount is notably variable among patients depending on the type and the stage of the tumor [21] suggesting a correlation with tumor burden (primary tumor and all metastasis), biological features [6], and cancers aggressivity [7]. Notably, cfDNA levels have also been correlated with the outcome and survival of cancer patients: increased amount seems to associate with a poorer prognosis [22].
6
However, in some cases, the release of ctDNA may be limited by the presence of physiological barriers such as the blood-brain barrier or capsules surrounding some organs, and this affects the distribution of cell-free DNA derived from the tumor [23].
1.3 Clinical Application of liquid biopsy in cancers
So far, tissue biopsy represents the gold standard for tumor analysis and the histological features are the basis for conventional pathological diagnosis of cancer; Nevertheless, the morphological classification, immunohistochemical subclassification, and microscopic tissue pattern are not sufficient to predict the treatment response and the development of the disease.
Nowadays, for patient management and treatment decisions, the analysis of cancer genetic alterations is crucial also in the advancements of precision medicine genotype-directed therapy that is becoming a standard approach. Notwithstanding, knowledge of cancer and its mutational profile assessment performed using a primary tumor fragment or metastases have several limitations [24].
First, tissue biopsies oblige an invasive surgical intervention, which may not always be feasible, determined by tumor localization and the accessibility of tumor tissue. Furthermore, the analysis of a single tissue biopsy might not be representative of the malignancy due to intra and inter-tumor heterogeneity, the clonal evolution of the disease over time, and in response to therapy.
A further limitation of the tissue biopsy is the almost impossibility of obtaining tissue samples repeated over time, especially for those tumors that are housed in anatomical areas, which are difficult to reach. Furthermore, the recurrence and the appearance of drug resistance are also difficult to cope with the only tissue biopsy [2], [4]. Whereas liquid biopsy is considered a minimally invasive repeatable test that represents a fitting approach to following the tumor evolution. Serial blood withdrawal can be easily obtained, providing a dynamic assessment of cfDNA and its variations [6], [25].
In particular, it has been shown that ctDNA analysis allows dynamic monitoring (real-time) of cancer evolution, response to therapy, resistance appearance, minimal residual disease (MRD), and relapse.Indeed, some studies highlighted that ctDNA levels upturn immediately after treatment, as tumor cell death leads to increased release of ctDNA and decreases within some weeks to months in patients responding to therapy [26].
Moreover, relevant findings reveal that liquid biopsy can find alterations of resistance not captured by the single lesion tissue biopsy also while the patient is still responding to the
7
therapy, predicting in this way the timing and the cause of the treatment failure [27], [28]. Following this evidences, the liquid biopsy gives the possibility of earlier therapeutic intervention and improved clinical outcomes [29].
Several studies illustrate how the analysis of ctDNA could identify the minimal residual disease (MRD) in breast, lung, and colon cancer patients after the surgery or the local therapy indicating that the postoperative ctDNA detection might be a valid biomarker to select patients who need to receive adjuvant therapy and spare patients who have been completely cured [30], [31].
Potentially, another appealing application of liquid biopsy could be early cancer detection using a simple blood test for screening a healthy, asymptomatic population [4]. However, a highly sensitive method, able to detect trace amounts of cfDNA released by precancerous lesions or early-stage cancers, and high specificity would be required to screen the unaffected population [6].
In this new revolutionary approach liquid biopsy is an emerging, non-invasive technique that provides more accurate and easy representations of disease biology, giving the possibility to overcome tissue biopsy and imaging limitations [25] as summarized in Table 1 [32].
8
Table 1. Advantages of liquid biopsy over tissue biopsy
Liquid biopsy Tissue biopsy
Clinical sample Blood Affected tissue
Risk Minimal risk/pain Risk depends on the location of tumor
Ease of collecting sample
Quick Depends on the location of the tumor.
Some tumors are hard to reach.
Ease of monitoring patients
Simple blood test No repeatable surgeon.
Surgeon may not know where to look for metastatic tumor
Invasive Minimally invasive Invasive
Time for patient recovery
Quick; does not require hospitalization
Time intensive; it requires hospitalization of patients
Liquid biopsy represents an attractive and essential alternative method aiming to overcome the limits of the typical tissue biopsy and imaging detection methods providing a more accurate representation of the disease. The liquid biopsy approach can show the total heterogeneity of the tumor mass(es) and the clonal selection process, to intercept the onset of disease relapse or resistance to therapy, possibly predicting treatment response and prognosis and managing therapy decisions [4], [7].
In particular, the analysis of the circulating tumor DNA demonstrates massive potential as a biomarker in oncology representing a new point towards the use of molecular methods for the development of inclusive clinical tests based on the concept of non-invasive personal and precision medicine for cancer treatment [16]. Its validity has been demonstrated by numerous studies that showed high concordance rates of 80% to 90% between the mutational profile established through cfDNA testing and the mutational profile resulting from a tumor biopsy,
9
which remains the normality of care, making liquid biopsy, particularly cfDNA analysis, an attractive implement [6].
To achieve efficient clinical treatment, it would be crucial to work on the standardization of both pre-analytical and analytical procedures for all liquid biopsies components. These procedures include the choice of blood collection tubes, the time allowed between blood draw and plasma processing, the isolation/extraction of liquid biopsy components, and also their characterization and quantification [4].
Moreover, the small fraction of ctDNA within the background of non-tumoral cfDNA in cancer patients and the short half-life of tumor-derived DNA represent challenging issues [6]. However, recently improved technologies such as NGS and ddPCR facilitated the liquid biopsy analysis approach [19]. Additionally, there are still numerous open questions concerning cfDNA subtypes, mechanism of release, and its clearance in patients with cancer.
1.4 Tumor heterogeneity and therapy selection
The mutational profile and the behavior of cancer change in time and space: tumor tissues reveal significant variation in morphology, cellular composition, and genetic features within different regions of the same tumor. Additionally, in the case of metastatic cancer, metastases present further differences. Moreover, the tumor develops dynamically, showing additional or completely deviant features during its clinical progress [33].
Generally, studies associated to the ctDNA analysis have demonstrated that the generated mutational profile reflects the same somatic alterations found in patient cancers’ and it is possible to capture mutations absent in the first tissue biopsy [34], [35]. The evaluation of the mutational status is strongly necessary for targeted therapies valid only when specific pathways are altered in the tumor cells. Tissue biopsies do not consider tumor heterogeneity, bias, and errors that can affect the selection and efficacy of personalized treatment.
The release of ctDNA from all tumor cells reflects the heterogeneity of the tumor, leading to the use of these therapies, which represent an excellent diagnostic tool and allow for a strong stratification of therapy [16].
Levels of cfDNA have been shown to vary greatly between patients with different types of cancer and between patients with benign lesions or with early-stage cancer, who show lower amounts of cfDNA than patients with advanced or metastatic cancer [21]. The variability is also given by its interactions with the microenvironment as well as by the rate of cell death and proliferation [13]. High cell proliferation rates are often associated with local overgrowth and,
10
consequently, elevated oxygen and nutrient consumption that leads to hypoxia and tissue necrosis Figure 3.
Figure 3. Application of circulating tumor DNA analysis during the course of disease and treatment administration.
a. In the image are indicated the potential applications of liquid biopsies during care of a patient who undergoes surgery (or other initial treatment), has a disease relapse and consequently receives systemic therapy: the patient starts with one single clone, but multiple metastases and distinct clones (depicted in different colors) emerge following treatment.
b. ctDNA give both quantitative information (that is, relating to tumor burden and allow disease staging and prognosis) and genomic information that is useful for the selection of therapies. Therefore, longitudinal analysis allows to monitor treatment response and by comparing genomic profiles over time, clonal evolution may be monitored [20].
Moreover, most tumor tissues are preserved in formalin-fixed, paraffin-embedded (FFPE) blocks for pathological interpretation and staining. However, this process crosslinks and fragments DNA, putting at risk their structural integrity, thus, introducing challenges for sequencing and interrogating genomic alterations [29].
1.5 Vascular malformations and liquid biopsy
The vascular malformations are due to errors that occur at the embryological level. They are very complex and the first classification was made by Glowacki and Mulliken in 1982 based on biological features such as histology and histochemistry [36]. In 1988, a classification on the morphological basis was accepted and subsequently, in 1996, accepted by the International Society for the Study of Vascular Anomalies (ISSVA) in Rome in which the malformations were divided into tumors and vascular malformations.
11
The classification system was further expanded in 2014 at the congress held in Melbourne. This classification also maintains the subdivision of vascular anomalies into tumors and malformations but provides further details such as the addition of mutated genes and clinical associations such as coagulopathies [37] Table 2-5.
Table 2. Vascular tumors classification
Table 3. Vascular malformation classification
Flow component Vascular component Clinical malformation
Slow flow Capillary malformation CM cutaneous/mucosal (“port
wine stain”)
▪ CM with soft tissue and/or bone overgrowth
▪ CM with central nervous system and/or ocular anomalies (sturge-weber syndrome) ▪ CM with arterio-venous malformation (CM-AVM) ▪ teleangiectasia in hereditary hemorrhagic teleangiectasia (HHT) ▪ cutis marmorata telangiectatica congenita (CMTC)
▪ naevus simplex (stork bite, angel kiss)
Slow flow Lymphatic malformation CM cutaneous/mucosal (“port
wine stain”)
Tumor histological entity
Benign Local aggressive and
borderline
Malignant Tumor type and
subtype infantile hemangioma congenital hemangioma rapidly involuting hemangioma (RICH) partly involuting hemangioma (PICH) non-involuting (NICH) spindle cell hemangioma epitheloid cell hemangioma lobular capillary hemangioma tufted angioma kaposiform hemangioendothelioma retiform hemangioendothelioma papillary intralymphatic angioendothelioma composite hemangioendothelioma kaposi sarcoma angiosarcoma epitheloid hemangioendothelioma
12 ▪ CM with soft tissue and/or bone overgrowth
▪ CM with central nervous system and/or ocular anomalies (sturge-weber syndrome) ▪ CM with arterio-venous malformation (CM-AVM) ▪ teleangiectasia in hereditary hemorrhagic teleangiectasia (HHT) ▪ cutis marmorata telangiectatica congenita (CMTC)
▪ naevus simplex (stork bite, angel kiss)
Slow flow Venous malformation common VM
▪ glomovenous malformation (GVM)
▪ blue rubber bleb naevus VM syndrome
▪ cutaneo-mucosal VM (VMCM)
Fast flow Arterio venous
malformation
sporadic AVM ▪ AVM in HHT
Fast flow Arteriovenous fistula sporadic AVF
▪ AVF in HHT
Combined vascular malformation
slow flow CM VM Capillary venous malformation
Slow flow CM LM Capillary lymphatic
malformation
Fast flow CM AVM Capillary artero venous
malformation
Slow flow LM VM Lymphatic venous
malformation
Slow flow CM LM VM Capillary lymphatic venous
malformation
Fast flow CM LM AVM Capillary lymphatic arterio
venous malformation
Fast flow CM VM AVM Capillary venous arterio venous
malformation
Fast flow CM LM VM AVM Capillary lymphatic venous
13
Table 4. Vascular malformation associated with other anomalies
Slow flow CM VM LM With limb overgrowth
Klippel Trenaunay syndrome
Fast flow CM AVF With limb overgrowth
Parkes weber syndrome
Slow flow Limb VM With limb overgrowth
Servelle Martorell syndrome
Slow flow Limb VM With congenital limb
hypertrophy
Slow flow VM With /without spindle cell
hemangioma and encondroma (maffucci syndrome)
Slow and fast flow LM VM CM. AVM With lipomatous overgrowth Sindrome di Cloves
Slow flow CM VM LM With asymmetric somatic
overgrowth (Proteus)
Fast Flow AVM VM With macrocephaly and
lipomatous overgrowth (PTEN hamartoma syndrome
Table 5. ISSVA genetic classification of vascular anomalies (2014)
Vascular anomaly Gene/locus Location Inheritance
Capillary/venulocapillary malformation Sturge-Weber syndrome (leptomeningeal and cutaneous venulocapillary malformation, aka
“port-wine stain”) a. GNAQ 9q21 Somatic
Non-syndromic port-wine stain b. GNAQ 9q21 Somatic
Arteriovenous malformations
Capillary malformation-arteriovenous
malformation (CM-AVM) *RASA1 5q14.3 AD
Parkes Weber syndrome *RASA1 (in subset) 5q14.3 AD
Hereditary hemorrhagic telangiectasia
HHT1 *ENG 9q34.11 AD
HHT2 ACVRL1/ALK1 12q13.13 AD
HHT3 Unknown 5q31.3-q32 AD
HHT4 Unknown 7p14 AD
Juvenile polyposis/HHT syndrome (JP/HHT) *SMAD4 18q21.2 AD
HHT5/atypical HTT *BMP9/GDF2 10q11.22 Association only HBT Unknown CMC1/5q14 Association only
Angiokeratoma Fabry disease *GLA Xq22.1 XD
Progressive patchy capillary
malformations Angioma serpiginosum Unknown
Xp11.3-Xq12
Association only
Familial cerebral cavernous
malformations (CCM)
14
CCM2 *Malcavernin/CCM2 7p13 AD
CCM3 *PDCD10 3q26.1 AD
CCM4 Unknown 3q26.3-27.2
Venous malformations
Sporadic Venous malformations (VM) *TEK/TIE2 9p21.2 Somatic
Familial venous malformations
cutaneous-mucosal (VMCM) TEK/TIE2 9p21.2 AD
Glomuvenous malformation (GVM) *Glomulin/GLMN 1p22.1 AD
Verrucous venous malformation
(VVM)/verrucous hemangioma MAP3K3 17q23.3 Somatic
Lymphatic malformations,
lymphedemas, and complex syndromes
CLOVES *PIK3CA 3q26.32 Somatic
Klippel-Trenaunay syndrome (KTS) PIK3CA 3q26.32 Somatic
Fibro-adipose vascular anomaly (FAVA) *PIK3CA 3q26.32 Somatic
Macrocephaly-capillary malformation PIK3CA 3q26.32 Somatic
Microcephaly-capillary malformation
(MICCAP) *STAMBP 2p13.1 AR
Nonne-Milroy syndrome *FLT4/VEGFR3 5q34-35 AD/AR
Primary hereditary lymphedema
(Nonne-Milroy-like syndrome) *VEGFC 4q34 AD
Hypotrichosis lymphedema telangiectasia
(HLT) SOX18 20q13.33 AD/AR
Primary hereditary lymphedema
GJC2/Connexin 47
1q41-42,
4q34 AD
Lymphedema distichiasis FOXC2 16q24.1 AD
Primary lymphedema with
myelodysplasia (Emberger syndrome) GATA2 3q21.3 AD
Primary generalized lymphatic anomaly
(Hennekam syndrome) CCBE1 18q21.32 AR
Microcephaly with or without chorioretinopathy, lymphedema, or
mental retardation syndrome KIF11 10q23.33
AD
Lymphedema-choanal atresia PTPN14 1q41 AR
Proteus syndrome AKT1 14q32.3 Somatic
PTEN hamartoma tumor syndrome (PHTS) Bannayan-Riley-Ruvalcaba
syndrome (BRRS) PTEN 10q23.3 AD
Cowden syndrome (CS)/Cowden-like syndrome
*PTEN, *SDHB,
*SDHD, KLLN 10q23.3 AD
“Proteus-like” syndrome *PTEN 10q23.3 AD
15
Vascular tumors (distinguished by endothelial hyperplasia) tend to regress as the patient ages, while vascular malformations (distinguished by dysmorphogenesis and abnormal cellular turnover) increase in size with the progression time. The latter are divided into capillary, venous, lymphatic, arterio-venous and combined malformations, depending on their dominant vasculature.
According to their aspect, venous malformations are the most common representative of vascular anomalies (70%), followed by lymphatic malformations (12%), arterio-venous malformations (8%), combined malformation syndromes (6%) and capillary malformations (4%) [38].
Based on their flow characteristics, vascular malformations can be divided into four main categories: those with slow-flow (i. capillary malformation, ii. venous malformation, iii. lymphatic malformation) and those with fast-flow (iv. arteriovenous malformation) [39].
Vascular malformations are present from birth, having the same endothelial lineage. They result from errors in the signaling of apoptosis, rather than in the growth and maturation of endothelial cells at the time of embryogenesis [40], [41] according to the presence or absence of endothelial mitotic activity. Vascular malformation derive from errors in the first weeks of development of the embryo (angiogenesis) and in later phase of the vessel formation (vasculologenesis).
Many times the vascular malformations are mixed, making the already complicated nomenclature and the formulation of diagnosis even more difficult. In these cases, it is very useful the investigation through the acquisition of images such as ultrasound (US), rather than color Doppler or magnetic resonance imaging (MRI) [42].
Generally, the treatment of vascular malformations may require both invasive and non-invasive procedures and may be different depending on the type of vascular malformation. The venous malformations are managed with laser therapy, sclerotherapy, and surgery, the hemangioma with systemic or intralesional corticosteroids, chemotherapeutic agents such as vincristine, alpha‐interferon, surgery, lasers, or a combination of these therapies or the arteriovenous malformations are treated with arteriogram and embolization using varying substances, such as alcohol glue, and coils [43]. However, these procedures are invasive, painful, and risky.
According to the evolution of the therapy of vascular anomalies which is progressively becoming more endovascular than surgical we presumed that the examination of a blood specimen taken during vascular catheterism might give some information which could replace biopsies. In cases of huge a-v shunts, intraosseous malformations, biopsies might be dangerous.
16
But would it work? The most involved cells are endothelial cells and supportive cells, which all are in contact with blood flow. We can assume that the death rate of these cell should be lower than that of neoplastic cells and for this reason we have chosen to take blood specimen as close as possible to the vascular lesion.
The use of liquid biopsy helps us to overcome the obstacle of the invasiveness of tissue biopsies that are still needed for the molecular diagnosis of Vascular Malformations.
17 1.6 Aim’s project
The aim of my work project was to assess a new approach as the non-invasive method such as the liquid biopsy. The rationale consists of taking a blood sample from a peripheral vein in cancer patients and, thanks to the easy performance of the technique, repeating the analysis during the time in order to follow the clonal evolution over time.
Regarding the vascular malformations’ patients, the blood withdrawal is taken from the efferent vein of the vascular lesion and from the peripheral vein. By comparing the data obtained from both samples, we expect to find mutations with a higher allelic frequency percentage from the sample coming from the vascular malformation site compared to that of the peripheral vein. The liquid biopsy allows us to detect the presence of a very low frequency of somatic mosaic mutations, not easily identifiable with the classic tissue biopsy.
18
2 Materials and methods
2.1 Patient samples collection
During these three years, we collected 69 patients with different solid tumors, who experienced disease progression after standard therapy; in the last academic year, we also investigated 37 patients suffering from different vascular malformations. Blood samples were collected in 10 mL Cell-Free DNA BCT® Streck tubes (Streck, La Vista, NE, USA) (Fig.1). The tubes hold formaldehyde-free preservatives useful to stabilize nucleated blood cells preventing the release of genomic DNA from cells and allowing the cell-free DNA
stabilization. These conditions guarantee the preservation and isolation of high-quality cell-free DNA. Streck tubes keep stable the Cell-cell-free DNA for up to 14 days at 6 °C to 37 °C Figure 4.
Figure 4. Cell-Free DNA BCT® Streck tubes
Ion Torrent sequencing
2.2 Cell-free Plasma Isolation
The plasma was obtained by double centrifugation at RT (room temperature): the first centrifugation at 1900 rcf for 15 minutes, and the second one at 1900rcf for 10 minutes to remove eventual cells and cellular debris from the plasma. After that, the plasma was stored at -80 °C or directly processed for cf-DNA extraction.
19 2.3 Cell-free Nucleic Acid Isolation
Cf-DNA was extracted from 4.0 mL of plasma manually using MagMAX™ Cell-Free Total Nucleic Acid Isolation Kit according to the manufacturer's instructions.
First, the sample plasma was digested using Proteinase K combining 4.0 mL of plasma with 60 μL of MagMAX™ Cell-Free Total Nucleic Acid Proteinase K (20 mg/mL) and 2mL of MagMAX™ Cell-Free Total Nucleic Acid Lysis/Binding Solution in 50mL falcon tubes. The sample was incubated in the shaking at 1000 rpm for 30 minutes at 65°C.
After Proteinase K incubation, the samples were cooled on ice until they reached RT. Then 3.0 mL of MagMAX™ Cell-Free Total Nucleic Acid Lysis/Binding Solution plus 120 μL of MagMAX™ Cell-Free Total Nucleic Acid Magnetic Beads (Fig.2) were added to the digested plasma. Later, the samples were placed on an RT shaker at 1000 rpm for 10 minutes that allow binding the nucleic acid to the beads.
Then, the 50ml tubes were placed on the DynaMag™–50 Magnet stand, when the supernatant was clear it was removed and discarded without disturbing the beads. The latter were resuspended in 1 mL of Wash Solution 1. The bead slurry was recovered and transferred to a new 1.5 mL microcentrifuge tube, placed on the DynaMag™–2 Magnet stand for 20 seconds, and washed two times with 1 mL of freshly prepared 80% ethanol. The beads were air-dried and resuspended in 400 μL of Elution Solution vortexing for 5 minutes. The supernatant containing cfDNA was transferred to a new 1.5 mL microcentrifuge tube.
The next step was to concentrate the cfDNA combining 500 μL Lysis/Binding Solution with 10 μL of well-vortexed Magnetic Beads following the same procedure previously explained. Finally, were obtained 15 μL of cfDNA ready for quantity and quality check.
20 2.4 cfDNA quantity check
The cell-free DNA quantity was asses using the Qubit™ dsDNA HS Assay Kits on Qubit 2.0 fluorometer (Invitrogen, Carlsbad, CA, USA) according to the Qubit dsDNA HS Assay user guide. The working solution was prepared by diluting the Qubit® dsDNA HS Reagent 1:200 in Qubit® dsDNA HS Buffer. After, were prepared two standards combining 190 μL of the working solution with 10 μL of each standard. For sample preparation, 1 μL was combined with 199 μL of the working solution. After an RT incubation of 3 minutes the standards and the samples were read. The Qubit can evaluate only the quantity and not the quality for which is necessary to perform an Agilent High Sensitivity DNA analysis.
2.5 cfDNA quality check
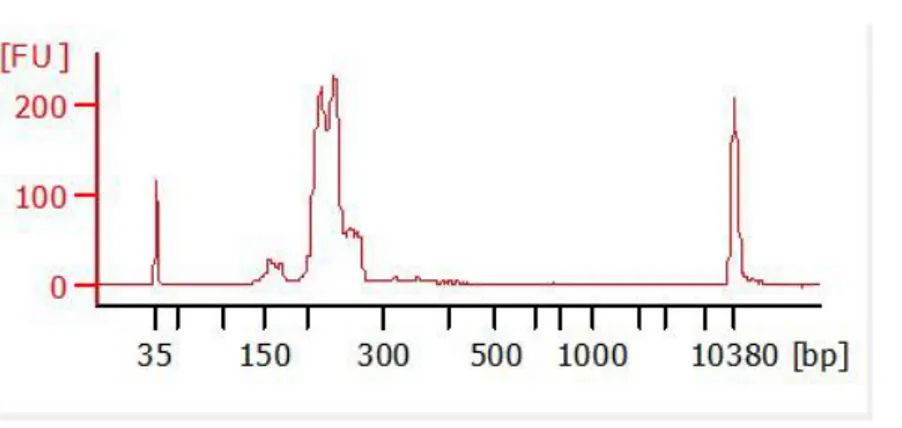
The cfDNA quality was evaluated with Agilent™ High Sensitivity DNA Kit (Agilent Technologies, Palo Alto, CA) on Agilent2100 Bioanalyzer (Agilent Technologies) according to the manufacture’s protocol. The Gel-Dye mix (9μL) was loaded in the DNA chip, followed by 1μL of the ladder 1 μL of the sample. Before starting the run on Agilent 2100 Bioanalyzer, the chip was vortexed for 60 seconds at 2400 rpm. The fragmented cfDNA is characterized by 150-170 bp peaks Figure 5.
21 2.6 Library preparation
The libraries were performed using the Oncomine™ Pan‑Cancer Cell‑Free Assay (ThermoFisher Scientific, Carlsbad, CA, USA), according to the manual instructions. Optimal libraries can be prepared from 20− 50 ng of cfDNA using a maximum volume of 10.4 μL. The libraries were generated performing three PCR reactions in the Veriti™ 96‑well Thermal Cycler (Applied Biosystem, Thermo Fisher) Figure 6.
22
To make unique fragments belonging to the same sample, we used different Tag Sequencing BC# (Set 1-24) allowing us to sequence a sample pool on the same chip. At the end of the PCR amplification and purifications, 28 μL of the library were recovered. The final library can be stored for long term at -20°C or the library can be qualified and quantify by qPCR.
2.7 Library quality check
The quality check was performed following the same procedures used for the cfDNA quality check with the use of Agilent™ High Sensitivity DNA Kit on Agilent™ 2100 Bioanalyzer™ Figure 7.
Figure 7. Shows the library profile, with a good library peak around 200bp and minimal presence of primer-dimers (150bp) (my own data).
2.8 Library qPCR quantification
The library concentration of each sample was determined by qPCR with the Ion Library TaqMan® Quantitation Kit following the manufactures instruction.
In real-time PCR, DNA is amplified by DNA-polymerase chain reactions. After each round of amplification, the DNA is quantified. Higher is the number of the nucleic acid target, the sooner is the fluorescence observed. The qPCR is a compound of the following steps.
1. An oligonucleotide probe contains a reporter (R) fluorescent dye on the 5´ end and a quencher dye (Q) on the 3´ end. While the probe is entire, the closeness of the Q reduces
23
the fluorescence emitted by the R by fluorescence resonance energy transfer (FRET) through space.
2. When the probe anneals to the target sequence downstream from one of the primer sites the Taq DNA polymerase cleaves the probe as the primer is extended. This cleavage moves away from the R from the Q, increasing the reporter dye signal and allowing primer extension. At each cycle, other probes will be cleave increasing the fluorescence signal which is directly proportional to the amplified quantity.
The E. coli DH10B Control Library was used and diluted serially to generate a set of standards: 10-fold serial dilution was prepared at 6.8 pM, 0.68 pM, 0.068 pM. Also, the library was diluted and for each sample, a 1:100 and 1:1000 dilution were prepared.
Then, 11 μL of the PCR master mix was aliquoted for a single reaction. The PCR reactions were set in an Optical 96‑well plate by adding 11 μL of PCR Master Mix and 9 μL of the E. coli control dilutions, sample dilutions, and nuclease-free water for NTC. Finally, the plate was loaded in the 7900HT Fast Real‑Time PCR Instrument and the run program of the user guide was performed. Once the standard curve is generated, the libraries’ concentration is calculated.
2.9 Ion Proton™ Sequencing
Before proceeding to the sequencing on Ion Proton™ Sequencer, the libraries are loaded as a pool in the Ion PI™ Hi-Q™ Chef System to prepare the templates and to load the sequences on the chip. The pool libraries are diluted according to the protocol and loaded in the appropriate Ion Chef™ Library Sample Tube. Once the Ion Chef™ Instrument was completely loaded with all the consumables and 2 chips (Ion PI™ Chip v3), it is ready to set up the emulsion PCRs and load the sequences onto the chips.
Indeed, the Ion Chef System performs an emulsion PCR creating a template-positive Ion Sphere™ Particles (ISPs). Finally, the templates are loaded into the chip. In the end, the Ion Chef™ Instrument wasunloaded and cleaned with UV rays. Each chip contains 4 libraries samples which will be sequenced on the Ion Proton™ Sequencer.
After the cleaning and initialization of the Ion Proton™ Sequencer with the Ion PI™ Hi‑Q™ Sequencing 200 Kit, the chip was loaded and the sequencing process started.
24
Ion Proton technology is based on the detection of the PH variation by the instrument's ionic sensor. The value of PH change when a nucleotide is incorporated into a strand of DNA by a polymerase and a hydrogen ion is released as a byproduct. This signal is transformed from chemical information to digital information Figure 8.
25 2.10 Sequencing Analysis
The sequencing analysis was performed with the Ion Reporter Server System (Thermo Fisher Scientific). The quality of the run is dictated by the unaligned section, reviewing Total Bases, Total Reads, Mean, and Median read lengths Figure 9.
Figure 9. Unaligned metrics (my own data).
IPS Density: The ISP Density includes the Total Bases (Number of filtered and trimmed base pairs reported in the output BAM file) and the Bead Loading (Percentage of chip wells that contain a live ISP).
IPS Summary: In this section, several metrics are found including Usable Sequences (The percentage of library ISPs that pass the polyclonal, low quality, and primer‑dimer filters), the percentage of Clonal and Polyclonal ISPs, the Final Library (Percentage of reads which pass all filters and which are recorded in the output BAM file) and Percentage of ISPs with a low or unrecognizable signal.
Read Length: This section includes the read length histogram (a histogram of the trimmed lengths of all reads present in the output files) and the following metrics: Mean Read Length (average length, in base pairs, of called reads) and the Median length of called reads.
As a metric, it was considered also the Total Alignment Bases to the reference genome (Hg19), the Reference Coverage, the percentage of Aligned and Unaligned bases, and the Raw Accuracy, which is reported in a graph that plots percent accuracy for each position in an aligned sequence. The alignment quality reports different scores referred to as AQ17, AQ20, and Perfect with an error rate of 2% (or less), 1% (or less), and (the longest perfectly aligned
26
segment) respectively. The quality level is also reported with the Total number of bases, the Mean length, and the mean coverage depth Figure 10.
Figure 10. Sequence alignment to Homo sapiens (my own data). Number of filtered and trimmed aligned base pairs reported in the output BAM file. Total number of bases aligned to the reference sequence. Excludes the library key, barcodes, and 3' adapter sequences.
The Ion Reporter™ software calls all the identified variants reported as: − SNV (single-nucleotide polymorphism)
− Indel (insertion or deletion of bases)
− CNV (copy number variation)
− Fusion (joining parts of two different genes)
− MET Exon 14 Skipping
For each variant, listed by chromosomal location, exon, a reference sequence, amino acid variation, and so on, it indicates several annotations, which include:
27
− The coverage (the number of base positions covered by at least one read)
− The Median Read Coverage (median number of individual interrogated DNA
molecules across targets)
− The Molecular Depth (number of interrogated DNA molecules containing target)
− The Molecular Counts (the number of detected DNA molecules containing variant
allele)
− The LOD % (Limit of detection determined by the minimum amplicon coverage
and input of DNA used for library preparation. − The frequency % (frequency of mutant allele)
− The variant type (Missense, Synonymous, etc.)
− The DrugBank (list of drugs known to target the gene)
− The Phred quality score (base-calling error probabilities).
Illumina sequencing
2.11 Cell-free Nucleic Acid Isolation
After the sample collection and plasma isolation (see above), the cfDNA isolation start combining in a 15ml canonical tube, 4ml of plasma with 500 μL of reconstituted Proteinase K incubated at RT for 5 minutes. A second incubation of 30 minutes took place after the addition of 4 mL of DNA PBB. After that, 1000 μL of isopropanol was added and the sample was transferred to the High Pure Extender Assembly Unit (HPEA). The HPEA was centrifuged at 3270x g for 5 minutes, the filter tube recovered and two washing of 500 μL with Wash Buffer I and subsequently Wash Buffer II were performed. The cfDNA was eluted in 65 μL of Elution Solution, 60 μL were recovered to proceed to the Quantity, and Quality control step using the Qubit™ dsDNA HS Assay Kits and Agilent2100 Bioanalyzer respectively (see 2.4 and 2.5 sections).
2.12 Preparation of sequencing libraries
The library preparation protocol (AVENIO ctDNA Analysis Kits), supports 10 to 50 ng cfDNA input ranges with a maximum of 50 μL. A first PCR to prepare the cfDNA sample for the ligation was performed mixing DNA preparation buffer, DNA preparation enzyme, and
28
cfDNA sample. Then, to perform the sample Adapter ligation, a second overnight (o.n.) PCR was run adding the sample adapter and ligation master mix to each sample. A clean with fresh 80% ethanol and cleanup beads was performed to the post-ligation sample, followed by PCR amplification. After the PCR, the samples were washed and prepared for the target enrichment step. The amplified samples were prepared for the hybridization combining the hybridization supplemented with the hybridization master mix, Enhancing Oligo that must match the corresponding Sample Adapter used in the ligation step, and the appropriate AVENIO Expanded genes panel. The hybridization program lasted o.n. Once the hybridization finish, the hybridization cleanup was performed and a post-hybridization enrichment followed combining a PCR master mix with the sample which is amplified for 30 minutes in the thermocycler. After, the last wash for post-capture PCR was performed. The libraries so created are ready for the quantity and quality check using Qubit™ dsDNA HS Assay Kits and Agilent2100 Bioanalyzer respectively (see 2.4 and 2.7 sections).
2.13 Illumina NextSeq 550 Sequencing
Based on the libraries’ concentration, the final pool concentration is calculated. The NextSeq 550 instrument was loaded with NextSeq 500/550 High Output Kit v2.5 (300 Cycles, Illumina) included High Output Reagent Cartridge, High Output Flow Cell Cartridge, and Buffer Cartridge. The Illumina NextSeq 550 technology is based on the bridge amplification; the DNA fragments bind the complementary sequences on the flowcell. The strand attaches to a second stand forming a bridge and the reverse strand is synthesized by the enzyme DNA polymerase. The two strands release and straighten and each of them forms a new bridge resulting in a cluster of forward and reverse strand clones. Each time a tagged nucleotide is incorporated into the DNA filament, a wavelength is emitted, recorded, and transformed in bioinformatic information.
29 2.14 Sequencing Analysis
At the end of the run, the sequencing data was analyzed using AVENIO Oncology Analysis Software (Software Version 2.0.0). For each sample, several files were generated like sample metrics, variant reports, BAM, and BAI files. The information obtained concerns: -Gene (indicates the mutated gene)
-Genomic Position (chromosomal positions of the variant found) -Variant Depth (depth of reading, number of reads at that locus) -Allele Fraction (allelic frequency)
-Number of mutant molecules per mL -Transcript (transcript of the exon)
-Coding Change (variant detected respecting the reference sequence)
-Aminoacid Change (any amino acid changed on the mutated protein compared to wild-type protein)
-Variant Description (effect of the variant, missense, nonsense, silent, etc.) -Exon Number Over Total Exon (exons involved in the variants)
-ExAC Overall Frequency (database to detect rare gene variants for specific population) -1000 Genomes Frequency (database to establish a detailed catalog of human genetic variant) -COSMIC (database annotations for somatic variants in human cancers)
30
3 Results
3.2 PIK3CA-CDKN2A clonal evolution in metastatic breast cancer and multiple points
34 3.3 Two-point-NGS analysis of cancer genes in cell-free DNA of metastatic cancer patients
44 3.4 A pilot study of next generation sequencing-liquid biopsy on cell-free DNA as a novel
51 3.5 MET somatic activating mutations are responsible for lymphovenous malformation
56
3.6
Cell-free DNA next-generation sequencing liquid biopsy as a new revolutionary
59
61
4 Discussion and Conclusion
4.1 Discussion
Liquid biopsy represents a new approach for the development of non-invasive techniques targeted for personal and precision medicine [16]. In particular, cfDNA represents a valid biomarker capable to figure out the tumor heterogeneity and to monitor the clones evolutions during the progression of the disease [24].
The therapies based on molecular profiles of the primary tumor are not always efficacy because they are not representative of the evolving disease [45].
The first results that I obtained during my studies, were correlated to the clonal evolution over time in a 44-year-old female metastatic breast cancer patient. No other treatment options were available for her given the disease progression. Thanks to the two points liquid biopsy which we performed 5 months apart, we were able to capture the driver gene responsible for the disease progression. The multiple points cfDNA analysis reflects clonal evolution allowing to track the evolving molecular landscapes of growing cancer cells [46].
According to the literature evidence [47], my results obtained on a cohort of cancer patients with different tumor types shows a significant correlation between the amount of cfDNA and the disease outcome; indeed higher level of cfDNA correlates with a poor prognosis.
Regarding the allele frequency of mutated cfDNA, point mutations in TP53, PIK3CA, and KRAS and CNV (copy number variation) in FGFR3 are the most commonly observed in our cohort confirming the literature evidence [48], [49]. However, we do not correlate the affected tumor organ and the mutation type.
Again, our results show how at the metastatic stage we can observe a very simplified clonal picture characterized by one or a few "snipers" clones compared to the mutational burden of the primary tumor.
Moreover, we observed that mutations in TP53 gene are the most frequent among all mutated genes and all tumor types. Generally, mutated TP53 was found together with another mutated gene. Furthermore, when the TP53 gene was the only one mutated, it disappears at the second liquid biopsy. This evidence suggests that TP53 may acts as a co-driver gene, increasing cell growth and decreasing apoptosis, and leading to tumor progression when another cancer driver gene mutates.
62
Moreover, some germline mutations were identified in the patient cohort and consequently confirmed on blood specimens with Sanger sequencing. However, these germline mutations have a confined significance, as although they can be considered at the early stage of the disease, they should be integrated with the analysis of growing mutated clones during disease progression. Germline mutations could be useful for therapies in the first tumor stage, but not at the metastatic stage when the somatic clones have taken over.
Among the somatic alterations, were found actionable mutations. In particular, gain-of-function PIK3CA mutations hyperactive the PI3K/AKT pathway, representing a target for the inhibitors of PIK3CA or kay component of the pathway, like Alpelisib or Ipatasertib respectively. Alpelisib inhibits the catalytic subunit of PI3K and it was approved by FDA the
last year and it is studied in several clinical trials
(https://clinicaltrials.gov/ct2/results?cond=&term=ipatasertib&cntry=&state=&city=&dist=). Somatic mutations in PIK3CA are reported also in vascular malformations, and in a particular way are correlated with the overgrowth syndromes, (PROS: PIK3CA-related overgrowth syndromes), including the Klippel–Trenaunay syndrome [50].
Considering the invasiveness and the not always feasibility of tissue biopsy, our data obtained from the liquid biopsy reveals pathogenic variants in PIK3CA in Klippel-Trenaunay syndrome affected patients. The same mutations were found in the tissue analysis with a higher molecular frequency.
Among the slow-flow vascular malformations, I focused not only on the Klippel-Trenaunay syndrome but also on the lymphatic malformations. Our data show that patients with lymphatic malformations share variants of the MET gene. Comparing the allele frequency of mutated MET coming from the efferent vein of the lesion with that coming from the peripheral venous sample it is enriched in fragments.
Furthermore, the identification of somatic variants with low allelic frequency, impossible to see with a traditional tissue biopsy, are a valid aid in the identification of the phenotype and can explain the phenotypic variability.
Nevertheless, also the artero-venous (AVMs) fast-flow vascular anomalies patients were analyzed with the liquid biopsy. According to previous results obtained from Klippel-Trenaunay and lymphovenous malformations affected patients, also in AVMs patients the major quantity of cfDNA coming from the efferent venous blood. The pathogenic
mutations found were in the KRAS gene, even with a very low variant allele frequency percentage. Our data reinforce the idea that mosaic gain-of-function mutations in KRAS are involved in the development of artero-venous malformations.
63
To date, 160 metastatic cancer patients have been enrolled for liquid biopsy, however the statistical significance does not change. The data are being published in a new scientific report.
4.2 Conclusion
In conclusion, regarding the liquid biopsy studies conducted on cancer patients, during my Ph.D. course, the collected data indicate that patients should be grouped based on the mutated gene rather than tumor histology to provide a precision therapy targeting the evolving molecular profile. The two-point liquid biopsy is an effective tool able to follow the molecular evolution over time identifying the sniper gene responsible for the disease progression.
Moreover, the diagnostic use of liquid biopsy for non-oncologic patients could be a valid approach also for vascular malformations patients; indeed the sensitivity of the technique allowed us to identify low-grade somatic mosaic mutations useful to clarify the diagnosis that is not always easy to formulate.
![Figure 1. Release and extraction of cfDNA from the blood. cfDNA is released from healthy, inflamed or diseased (cancerous) tissue from cells undergoing apoptosis or necrosis [5].](https://thumb-eu.123doks.com/thumbv2/123dokorg/4631707.41033/15.893.139.769.129.616/extraction-released-inflamed-diseased-cancerous-undergoing-apoptosis-necrosis.webp)
![Figure 2. The figure lists the three main fases of cfDNA life cycle [13].](https://thumb-eu.123doks.com/thumbv2/123dokorg/4631707.41033/16.893.131.763.428.845/figure-figure-lists-main-fases-cfdna-life-cycle.webp)


![Figure 8. Incorporation of nucleotide and H + release [44].](https://thumb-eu.123doks.com/thumbv2/123dokorg/4631707.41033/36.893.165.679.252.770/figure-incorporation-nucleotide-h-release.webp)
