Department of Health Sciences
PhD PROGRAM IN MEDICAL SCIENCE AND BIOTECHNOLOGIES
XXIX cycle
Academic years 2013-2016
PhD THESIS
Prognostic Impact of a 3-MicroRNA Signature on Cytological Samples of Small-Cell Lung Cancer and on Surgical Samples of Squamous Cell Carcinoma of the Lung
SSD (settore scientifico disciplinare): MED/08 - Anatomia patologica
Supervisor:
Prof. Renzo Luciano Boldorini
PhD Coordinator: PhD Student: Prof.ssa Marisa Gariglio Giuseppe Mancuso
“In all chaos there is a cosmos, in all disorder a secret order”
“In ogni caos c'è un cosmo, in ogni disordine un ordine segreto”
Carl Gustav Jung
INDEX
1. INTRODUCTION
1.1. Types of lung cancer
1.1.1 Adenocarcinoma
1.1.2 Squamous cell carcinoma 1.1.3 SCLC
1.2 Staging of lung cancer 1.3 Therapy in lung cancer 1.4 Genetics of lung cancer 1.5 Epigenetics
1.5.1 Biogenesis of miRNA
1.5.2 Genomic Organization of miRNAs 1.5.3 Biomarkers
1.5.4 Biomarkers Lung Cancer
1.6 Focus on SCLC 1.7 Focus on SCC
2. OBJECTIVES OF THE THESIS 3. MATERIAL AND METHODS
3.1 Patients and Samples of SCLC
3.1.1 RNA Isolation in SCLC
3.2 Patients and Samples in SCC of lung
3.2.1 RNA Isolation in SCC of lung
3.3 cDNA synthesis and miRNA expression analysis by quantitative real-time PCR in SCLC and SCC of lung
3.4 Statistical analysis
4. RESULTS
4.1 Results of SCLC
4.1.1 Association between single miRNA, selected panel of miRNAs and OS 4.1.2 Association between miRNA panel, clinical variables and OS
4.1.3 Multivariate analysis
4.2 Results of SCC
4.2.1 Association Between Clinical Variables, and OS and DSS
4.2.2 Relative expression of miRNAs between SCCs and the healthy controls 4.2.3 Association between a single miRNA, and OS and DSS
4.2.4 Multivariate analysis
5. DISCUSSION
5.1 SCLC
5.2 Squamous cell carcinoma
6. REFERENCES
1. INTRODUCTION
Lung cancer continues to be the most common cause of cancer-related mortality worldwide. Every year, 1,8 million people are diagnosed with lung cancer and 1,6 million die of the disease (Ferlay et al. 2015). Almost 50% of all cases occur in the developing countries (Parkin et al. 2002). In the European Union (EU), lung cancer is the fourth most commonly diagnosed cancer, affecting more than 312,000 people every year and the main cause of cancer deaths with 267,700 deaths recorded in 2012 and it accounts for approximately 20% of all cancer deaths (ERS). In the United States in 2007, there were 203,536 people diagnosed with lung cancer and of this number, 158,683 people died from the disease (Ferlay et al. 2015).
Lung cancer was the most common cancer type among men, with 1.2 million new cases (16.7%) and almost 1.1 million deaths (23.6%), whereas in women the incidence was lower, with 583 000 new cases (8.7%) and 491 000 deaths (13.8%)(Ferlay et al. 2015). Notably, the incidence of lung cancer in women has increased 4-fold in the last 30 years (Thomas et al. 2005). Adenocarcinoma is the most common type of cancer among females and lifetime never-smokers. Worldwide incidence of adenocarcinoma has increased, replacing squamous cell carcinoma as the most common subtype (Nakamura and Saji 2013).
Despite the improvements in treatments during the last few decades, the prognosis of lung cancer is still poor and the 5 year survival rate is 15% in the United States, 10% in Europe and 9% in developing countries (Parkin 2005).The survival of lung cancer is closely related to the stage at the time of diagnosis, ranging from 70% for limited, stage I disease, to less than 5% for stage IV disease (Mountain et al. 1997).
The most common cause of lung cancer is long-term exposure to tobacco smoke, which causes 80 – 90% of all incidences (Hecht 2002). Nearly 10-25% of lung cancers worldwide occur in never smokers and the incidence of this disease among non-smokers is increasing in many countries (ELF 2016). Large-scale studies suggest that a combination of genetic factors, exposure to radon gas, asbestos fibres, and air pollution, including second-hand smoke (Thun et al. 2008) should be associated with an increases risk of lung cancer (Stieb et al. 2015; Burnett et al. 2014).
1.1. Types of lung cancer
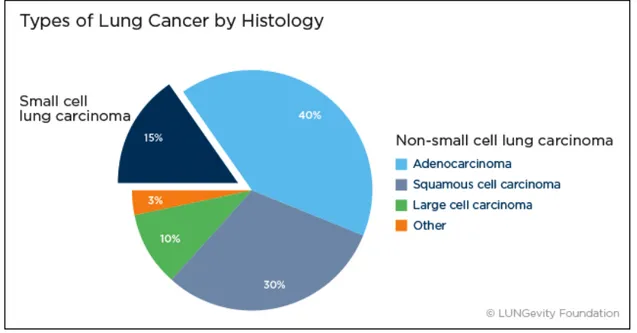
Lung cancers are classified according to the histological types and the classification has important implications for the treatment and prognosis of the disease. There are two main categories: small cell lung cancer (SCLC, 20%) and non-small cell lung cancers (NSCLC, 85%)
NSCLC is subdivided into three major histological subtypes: adenocarcinoma (40%), squamous cell carcinoma (30%), and large cell carcinoma (15%) (Herbst et al. 2008). A number of less common subtypes exist such as adenosquamous carcinoma (<5% of all lung cancers), sarcomatid carcinoma (<2% of all lung cancers) as well as very rare subtypes such as squamous cell papilloma (<0.5% of all lung cancers). Each of these types can be further classified into more specific subtypes (Travis et al. 2011).
Figure 1.1 Classification of lung cancer
1.1.1 Adenocarcinoma
Adenocarcinoma is a subtype of non-small cell lung cancer (NSCLC). It tends to develop in smaller airways, such as bronchioles, and it is usually located more along the outer edges of the lungs. It is a very heterogeneous tumour in the pathologic and molecular perspectives.
Therefore, in 2011 the International Association for the Study of Lung Cancer (IASLC), American Thoracic Society (ATS) and European Respiratory Society (ERS) developed a new pathologic classification for adenocarcinoma according to the predominant growth pattern into lepidic, acinar, papillary, solid and micropapillary variants (Travis et al. 2011).
The IASLC/ATS/ERS classification system is independently associated with overall survival (OS) and disease recurrence in adenocarcinomas (Hung et al. 2014). The characteristics of patterns can be summarized as follows.
• Lepidic pattern: neoplastic cells growing along pre-existing alveolar structures; common septal widening with sclerosis; absence of papillary or micropapillary patterns and intra-alveolar tumour cells. Lepidic predominant invasive tumors have been correlated with favourable prognosis in patients with resected lung adenocarcinoma (Lee et al. 2009).
• Acinar pattern: glands which are round to oval-shaped with a central luminal space surrounded by tumour cells Cribriform arrangement; cord-like arranged tumour cells with an acinar “polarity” should also be considered as acinar. termediate prognosis (Russell et al. 2011).
• Papillary pattern: growth of columnar cells along central fibrovascular core; papillary structures filled with alveolar spaces, even a tumour has lepidic growth; width and length of the stromal core is very variable in lung cancer. Intermediate prognosis (Russell et al. 2011
• Solid pattern: polygonal tumour cells forming sheets which lack other recognizable patterns of adenocarcinoma; cohesive cell agglomerates in a nest-like configuration without acinar polarity are the hallmark of the solid growth pattern. It is reported that solid pattern is a poor prognostic factor in lung adenocarcinoma (Hung et al. 2014; Russell et al. 2011).
• Micropapillary pattern: tumour cells growing in micropapillary tufts which lack fibrovascular cores; detached and/or connected tumour cells to alveolar walls; floating ring-like glandular structures within alveolar spaces. Micropapillary patterns have been associated with an aggressive clinical course compared with traditional papillary adenocarcinoma and bronchioloalveolar carcinoma - poor prognosis - (Amin et al. 2002; Motoi et al. 2008).
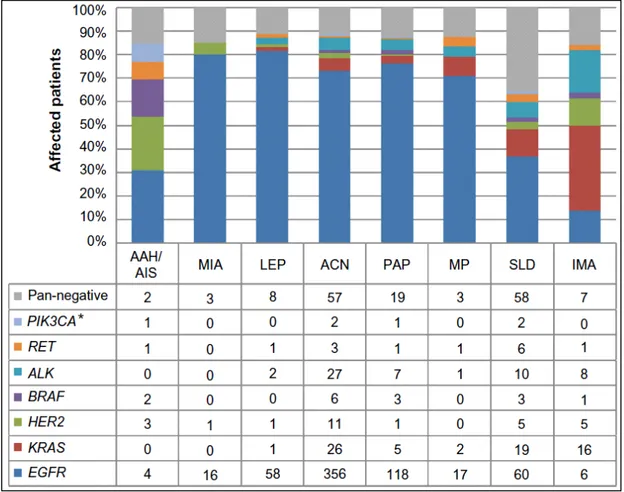
Figure 1.2 Driver mutation spectrum, according to the novel IASLC/ATS/ERS classification
Note: *Indicates samples harboring the PIK3CA mutation without overlap with other driver mutations.
Abbreviations: IASLC, International Association for the Study of Lung Cancer; ATS, American Thoracic Society; ERS, European Respiratory Society; AAH, atypical adenomatous hyperplasia; AIS, adenocarcinoma in situ; MIA, minimally
invasive adenocarcinoma; LEP, lepidic predominant; ACN, acinar predominant; PAP, papillary predominant; MP, micropapillary predominant; SLD, solid predominant; IMA, invasive mucinous adenocarcinoma.
In adenocarcinoma driver genetic alterations occur in multiple oncogenes including: K-RAS(26,9%), EGFR(9,4%), ALK (4%), MET(4%), PIK3CA(2,6%), RET (1,9%), ROS1(1,7%), BRAF(1,6%), HER2(0,9%). KRAS mutations are generally considered mutually exclusive with other driver events including EGFR, HER2 or BRAF mutations and ALK rearrangements (Sequist et al. 2011), although this statement seems questionable in the light of some recent reports. Indeed, the coexistence of EGFR/ALK and KRAS/ALK mutations in lung adenocarcinoma has been described in a few of studies (Sahnane et al. 2016; Sasaki et al. 2011; Rossi et al. 2011; Baldi et al. 2014).
1.1.2 Squamous cell carcinoma
Squamous cell carcinoma is a common form of lung cancer, accounting for approximately one-third of all cases of bronchogenic carcinomas. Squamous cell lung tumors usually occur in the central part of the lung or in one of the main airway branches (left or right bronchus).
The great majority of patients with SCC are current or former heavy smokers, furthermore, this carcinomas are most strongly associated with smoking in a dose-dependent manner (Molina et al. 2008; Ettinger et al. 2013); in contrast with adenocarcinoma, where a growing proportion are never-smokers or former light never-smokers (Khuder et al. 2001; Weiss et al. 2010). Its histogenesis may be related to chronic inflammation and injury of the bronchial epithelium, which leads to replacement of the normal ciliated columnar epithelium by a squamous epithelium (Boffetta. 2004; Brambilla et al., 2001). This transformation from a glandular epithelium to squamous epithelium is known as squamous metaplasia. Most squamous cell carcinomas arise centrally from either the main, lobar or segmental bronchi and ulcerate through the mucosa into the surrounding lung parenchyma. Their central location also tends to produces symptoms at an earlier stage than tumours located peripherally (Boffetta. 2004).
Lung SCC is a heterogeneous group of diseases and can be subdivided into 4 either histological or molecular subtypes: classical, primitive, basal, and secretory (Wilkerson et al. 2010).
• The classical subtype is the most prevalent and typical form of SCC (36% of all lung SCC). It has the highest incidence in male smokers and is characterized by alterations in KEAP1, NFE2L2 and PTEN, as well as the greatest overexpression of the three known oncogenes on chromosome 3q: SOX2, TP63 and PIK3CA (Hammerman et al. 2012). The classical subtype generally overexpresses the p63 transcription factor.
• The primitive type (15% of all lung SCC) is characterized by rapid cell proliferation, poor differentiation, and worse overall survival. It is generally enriched for expression of proliferation genes such as Minichromosome maintenance 10 (MCM10), E2F transcription factor 3 (E2F3), Thymidylate synthetase (TYMS) and Polymerase α1 (POLA1).
• The basal subtype (25%) is characterized by a well-differentiated phenotype. It is generally enriched for expression of proliferation genes such as Minichromosome maintenance 10 (MCM10), E2F transcription factor 3 (E2F3), Thymidylate synthetase (TYMS) and Polymerase α1 (POLA1).
• The secretory type (24%) shares many features with lung secretory/glandular cells and overexpresses genes responsible for mediating immune responses such as Surfactant and Mucin 1 (MUC1).
In contrast to adenocarcinoma, the frequency of EGFR mutations and the EML-ALK translocation are very low in SCC, and mainly reported in Asian and never smoker patients (Lee et al. 2016; Jin et al. 2012). On the other hand, many other oncogenic alterations have been described in lung SCC, including SOX2 amplification, dysregulation of the KEAP-NFE2L2 pathway, aberrant PI3K pathway activity, FGFR1 amplification, and DDR2 mutation (Drilon et al. 2012; Minuti et al. 2013). None of these are are currently useful in clinical practice.
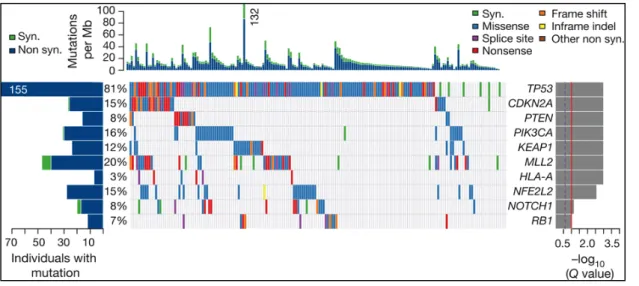
Figure 1.3 Driver mutation in Squamous cell carcinoma
Individual markers can aid pathologic differentiation between adenocarcinoma versus squamous histology. Adenocarcinomas tend to stain for mucin (Alcian blue/periodic acid Schiff), thyroid transcription factor 1 (TTF-1), and cytokeratin. Squamous lung carcinoma, in contrast, may stain for tumours protein p63 (p63), S100 calcium-binding protein A7 (S100A7), cytokeratin 5/6, and other high molecular weight cytokeratins.
1.1.3 SCLC
SCLC is defined as “a malignant epithelial tumour consisting of small cells with scant cytoplasm, ill-defined cell borders, finely granular nuclear chromatin, and absent or inconspicuous nucleoli” (Travis et al. 2011).
From patients with SCLC, about 30% of them, they will have limited-stage disease (LD) (Murray et al. 1993). This means that the tumours of these patients are restricted to the hemithorax of origin, the mediastinum, or the supraclavicular lymph nodes. When the tumours are spread beyond the supraclavicular areas, then these patients have extensive-stage disease (ED). Patients with distant metastases are also considered to have ED (Shepherd et al. 2007).
The most frequently genetic abnormalities in SCLC are inactivation mutations in tumour suppressor genes such as TP53 and retinoblastoma gene 1 (RB1); other genetic alterations including overexpression of BCL-2 and only infrequent gain-of-function mutations in oncogenes such as PI3K3 or MYC family members (D'Amico et al. 1992; Yuan et al. 1999).
In contrast to other types of lung cancer, molecular markers that help to predict the prognosis or guide the choice of therapy in patients with SCLC are still lacking.
1.2 Staging of lung cancer
All cancers are staged using the international Tumour, Node, Metastasis (TNM) system published by the Union for International Cancer Control. These staging guidelines are continuously being revised and updated. The T describes the size of the original (primary) tumour and whether it has invaded nearby tissue. The N describes nearby (regional) lymph nodes that are involved. The M describes distant metastasis (spread of cancer from one part of the body to another).
• Stage I: The cancer is located only in the lungs and has not spread to any lymph nodes.
• Stage II: The cancer is in the lung and nearby lymph nodes.
• Stage III: Cancer is found in the lung and in the lymph nodes in the middle of the chest, also described as locally advanced disease. Stage III has two subtypes:
If the cancer has spread only to lymph nodes on the same side of the chest where the cancer started, it is called stage IIIA.
If the cancer has spread to the lymph nodes on the opposite side of the chest, or above the collar bone, it is called stage IIIB.
• Stage IV: This is the most advanced stage of lung cancer, and is also described as advanced disease. This is when the cancer has spread to both lungs, to fluid in the area around the lungs, or to another part of the body, such as the liver or other organs.
1.3 Therapy in lung cancer
Most stage I and stage II non-small cell lung cancers are treated with surgery to remove the tumour. Surgery is the recommended treatment for patients with stage I–II non-small-cell lung cancer (NSCLC) (Vansteenkiste et al. 2014). 5-year survival is 77–92% for clinical stage IA, 68% for stage IB, 60% for stage IIA, and 53% for stage IIB. By pathological stage, 5-year survival is 80–90% for stage IA, 73% for stage IB, 65% for stage IIA, and 56% for stage IIB (Goldstraw et al. 2016). Treatment for stage IIIA NSCLC may include some combination of radiation therapy, chemotherapy (chemo), and/or surgery. For this reason, planning treatment for stage IIIA NSCLC often requires input from a medical oncologist, radiation oncologist, and a thoracic surgeon. Stage IIIB NSCLC has spread to lymph nodes that are near the other lung or in the neck, and may also have grown into important structures in the chest. These cancers cannot be removed completely by surgery. As with other stages of lung cancer, treatment depends on the patient’s overall health. In stage IV lung cancer, chemotherapy is typically the main treatment and radiation is used only for palliation of symptoms. Until the mid-2000’s, treatment options were mostly limited to surgery, chemotherapy and radiation. Now, people diagnosed with lung cancer often have newer, more personalized treatment options.
EGFR mutations
The epidermal growth factor receptor (EGFR, HER-1/ErbB1) is a receptor tyrosine kinase (TK) of the ErbB family, which consists of four closely related receptors: 1/ErbB1, HER-2/neu/ErbB2, HER-3/ErbB3 and HER-4/ErbB4.
Epidermal growth factor receptor inhibitors can block the signal from EGFR that tells the cells to grow. Some of these drugs can be used to treat NSCLC. EGFR inhibitors used in NSCLC with EGFR gene mutations: Erlotinib (Tarceva™), Afatinib (Gilotrif™), Gefitinib (Iressa™). EGFR inhibitors can often shrink tumors for several months or more. But, eventually, these drugs stop working for most people, usually because the cancer cells develop another mutation in the EGFR gene. How this acquired resistance towards tyrosine kinase inhibitors occurs is not fully understood, but secondary mutations in EGFR and amplification of the oncogene MET are common in these patients. The most common secondary EGFR mutation is the substitution of methionine for threonine at position 790 (T790M) (Balak et al. 2006). Osimertinib therapy is the current standard of care for patients with EGFR mutation-positive NSCLC who develop EGFR T790M after prior EGFR-TKI therapy. Mechanisms of resistance to osimertinib therapy have also been reported. In a preclinical cell line study, acquired EGFR C797S mutation (the substitution of cysteine with serine
at amino acid position 797, EGFR C797S) was identified as a mechanism of resistance to osimertinib therapy.
Other mechanisms of resistance to osimertinib therapy have also been identified in cell line studies, including NRAS E63K mutation and gains of copy number for wild-type NRAS and wild-type KRAS (Liao et al. 2016)
ALK translocation
The first evidence of differences between anaplastic lymphoma kinase (ALK) gene-echinoderm microtubule-associated protein-like 4 (EML4) translocated and wild-type counterparts lung tumours arose in 2007 (Soda et al. 2007).
Crizotinib is a first generation multi tyrosine kinases inhibitor of ALK, MET, and ROS1 that demonstrated a meaningful activity on ALK positive NSCLCs. In the earliest experiences with crizotinib in advanced and heavily pretreated NSCLC ALK positive patients, this drug showed an impressive response rate achieved in approximately 60% of patients with a median PFS of 7–10 months (Kwak et al. 2010; Camidge et al. 2012; Kim et al. 2012). Given these promising results, crizotinib obtained US Food and Drug Administration (FDA) approval in 2011, specifically in ALK positive patients using the Vysis ALK Break-Apart FISH Probe Kit (Abbott Molecular, Inc.). Within the first years after treatment with crizotinib, resistance could occur. Some biologic mechanisms could explain the drug resistance, like secondary mutations and copy number gain in the ALK gene; activation of the bypass tracks, including EGFR, KRAS, KIT, MET, and IGF-1R (Toyokawa and Seto 2015). However, different ALK inhibitors have been recently developed, like alectinib, ceritinib, brigatinib (AP26113), and lorlatinib.
KRAS mutations
The most common KRAS mutation are missense substitutions in codons 12, 13, or 61. These mutations result in a constitutively active RAS due to malfunctioning of the RAS GTPase.
In general, the presence of KRAS mutation excludes EGFR mutation or ALK translocation. It is not druggable, so one way to inhibit KRAS is to use the inhibition of its downstream pathway, like MEK inhibition (Janne et al. 2013).
ROS1 translocation
ROS1 fusion is the product of chromosomal rearrangement of ROS1 gene. It is identified in approximately 1% of lung cancers, and it is associated with adenocarcinoma histology, and is typically observed in younger patients and those who have never smoked. OS1 receptor has a TK domain; its activation provokes cell growth and proliferation. Kinase receptor of ALK and ROS1 is similar, so they can be blocked with the same drugs (Cortinovis et al. 2016).
C-MET amplification
The MET proto-oncogene encodes for the receptor tyrosine kinase (RTK), c-MET. Cells of epithelial–endothelial origin widely express c-MET, where it is essential for embryonic development (Brand-Saberi et al. 1996; Heymann et al. 1996; Bladt et al. 1995) and tissue repair (Borowiak et al. 2004). Because of its pleotrophic role in cellular processes important in oncogenesis and cancer progression, c-MET is considered to be an important target in anticancer therapy (Trusolino et al. 2010). Several molecules targeting c-MET have recently been evaluated in early phase clinical trials. Most of them are small kinase inhibitors, while some are biological antagonists and monoclonal antibodies targeting either the ligand or the receptor (Eder et al. 2009; Comoglio et al. 2008;).
DDR2 mutation
The DDR2 gene encodes a cell surface RTK that is mutated to an active form in about 4% of squamous cell carcinomas of the lung (Heist et al. 2012). Dasatinib inhibits DDR2, and one patient treated with the combination of dasatinib and erlotinib had a tumour response. Clinical trials to determine dasatinib efficacies are underway.
HER2
Human epidermal growth factor receptor 2 (HER2) is a member of the ERBB receptor tyrosine kinase family. Binding of ligand leads to dimerisation and activation of HER2 TK activity. Activated HER2 then phosphorylates its substrates leading to the activation of multiple downstream pathways including PI3K-AKT-mTOR and RAS-RAF-MEK-ERK pathways. NSCLC, amplification of HER2 detected by FISH is found in 2%–4% of NSCLC patients. HER2 overexpression by immunohistochemistry is detected in 13%–20% of NSCLC samples, although strong expression is only found in 2%–4% (Hirsch et al. 2002; Heinmoller et al. 2003). About 1%– 2% of adenocarcinoma patients harbor mutations in the exon 20 of HER2 (Arcila et al. 2012; Stephens et al. 2004). Although commonly found in never smokers with adenocarcinoma, HER2
mutations are also reported in other subsets of NSCLC (Buttitta et al. 2006). HER2 amplification is a negative prognostic marker as shown in a recent meta-analysis (Liu et al. 2010). Preclinical data suggests that the presence of HER2 mutation is associated with primary resistance to the first generation EGFR TKIs, erlotinib, and gefitinib. However, cells expressing the HER2 exon 20 mutation are sensitive to the irreversible dual EGFR and HER2 TKIs, lapatinib, neratinib, and afatinib (Wang et al. 2006; Li et al. 2008).
BRAF mutation
BRAF (v-Raf murine sarcoma viral oncogene homolog B) is a serine-threonine kinase belonging to the RAF kinase family lying downstream of KRAS and directly interacting with the MEK-ERK signaling cascade. In lung adenocarcinoma BRAF mutations are found in 1%–5%, half of them harboring the classical V600E mutation (Naoki et al. 2002; Marchetti et al. 2011). Unlike melanoma, NSCLCs mostly harbor non- Val600Glu mutations including the Leu596Val mutation in the kinase domain (Davies et al. 2002; Sasaki et al. 2006; Naoki et al. 2002). The various BRAF mutations observed in NSCLC are as follows: G466V, G469A, L597V and V600E. BRAF mutations are mutually exclusive to EGFR and KRAS mutations and have been associated with decreased sensitivity to the EGFR TKI, gefitinib (Gandhi et al. 2009). BRAF V600E mutations are associated with light/never smoker status, micropapillary histology and occur more frequently in female patients. In contrary, non-V600E mutations are more frequent in former or current smokers and are associated with poorer outcome (Marchetti et al. 2001; Paik et al. 2011). Multiple BRAF inhibitors like PLX4032 (molecular inhibitor selective for BRAF), sorafenib (a multikinase inhibitor of RAF-1, BRAF, VEGF, and PDGF), and CI-1040 (a first-generation-specific inhibitor of MAP kinase) are currently under development.
Often, targeted therapies work well for a period of time, but then stop working (the cancer develops “resistance”). This is more common with some drugs than others. Principal mechanisms of chemoresistance include: altered membrane transport involving the P-glycoprotein product of the multidrug resistance (MDR) gene as well as other associated proteins; altered target enzyme (e.g. mutated topoisomerase II); decreased drug activation; increased nuclear receptor activation; increased drug metabolism and elimination due to altered expression of cytochrome P450 enzymes; drug inactivation due to conjugation with increased glutathione; subcellular redistribution; drug interaction; enhanced DNA repair and failure to apoptose as a result of mutated cell cycle proteins such as p53.
Immunotherapy
Immunotherapy has long been considered the holy grail of Oncology. Different attempts have been made to harness body’s immune system to eradicate malignancy. Immunotherapeutic approaches are based on the premise that the immune system plays a key role in surveillance and the eradication of malignancy, and tumours evolve in order to elude the immune system.
Lung cancer has the second highest mutation burden after melanoma, which increases its susceptibility to immunotherapy (Alexandrov et al. 2013).
Several monoclonal antibodies directed to the PD-1 receptor (nivolumab, pembrolizumab) or its ligand PD-L1 (atezolizumab, durvalumab, avelumab) have reached the clinic, and others are in preclinical development. Nivolumab is a fully human IgG4 immune checkpoint inhibitory antibody, which binds to PD-1, preventing its interaction with its ligands PD-L1 (also called B7-H1 or CD274) and PD-L2 (also called B7-DC or CD273).
Different approaches have been taken to PD-L1 IHC assessment, using different diagnostic antibodies to assess PD-L1 expression, different technical staining platforms, and different definitions of a “positive” predictive IHC stain. In some cases, expression of PD-L1 on immune effector cells as opposed to, or in combination with, expression in tumour cell has been chosen as biomarker. There is variable interpretation of the intensity and distribution of staining and variable definition of a positive PD-L1 stain ranging from staining of ≥1% to ≥50% of cells assessed. In some cases, the test requires at least 100 tumour cells to be assessed (Kerr et al. 2015).
Regarding the assay itself, the influences of preanalytical variables, applicability across different staining platforms, usage on different sample types (large tumor samples, small biopsies, and cytology), intralaboratory and interlaboratory reproducibility, intraobserver and interobserver variability, and epitope stability in stored materials are matters for further study (Kerr et al. 2015).
1.4 Genetics of lung cancer
The aberrant activation of multiple signal pathways, such as RAS/RAF/MEK, PI3K/AKT/mTOR and STAT leads to the uncontrolled growth of cancer and impaired cell death signalling.
The PI3K/AKT/mTOR signalling pathway is involved in the survival, proliferation, and migration of SCLC and NSCLC (Wojtalla et al. 2013, Tsurutani et al. 2006). The PI3K/AKT/mTOR signalling pathway may be activated in cancer through multiple mechanisms including mutations in PIK3CA, which encodes the catalytic subunit of PI3K, loss or mutation of phosphatase and tensin homolog (PTEN), AKT mutations and deregulation of mammalian target of rapamycin (mTOR) complexes (Samuels et al., 2004).
Umemura et al. (2014) found in about 50 SCLC cases a higher penetrance of activating alterations of the PI3K/AKT/mTOR pathway that act in a mutually exclusive manner. One cause of therapeutic resistance is inactivation of cancer suppressor PTEN, which allows over-activation of the PTEN/PI3K/AKT pathway. Evidence has shown that the poor prognosis of patients with NSCLC of all stages and therapeutic failure are associated with a number of abnormally activated signalling PI3K/AKT pathway, and this is more common in SCC than in AD (Drilon et al. 2012).
The major characteristics of malignant tumour cells are their ability to invade foreign tissues and form metastatic foci at distant locations in the body. Such processes require tumour cell attachment to various matrix proteins and the degradation of the extracellular matrix (ECM), mainly by matrix metalloproteinase (MMP) that may facilitate tumour invasion, metastasis and angiogenesis.
Increased levels of MMPs have been detected in numerous cancers and were correlated with tumour aggressiveness (Shuman Moss et al. 2012). For example, MMP-1, −2, −7, −9, −14, and −15 were overexpressed in NSCLC (Leinonen et al. 2006; Shah et al. 2010; Stenvold et al. 2012), and elevated MMP-1, −9, −11, −13, and −14 levels were also shown in SCLC (Michael et al. 1999; Rintoul et al. 2001). The TIMP3 and RECK has an inhibitory effect on tumour metastasis due to its interaction with MMPs. A clinical study showed that the expression of TIMP-3 was reduced in a number of cancer types and reduced expression of TIMP-3 was significantly associated with pathologic stage, nodal involvement, and poor survival in lung cancer patients. RECK (reversion-inducing cysteine-rich protein with Kazal motifs) is a membrane anchored glycoprotein which regulates MMPs and inhibits angiogenesis. Recent analyses indicate that RECK expression is frequently down-regulated in tumour tissues in comparison with the surrounding non-tumours tissues in several common types of cancer including colon, mammary, pancreatic carcinoma and lung cancer (Noda et al. 2003; Pesta et al. 2009).
DNA damages give rise to mutations and epimutations that, by a process of natural selection, can cause progression to cancer. If DNA damages in proliferating cells are not repaired due to inadequate expression of a DNA repair gene, this increases the risk of cancer. Many known carcinogenic agents cause reduced expression of DNA repair genes or directly inhibit the actions of DNA repair proteins.
The NER system is essential for repairing DNA damage such as pyrimidine dimers, cross-links, and bulky adducts induced by platinum chemotherapy. Excision repair cross-complementation group 1 (ERCC1) is one of polypeptides of the nucleotide excision repair (NER) system. ERCC1 plays a pivotal role in DNA repair by removal of DNA-platinum adduct, which inhibits DNA synthesis in cancer cells. Some gene expression of markers of sensitivity to specific cytotoxic agents, such as thymidylate synthase (TYMS) and dihydrofolate reductase (DHFR), enzyme that plays an important
role in DNA synthesis. In NSCLC, overexpression of TYMS is associated with poor prognosis following lung resection and low TYMS mRNA level is associated with better response to neoadjuvant pemetrexed/gemcitabine treatment (Liu et al. 2015).
1.5 Epigenetics
Epigenetics consists of heritable modifications to the chromatin that influence gene expression and other DNA- dependent processes without directly altering the DNA coding sequence (Holliday 1987). Mutations in epigenetic regulatory mechanisms and epigenetic pattern perturbations are implicated in many tumor types, including lung cancer, occurring through tumor suppressor gene silencing and oncogene activation (Jones and Baylin 2002). These complex processes involve DNA methylation, microRNA (miRNAs) regulation, and histone/ nucleosome modifications.
During the last 15 years, miRNAs have been in the limelight of human genetics due to their involvement in the development of several pathologies, particularly cancers. MiRNAs are a class of evolutionarily conserved, small non-coding RNAs of 19-24 nucleotides in length that regulate gene expression mostly at the posttranscriptional level (Bartel 2009). Public database, miRBase
(http://www.mirbase.org/) (last access: XX Gennaio 2017) provides various aspects of microRNA
information, and the annotated human microRNAs of 1881 have been registered in miRBase 21.
1.5.1 Biogenesis of miRNA
The biosynthesis of miRNAs is a tightly regulated multistep process that starts in the nucleus of the cell, following transcription, and continues through the cytoplasm where finally the mature miRNA molecule exerts its main function.
Briefly, the biogenesis of miRNAs starts with their transcription by RNA polymerase II although some other miRNAs are transcribed by RNA polymerase III (Borchert et al. 2006) resulting in a primary transcript known as pri-miRNA. A typical pri-miRNA consists of a stem of 33–35 bp, a terminal loop and single-stranded RNA segments at both the 5ʹ and 3ʹ sides. The nuclear RNase III Drosha initiates miRNA processing. This stem-loop structure is recognized by Drosha as part of a
microprocessor complex in conjunction with a dsRNA-binding protein DGCR8. Drosha cleaves the
pri-miRNA at the base of the stem-loop, releasing it from the flanking single-stranded regions. Cleavage of both arms of the stem-loop is dependent on the tandem RNase III domains of Drosha binding and cleaving the dsRNA stem. The released stem-loop structure is exported from the nucleus by exportin 5 and is known as a pre-miRNA. Once, in the cytoplasm, a second RNase III, Dicer, together with its dsRBD protein partner, the trans-activator RNA (tar)-binding protein (TRBP) makes a pair of cuts that defines the other end of the mature miRNA, liberating an
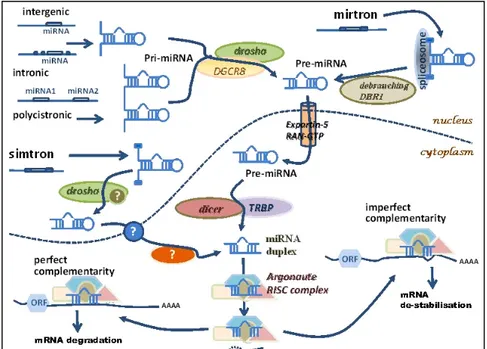
21-nucleotide RNA duplex. Double stranded mRNA is generally a transient imperfect duplex molecule consisting of a passenger strand and a mature microRNA strand (also referred to as guide strand) commonly denoted miRNA:miRNA*, where the passenger strand is designated miRNA*. One of the strands of the miRNA duplex is incorporated into an Argonaute (Ago) protein, forming the minimal effector RNA induced silencing complex (miRISC). miRISC is the cytoplasmic effector machine of the miRNA pathway and contains a single-stranded miRNA guiding it to its target mRNAs. Activated miRISC binds target mRNA through Watson-Crick base-pairing between the guide strand and the 3’UTR of the target . This binding of miRISC leads, dependent on the degree of miRNA complementarity, to the inhibition of mRNA translation, or mRNA cleavage and subsequent degradation (Lin and Gregory 2015)(figure 1.5).
Figure 1.5 Biogenesis of miRNAs
1.5.2 Genomic Organization of miRNAs
MiRNAs sequences are distributed all throughout the genome, being localized in exonic or intronic regions, as well as intergenic locations (Altuvia et al. 2005).
According to a recent annotation of known and novel miRNAs, most of the known miRNAs map to intergenic regions (~70%) and introns (~12%). Smaller proportions map to repeat regions (~8%), exons (~5%), and long noncoding transcripts (~5%) (Londin et al. 2015). In human, there are almost equal numbers of known intergenic and intragenic miRNA genes (Paczynska et al., 2015).
proximal to each other and are thought to be described in clusters (Altuvia et al., 2005). Clustered miRNAs are transcribed as polycystronic RNAs by polymerase II, while other miRNAs are transcribed as monocystronic miRNAs. There are usually two or three genes per cluster and the largest cluster, at 13q31 (17-92 cluster), is composed of seven (17-5p, 17-3p, miR-18a, miR-19a, miR-20a, miR-19b and miR-92-1) (Calin et al. 2002; He et al. 2005). In humans approximately 50% of known human miRNAs are found in clusters and they are transcribed as polycistronic primary transcripts (Lagos-Quintana et al. 2001; Lau et al. 2001). This genomic organization confers simultaneous expression of similar miRNAs, possibly leading to a synergistic effect in their ultimate function.
1.5.3 Biomarkers
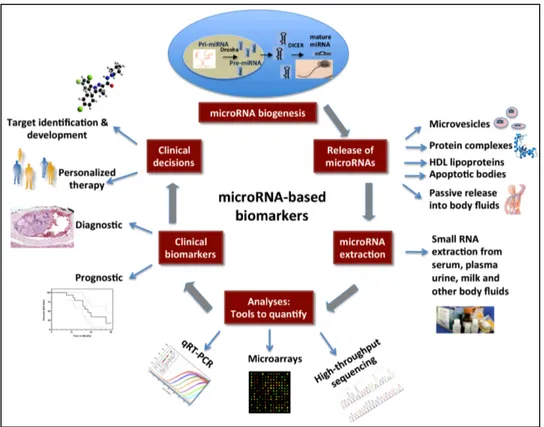
Initially, miRNAs were thought to be involved in the regulation of development and cell fate, but more recently it has been discovered that miRNAs partecipate in a broad range of processes including cell cycling, apoptosis, cell differentiation, tumour development, invasion, metastasis, and angiogenesis (Friedman et al. 2009). In particular, miRNAs have been observed to be aberrantly expressed in many human cancers (Cortez et al. 2011) and they are promising alternative biomarkers for detecting cancer, establishing prognosis, and monitoring treatment response, as well as crucial players in cancer initiation, development and metastasis (Cortez et al. 2011). The possible applications of miRNAs in molecular prognostics, particularly in cancer, are provided by discovery of the role of miRNA in many pathological processes, and for cancer prognosis; miRNA can be complementary to other genomic and proteomic biomarkers (Cho 2007). From the biological point of view, miRNAs may be better predictive and prognostic markers than DNA or mRNA. A single miRNA, indeed, may regulate hundreds of target mRNAs, frequently grouped in a specific biological pathway. Consequently, a miRNA signature may provide comparable prognostic information several orders of magnitude greater than mRNAs.
Besides miRNAs are more stable than other biomarkers during sample processing, thus more suitable for analysis in plasma, urine, stool and tissue (fresh or FFPE - Formalin-fixed, paraffin-embedded) sample and this is a key point in the search for cancer markers.
However, the underlying mechanisms of miRNA deregulation in human cancer are still not thoroughly understood. Increasing evidence indicates that transcriptional deregulations, epigenetic alterations, mutations, DNA copy number abnormalities and defects in the miRNA biogenesis machinery might be the possible mechanisms, these mechanisms may each contribute, either alone or more likely together to miRNA deregulation in human cancer (Deng et al. 2008). Deregulation of enzymes and cofactors involved in biogenesis pathways can affect the levels of mature miRNAs
and have important biological ramifications. For example, deletion of a single Dicer1 allele in lung epithelia promotes Kras-driven lung adenocarcinomas, whereas complete ablation of Dicer1 causes lethality because of the need for miRNAs in essential processes (Kumar et al. 2009). In addition, global repression of miRNA biogenesis by suppression of the key components of miRNA processing machinery, such as Drosha, DGCR8, Dicer, TRBP, and XPO5, promotes cellular transformation and tumorigenesis (Melo 2009 and 2010, Chang 2008, Kumar 2007).
Several recent studies have demonstrated how oncogenic miRNAs may interfere with DNA-repair pathways allowing cells to resist drugs that initially were effective against them (Giovannetti et al. 2012). To restore drug sensitivity via miRNAs, potential approaches include activation of tumour suppressor miRNAs or inactivation of oncogenic miRNAs and modulation of miRNA target genes, oncogenes, and tumour suppressor genes, through up- or down-regulation of miRNAs (Sarkar et al. 2010; Giovannetti et al. 2012).
Recent studies have indicated an emerging role for miRNAs, in addition to genetic and epigenetic changes (methylation/acetylation), in the anticancer-drug-resistant phenotype (Giovannetti et al. 2012), which opens up the possible application of miRNAs in evaluation of outcome and modification of response in known anti-tumour therapies (Hummel et al. 2010). The discovery of the roles of miRNAs in carcinogenesis has propelled miRNAs to become focal targets for novel therapeutic approaches, and efforts have been made in recent years to develop miRNA-based therapeutics. We could suppose that miRNAs will be the future targets of molecular-based drugs, as demonstrated by MRX34, the first mimic-miRNA that enters in a phase I clinical trial for the treatment of liver cancer (Paloma et al. 2015).
Figure 1.6 Clinical applications of miRNAs
1.5.4 Biomarkers Lung Cancer
The growing number of studies examining the global changes in miRNA expression and those focusing on the role of specific individual miRNAs in lung tumors suggests that these molecules may play a role in the pathogenesis of lung cancer and serve as biomarkers for the diagnosis and prognosis of diseases.
A number of studies have shown that miRNAs are differentially secreted into the serum or blood of lung cancer patients (Chen et al. 2008; Hu et al. 2010). Since the first report of miRNA deregulation expression in cancers (Calin et al. 2002), these small RNAs are now recognized to be key regulators for tumor pathogenesis and markers for novel clinical interventions. A major oncogenic miRNA in lung cancer is the miR-17~92 cluster. The expression of miR-17~92 is subject to transactivation by E2F family members (Sylvestre et al. 2007) and MYC (O'Donnell et al. 2005) with the latter frequently overexpressed in SCLC (Takahashi et al. 1989).
Hsa-let-7 was the first miRNA reported to play a role in the development and progression of lung cancer. Reduced hsa-let-7 expression in NSCLC patients was significantly associated with shortened postoperative survival, independent of disease stage (Takamizawa et al. 2004).
Another study showed that high expression of miRNA-146b and miRNA-155 in lung SCC and adenocarcinoma, respectively, was associated with poor OS of the patients after surgical resection
of the tumour (Raponi et al. 2009; Yanaihara et al. 2006). miRNA expression profiling of formalin-fixed, paraffin-embedded (FFPE) NSCLC tumors of stage I-III has shown that miRNA-221, 137, 372, 182* and let-7a have prognostic value (Yu et al. 2008).
Generating miRNA signatures and classifiers can point basic researchers towards targets for investigations that can maximize the usefulness of information concerning diagnostic and chemotherapeutic outcomes in NSCLC patients.
Finally, there are very few studies dealing with the feasibility of the expression of miRNA on cytological samples, following the report of two examples. Fassina et al. develop a miRNA expression method for differentiating AD from SCC in cytologic specimens obtained by means of such a minimally invasive and safe technique as CT-guided TTNA (Fassina et al. 2011). Gilad et al. develop an assay based only of the expression of a small set of miRNAs that may help to differentiate the four main types of lung cancer. The assay displays high levels of accuracy in pathologic and cytologic samples. For the latter, fine-needle aspiration (FNA) and bronchial brushing and washing samples were tested, demonstrating the versatility of the assay (Gilad et al. 2012).
In light of these results, we selected three miRNA that were previously reported to be involved in processes or pathways that have been associated with a prognostic and predictive role, namely PI3K/AKT/mTOR pathway 192; miR-200c, miR-205), regulation of MMPs expression (miR-200c, miR-205) and DNA damages/repair (miR-192).
1.6 Focus on SCLC
the diagnosis of SCLC could be suspected on the basis of clinical presentation and imaging studies but pathologic confirm is required. Cytology from bronchoscopy or from fine-needle aspirations (FNAs) are often the preferred approaches in order to achieve the diagnosis, either from primary tumor or from metastasis because of the minimal trauma to the patient and ease of sample acquisition. Cytologic diagnosis needs to be confirmed by immunohistochemistry for several markers like cytokeratins, TTF-1, chromogranin, synaptophysin or CD56, that can be performed on cell blocks or on direct smears.
The prognosis for patients with SCLC is poor, with a median survival of 4 to 12 months depending on the stage of their disease. The best prognostic factors include limited-stage disease (LD) (TNM stages I-III), age less than 70 years, female sex, performance status (ECOG/WHO) less than 1 and normal baseline concentrations of LDH, sodium, alkaline phosphatase, and bicarbonate in serum. Recently, panels of miRNAs have been proposed as promising markers useful to predict chemoresistance and prognosis in non-SCLC treated with systemic chemotherapy. In another study,
miRNA microarray analysis was performed in order to identify unique signature profile helpful to predict survival and chemoresistance also in SCLC, with promising results.
However, main limitations of the microarray technology are lower specificity and sensitivity compared with qRT-PCR and the difficulty to perform the analysis in routine clinical setting.
The first end-point of our study was to evaluate whether miRNA expression analysis could be feasible also in cytological specimens with various fixation methods, and therefore potentially applicable to routine samples.
1.7 Focus on SCC
Prognostic factors for SCC have been mostly derived from surgically resected tumors in patients with early-stage disease.
SCC of the lung is separated as a unique clinical and histologic category of NSCLC. In general, SCCs tend to be locally aggressive with metastasis to distant organs occurring less frequently than in adenocarcinomas of the lung (Drilon 2012). Immunohistochemical (IHC) analysis for both P63 and TTF1 has been established as an effective approach to determine lineage in morphologically challenging situations (Travis et al. 2011); SCC consistently express P63 and are negative for TTF1. Even when surgery and other therapies are initially successful, SCC can return. This is because cancer cells can start to spread without being detected right away. Increasing evidence suggests that SCC and adenocarcinoma of the lung are molecularly two separate entities (McDoniels-Silvers et al. 2002). However, in contrast to lung adenocarcinoma, still now no approved targeted therapies are available for SCC. The targeted drugs developed for lung adenocarcinoma such as EGFR tyrosine kinase inhibitor (EGFR-TKI) and ALK inhibitor, are largely ineffective against SCC. In view of the high rate of relapse and the lack of predictive biomarkers, it is critical to develop biomarkers that can identify high-risk early stage of desease and a new therapeutic strategy is required for patients with resectable SCCs.
2. OBJECTIVES OF THE THESIS
A) SCLC
Since most of the SCLCs are yet diagnosed in cytologic samples or in small biopsies, often containing a limited number of neoplastic cells, the first objective was the evaluation of the feasibility of miRNA extraction in clinical samples, after their use for immunohistochemistry analysis, and the possible influence of the different types of fixative solution in the preservation of the integrity of miRNA. Moreover, we tried to identify a panel of miRNAs possibly useful in clinical practice as prognostic and /or predictive biomarkers.
B) SCC
In this subset of lung cancers, our project was addressed to search for the useful of the same miRNA panel used for SCLC, as prognostic biomarker in operable tumors, by comparing the different level of expression of N0 tumors vs N+ tumors in stage I II and III.
! ! ! ! ! ! ! ! ! ! ! ! ! ! ! ! ! ! !
3. MATERIAL AND METHODS
3.1 Patients and Samples of SCLC
Cytologic samples from 50 consecutive patients with SCLC were collected from the archives of Pathology Unit of University Hospital of Novara between January 2006 and December 2014. Twenty-five samples (50%) were from primary tumours and 25 from metastatic regional lymph nodes. Forty-four samples (88%) were obtained by fine needle aspirations (FNAs), and six (12%) by bronchial washing (BWs).
FNAs were performed using 21 or 22-gauge disposable needles, immediately smeared onto a glass slide and spray-fixed using ethanol (Bio-Fix, Bio Optica, Milan, Italy). Part of the needle content was also washed in lysing solution and centrifuged at 1,800 g to obtain cell blocks. They were prepared using agarose gel and fixed in ethanol.
Specimens from bronchial washing were centrifuged to obtain a cell pellet, then the pellet was partially smeared onto a glass slide and spray-fixed, whereas the remaining part was fixed with Duboscq-Brazil fluid for 24 hours; afterward, paraffin-embedded cell blocks were prepared and sectioned. Specimens from slide obtained by transferring smear to glass slide were stained with the Papanicolaou stain and permanently mounted. The sections obtained by cutting paraffin-embedded cell blocks, were stained by haematoxylin-eosin and by immunohistochemistry to define the diagnosis of SCLC. A panel of immunohistochemistry was used in all the cases and included the following antibodies: synaptophysin, CD56, chromogranin, and CK AE1/AE3 (Ventana Medical System, Tucson, AZ). The reactions were performed by means of Benchmark instruments (Ventana Medical System).
Ten normal lung tissue samples obtained from surgical resection of lung carcinoma were selected after light microscopy examination and used as positive controls.
3.1.1 RNA Isolation in SCLC
Total RNA from cell blocks and papanicolaou-stained smear slide was extracted using RecoverAllTM Total Nucleic Acid Isolation Kit (Life TechnologiesTM).
An alternative method of microdissection was set-up with a higher yield and it turned up to be more accurate to extract RNA from neoplastic areas, discriminating between normal cells and necrotic areas. A different method consists in this: 3-µm-thick sections were placed on glass slides, ten slides for each cellblock. Then, each slide was stained with H&E staining and uncovered. H&E staining was performed with Leica ST5020 Multistainer, and the program was set as follows: 4 times in ovens/slide drying stations for 5 minute at 62°C, xylene for 3 minute x 3, absolute (100%)
ethanol for 2 minute x 2, ethanol 95% for 1 minute, water for 4 minute, Mayer's hemalum for 10 minute, water for 8 minute, eosin for 1 minute, water for 10 second, ethanol 95% for 40 second, absolute ethanol for 2 minute x 2, xylene for 4 minute.
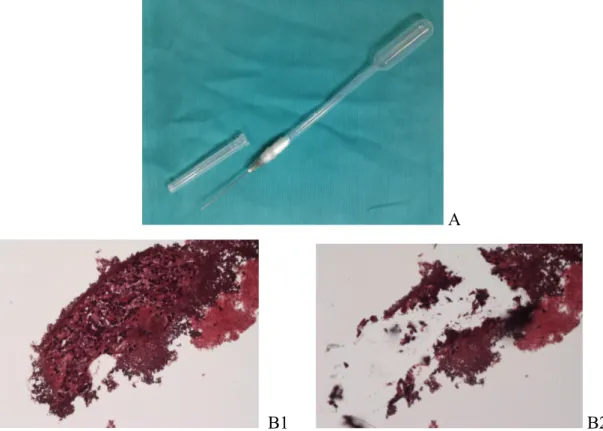
Throughout microdissection, it was necessary to use absolute ethanol with the aid of a modified pipette-needle, to prevent the loss of material (due to electrostatic phenomena during sample collection). This device consists of a 22-gauge-needle inserted in a Pasteur pipette and wrapped with parafilm in order to maintain an airtight seal between the two devices (figure 3.1 A). All glass slides samples were observed with a microscope Eclipse 80i (Nikon) with magnification of 10X. RNA detection was performed from uncovered stained slides by collecting tumour cells with modified pipette-needle and absolute ethanol (figure 3.1 B). The specimen soaking in absolute ethanol was transferred into a 1.5 mL tube, made up to 1 mL with ethanol and centrifuged at 14.000 rpm for 7 min. Then, supernatant was carefully discharged and the pellet was retained. The pellet was dried in Concentrator 5301 (Eppendorf) at 30°C for 45 minute. Thereafter, manufacturer's instructions of RecoverAllTM Total Nucleic Acid Isolation Kit (Life TechnologiesTM) were followed by Protease Digestion to the Final Nucleic Acid Purification. RNA purity and concentration were determined by NanoDrop.
A
B1 B2
Figure 3.1. A) Modified pipette-needle: 22-gauge-needle inserted in a Pasteur pipette and wrapped
3.2 Patients and Samples in SCC of lung
A total of 86 formalin-fixed paraffin-embedded (FFPE) surgical samples of patients with lung SCC were collected retrospectively from the archives of Pathology Unit of University Hospital of Novara between February 2009 and December 2012.
The following eligibility criteria were used: stage I to III at diagnosis; complete resection of the primary lung tumor; no treatment with chemotherapy or radiotherapy before surgery; absence of cancer within the 5 years before surgery. In all the cases, the morphologic diagnosis was confirmed by immunohistochemistry (p40 and/or p63 positivity). Tumor stage was determined according to the 2009 TNM staging classification system. Hematoxylin-Eosin (H&E) slides were reviewed by an expert pathologist who marked the tumor area without necrosis and with more than 50% of tumor cells. Furthermore, 10 normal lung tissue samples obtained from surgical resection of non-neoplastic diseases, were selected after light microscopy examination and used as control.
3.2.1 RNA Isolation in SCC of lung
Total RNA containing small RNA was extracted from FFPE of SCC patients and from normal lung tissue using RecoverAllTM Total Nucleic Acid Isolation Kit (Life TechnologiesTM, USA).
Briefly, FFPE tissues were cut into 4–5 sections of 5-µm thickness. Tumor tissues and normal tissues were carefully macro-dissected from section slides using a scalpel and transferred into a sterile 1.5-ml centrifuge tube. Thereafter, the samples were deparaffinized and extracted according to the manufacturer's instructions. RNA purity and concentration were determined by Spectrophotometer NanoDrop 2000c (Thermo Scientific, USA).
3.3 cDNA synthesis and miRNA expression analysis by quantitative real-time PCR in SCLC and SCC of lung
Complementary DNA (cDNA) was synthesised using the TaqMan® MicroRNA Reverse Trancription Kit and TaqMan® MicroRNA Assays. For each reverse transcription reaction 50 ng of RNA and 3 µL of 5X RT microRNA-specific primers were used in a reaction volume of 15 µL. cDNA synthesis was performed by incubation at 16 °C for 30 min, 42 °C for 30 min, 85°C for 5 min and hold at 4°C. Real-time PCR reaction was performed using 1.40 µL of cDNA, 10 µL TaqMan® Fast Universal PCR Master Mix without AmpErase® UNG and 1 µL of primer/probe mixture in a total reaction volume of 20 µL. Real-time PCR was performed using the 7500 Fast Real Time PCR System (Applied Biosystems, USA) with PCR initial enzyme activation step at 95°C for 10 min and then 40 cycles of denaturation at 95°C for 15 s and annealing/extension at 60°C for 1 min.
The expression of hsa-miR-192-5p (Assay ID:000491), hsa-miR-200c-3p (Assay ID:002300) and hsa-miR-205-5p (Assay ID:000509) was analyzed and RNU6B (U6 snRNA; Assay ID:001093) was used as an endogenous control for normalization of expression levels; all TaqMan primer/probe were purchased form Applied Biosystems (TaqMan® MicroRNA Assay). Each sample was examined in triplicate.
MiRNA expression levels (relative quantity, RQ) were calculated using the comparative Ct method (Livak and Schmittgen, 2001): 2−(ΔCt Tumor – ΔCt Normal Tissues) , ΔCt values were calculated using (Ct miRNA – Ct RNU6B) either in tumor and in a pool of normal lung tissues.
3.4 Statistical analysis
Stata Statistical Software (release 13.0 College Station, Stata Corporation, TX, USA) was used in all the statistical analyses. Survival data were analyzed by the Kaplan-Meier method and the survival curves were compared by the log-rank test. The variables putatively associated with the survival were analyzed by use of univariate Cox proportional hazards regression model. The variables selected by the univariate analysis were entered into a multivariate Cox model using a forward stepwise elimination algorithm (terms with p > 0.05 were eligible for removal)
The optimal cut-off point of miRNA espression only for SCC was calculated using the X-Tile.
! ! ! ! ! ! ! ! ! ! ! ! ! ! ! ! ! ! ! ! ! !
4. RESULTS
4.1 Results of SCLC
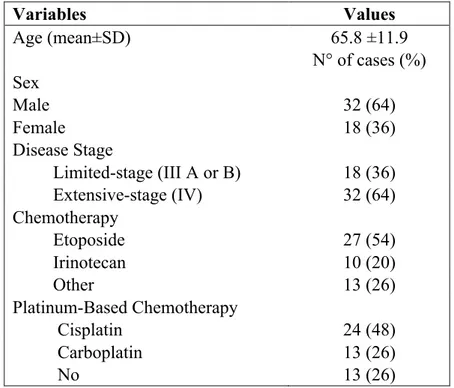
The diagnosis of SCLC was made on the basis of cytologic findings, and immunohistochemical positivity for cytokeratin and at least one of the neural markers (i.e. synaptophysin, CD56 or chromogranin). Main patients’ demographic and clinicopathologic characteristics are summarised in Table 4.1.1. The mean age at diagnosis was 65.8 years (range 34-82 years), 32 patients (64%) were male and 18 were female (36%). At the end of the study 43 patients (86%) had died. The median overall survival (OS) was 42.4 weeks (range 1.2 to 354.6 weeks). Eighteen patients (36%) had LD (III A or III B), whereas 32 patients (64%) had extensive-stage disease (ED) (IV). Twenty-four patients (48%) received cisplatin-containing chemotherapy, 13 (26%) were treated with carboplatin-containing regimens, whereas 13 (26%) received best supportive care only.
Variables Values Age (mean±SD) 65.8 ±11.9 N° of cases (%) Sex Male 32 (64) Female 18 (36) Disease Stage Limited-stage (III A or B) 18 (36) Extensive-stage (IV) 32 (64) Chemotherapy Etoposide 27 (54) Irinotecan 10 (20) Other 13 (26) Platinum-Based Chemotherapy Cisplatin 24 (48) Carboplatin 13 (26) No 13 (26)
Table 4.1.1. Main Clinicopathologic Characteristics of 50 SCLC Patients
!
4.1.1 Association between single miRNA, selected panel of miRNAs and OS
All 50 samples had sufficient RNA to perform a miRNA expression profiling of the 3-miRNA panel selected for this study (miR-192, miR-200c, miR-205), regardless of sample source and type of processing and fixation methods. Mir-192, miR-200c and miR-205 were significantly overexpressed (respectively P = .0006; P = .0034; P = .0003) in patients with SCLC than in healthy controls.
Medians of relative expression levels of each miRNA (miR-192, median 2-ΔΔCt = 13.59; miR-200c, median 2-ΔΔCt = 1.81; miR-205, median 2-ΔΔCt = 2.52) were used as cut-off points in order to divide the patients into high (score 1) and low expression (score 0) groups. Subsequently, Kaplan-Meier survival curves were generated for the two groups of patients and the difference between the curves was assessed by log-rank test. There was no significant difference in OS between the high and low expression groups of each single miRNA (miR-192, log-rank P = .362; miR-200c, log-rank P = .219; miR-205, log-rank P = .224; data not shown).
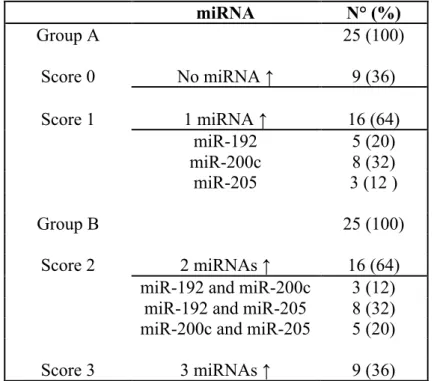
Then, the sum of the previous score of the three miRNAs [i.e. (miR-192 = 1) + (miR-200c=1) + (miR-205=1) = 3] was calculated for every patient in order to obtain a cumulative score ranging from 0 (level of expression of all miRNAs lower than the median value) to 3 (level of expression of all 3 miRNAs higher than the median value). Thereafter, the patients were divided into two groups: group A (n=25) with a score 0 or 1 (low-expression miRNA panel), and group B (n=25) with a score 2 or 3 (high-expression miRNA panel) (Table 4.1.2).
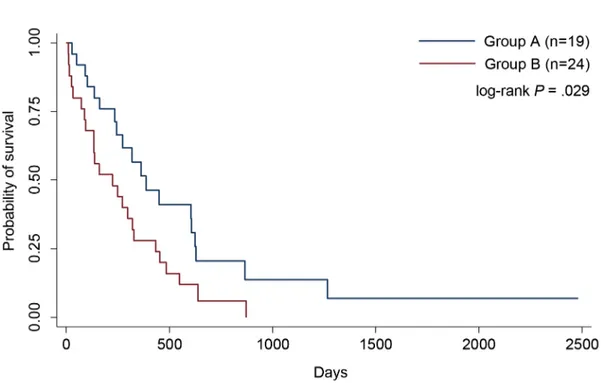
Next, we performed a Kaplan-Meier analysis to compare survival between group A and group B, and the results showed that patients of group A had a significantly better OS than those of group B (P = .029) (Figure 4.1.1). miRNA N° (%) Group A 25 (100) Score 0 No miRNA ↑ 9 (36) Score 1 1 miRNA ↑ 16 (64) miR-192 5 (20) miR-200c 8 (32) miR-205 3 (12 ) Group B 25 (100) Score 2 2 miRNAs ↑ 16 (64)
miR-192 and miR-200c 3 (12) miR-192 and miR-205 8 (32) miR-200c and miR-205 5 (20)
Score 3 3 miRNAs ↑ 9 (36)
Table 4.1.2. Distribution of patients according to different score*
Figure 4.1.1. Survival analysis based on miRNA panel expression. The red line depicts survival curve for Group B (high expression profile), and the blue line depicts survival curve for Group A (low expression profile). The survival curves were found to be significantly different with a log-rank P .029
4.1.2 Association between miRNA panel, clinical variables and OS
Clinical variables considered were age at diagnosis and stage of disease. In our cohort, the mean age at diagnosis was 65.8 years: the group of patients older than the mean age showed a lower OS than the younger patients (Figure 4.1.2 A), although the result was not statistically significant (P = .051). As expected, also in our cohort, the patients with LD patients showed significantly better OS than ED patients (P = .049) (Figure 4.1.2 B).
Furthermore, we analysed the association between clinical variables and OS in relation to miRNA expression panel (group A and group B), for this reason we divided patients in LD, ED, age less than and greater than 65.8 years. We did not find any difference in OS between the group A and the group B, and also between LD patients (P = .515) and ED patients (P = .400) (data not shown). Interestingly, in the older patients the OS was significantly better in the group A, than in the group B (P = .013; Figure 4.1.3 A); whereas there was no difference in OS between group A and group B (P = .407) in the younger patients (Figure 4.1.3 B).
Figure 4.1.2. Survival analysis based on mean age and stage of disease. A) The red line depicts survival curve for old patients (Age > 65.8), and the blue line depicts survival curve for young patients (Age ≤ 65.8); log-rank P = .052; B) The red line depicts survival curve for patients with extensive-stage disease, and the blue line depicts survival curve for patients with limited-stage disease; log-rank P = .049.
A B
Figure 4.1.3. Survival analysis based on patients older and younger than 65.8 years and miRNA
panel. A)Curve for old patients (Age ≥ 65.8); The red line depicts survival curve for the patients of the Group B (high expression profile), and the blue line depicts survival curve for the patients of the Group A (low expression profile); log-rank P = .013. B) Curve for young patients (Age ≤ 65.8) and miRNA panel, log-rank P = .407.
4.1.3 Multivariate analysis
The variables putatively associated with the survival were individually analyzed by use of univariate Cox proportional hazards regression model (Table 4.1.3).
Significant variables in the univariate analysis (mean age, miR-200c, miR-205, 3-miRNA panel and stage) were added to a multivariate model, and backward elimination was applied at the 5% significance level. Mean Age (≤ 65.8 years versus > 65.8 years), Stage (LD versus ED) and 3-miRNA Panel (group A versus group B) were the only significant predictors.
Univariate Cox regression HR (95% CI) P
Sex 1.06 (0.56 – 1.97) .861 miR-192 1.00 (0.997 – 1.01) .308 miR-200c 1.04 (1.00- 1.10) .018* miR-205 1.00 (1.00 – 1.00) .039* Age Mean 1.88 (0.98 – 3.58) .050* Median miR-192 1.33 (0.72 – 2.45) .364 Median mirR-200c 1.46 (0.8 – 2.67) .222 Median miR-205 1.46 (0.79 – 2.69) .226 3-miRNA panel 1.97 (1.06 – 3.65) .032* Stage 1.89 (0.99 – 3.58) .050*
Multivariate Cox Regression HR (95% CI) P
Age Mean 2.63 (1.32 – 5.25) .006
Stage 2.09 (1.07 – 4.08) .030
3-miRNA panel 2.10 (1.11 – 4.04) .022
Table 4.1.3. Univariate and Multivariate Analysis of overall survival in 50 SCLC patients
Abbreviations: HR, Hazard ratio; CI, Confidence interval; *, significant variables included in the multivariate analysis. Reference categories. Sex : male gender; Age: values less the than the mean; Median miR-192, Median mirR-200c, Median miR-205: values less than the correspondent medians; 3-miRNA panel: group A (score 0-1); Stage: group LD (limited-diseased)
4.2 Results of SCC.
The mean age at diagnosis was 69.9 years (range, 52-83 years); 76 patients (88%) were male, and 10 were female (12%). At the end of the study, 13 patients (15%) had recurrence, and 31 (36%) had died. The causes of mortality included tumour-related death or tumour-related complications. The median overall survival (OS) was 1436 days (range, 0-2561 days).
Forty-four patients (51%) were in stage I, 29 (34%) in stage II, and 13 (15%) in stage III according to the WHO classification. Twenty-six patients (30%) had lymph node metastasis; in 33 patients (38%) SCC was well or moderately differentiated, and in 53 (62%) was poorly differentiated. All patients were former (n=57; 66%) or current (n=29; 34%) smokers. Thirty-one patients (36%) had previous cancer diagnosis (five years before the diagnosis of SCC); summarize in Table 4.2.1.
4.2.1 Association Between Clinical Variables, and OS and DSS
The clinical variables were: stage of disease, grading, lymph node status, previous diagnosis of malignant tumours and recurrence. As expected, better OS and DSS were found in patients without recurrence (respectively P = .0050 and P = .0003), tumours in stage T 1 and 2 (according to TNM classification; respectively P = .0236 and P = .0017), and without lymph node metastases (respectively P = .0064 and P = .0026), patients with clinical stage I (respectively P = .0049 and P = .0003), and without previous diagnosis of malignant tumours (only for OS P = .0049), as shown in table 4.2.2
4.2.2 Relative expression of miRNAs between SCCs and the healthy controls
RNA was successfully extracted from all FFPE samples. Mir-205 and miR-200c were significantly overexpressed (P <.0001 and P. 021) in patients with SCC than in healthy controls, whereas miR-192 was significantly down-expressed (P .0002) in patients with SCC than in the healthy controls.
Variables Values
Age (range years) 69.9 (52-83)
N° of cases (%) Sex Male 76 (88) Female 10 (22) Smoking Status Former 57 (66) Current 29 (34) Diabetes Yes 11 (13) No 75 (87) Hypertension Yes 34 (40) No 52 (60) BPCO Yes 12 (14) No 74 (86) Previous Cancer Diagnosis
Yes 31 (36) No 55 (64) T parameter of TNM 1 23 (27) 2 48 (56) 3 14 (16) 4 1 (1)
Lymph Node Status
N0 60 (70) N+ 26 (30) Staging I 44 (51) II 29 (34) III 13 (15) Grading G2 33 (38) G3 53 (62) Recurrence Yes 13 (15) No 73 (85)
Variables OS (months) log rank Test DSS (months) log rank Test Mean Age 69.9 < 59.03 P = .7881 61.65 P = .4337 69.9 > 61.31 67.28 Sex Male 60.86 P = .9689 64.98 P = .8224 Female 60.36 67.05 Smoking Status Former 61.88 P = .8168 66.30 P = .6982 Current 59.02 63.39 Diabetes Yes 55.08 P = .5476 60.58 P = .5369 No 62.95 67.44 Hypertension Yes 57.98 P = .3792 64.53 P = .6502 No 63.68 66.83 BPCO Yes 75.06 P = .1286 79.82 P = .0986 No 58.35 62.73
Previous Cancer Diagnosis
Yes 49.09 P = .0049* 57.91 P = .0720
No 67.91 70.29
T parameter of TNM
T1-2 65.21 P = .0236* 71.01 P = .0017*
T3-4 45.95 45.95
Lymph Node Status
N0 68.04 P = .0064* 72.92 P = .0026* N+ 42.20 45.41 Clinical staging I 71.50 P = .0049* 78.39 P = .0003* II-III 51.23 53.61 Grading G2 64.04 P = .3670 67.84 P = .3854 G3 59.35 63.79 Recurrence Yes 41.60 P = .0050* 41.60 P = .0003* No 65.31 70.98
4.2.3 Association between a single miRNA, and OS and DSS
Camp et al. have developed a graphical method, the X-tile plot that illustrates the presence of substantial tumour subpopulations and shows the robustness of the relationship between a biomarker and outcome by construction of a two dimensional projection of every possible subpopulation. An “optimal” cut-off value for each miRNA was determined by utilizing the X-Tile software application (Camp et al. 2004). This enables the division of patients into high-expression (score 1) and low-expression groups (score 0) (Figure 4.2.1).
Figure 4.2.1. Screenshot of X-Tile software. Cut-off of 2-ΔΔCt miR-192 ≥ 0.515; Cut-off of 2-ΔΔCt miR-200c ≥ 2.341; Cut-off of 2-ΔΔCt miR-205 ≥ 13.85.
Interestingly, a statistically significant difference in OS between high- and low-expression groups was found only for miR-192 (P = .031). Moreover, patients with high expression levels of each single miRNA had better DSS than the patients with low levels, although miR-205 is not