DOTTORATO DI RICERCA IN
"FARMACOLOGIA ED ONCOLOGIA MOLECOLARE"
CICLO XXICOORDINATORE Prof. Pier Andrea Borea
A Regulatory “miRcircuitry” Involving miR221&222 and
ERα Determines ERα Status of Breast Cancer Cells
Settore Scientifico Disciplinare BIO/17
Dottorando Tutori
Dott. Di Leva Gianpiero Dott. Volinia Stefano
(firma) (firma)
Prof. Croce M. Carlo
(firma)
INDEX ABSTRACT (English Version)
ABSTRACT (Italian Version) INTRODUCTION
1. The discovery of microRNAs.
2. miRNAs: genomic, biogenesis and mechanisms of action.
2a. How many miRNAs are enough? 2b. Genomics of microRNAs.
2c. MicroRNAs Transcription and Maturation.
2d. MicroRNA in action: RISC and gene target inhibition.
3. microRNAs: function in normal and disease states. 4. Aim of this study.
METHODS
1. Cell Culture and Tumor Samples. 2. Plasmid Constructions.
3. Microarray Analysis.
4. Real Time PCR.
5. Acrylamide and Agarose Northern Blot Detection.
6. ChIP Assay.
RESULTS
1. Up-Modulation of miR221&222 in ERα-negative Cells and Primary Tumors. 2. ERα Is Target of miR221&222.
3. Differential Effect of miR221&222 and miR206 on Gene Expression in Breast Cancer.
4. ERα Negatively Regulates miR221&222 Expression.
5. Genomic Structure and Transcriptional Regulation of miR221&222.
6. Co-occupancy of ERα and Co-repressor Proteins, NCoR and SMRT, at miR221&222 Genomic Region.
DISCUSSION.
AKNOWLEDGEMENT. REFERENCES
APPENDIX
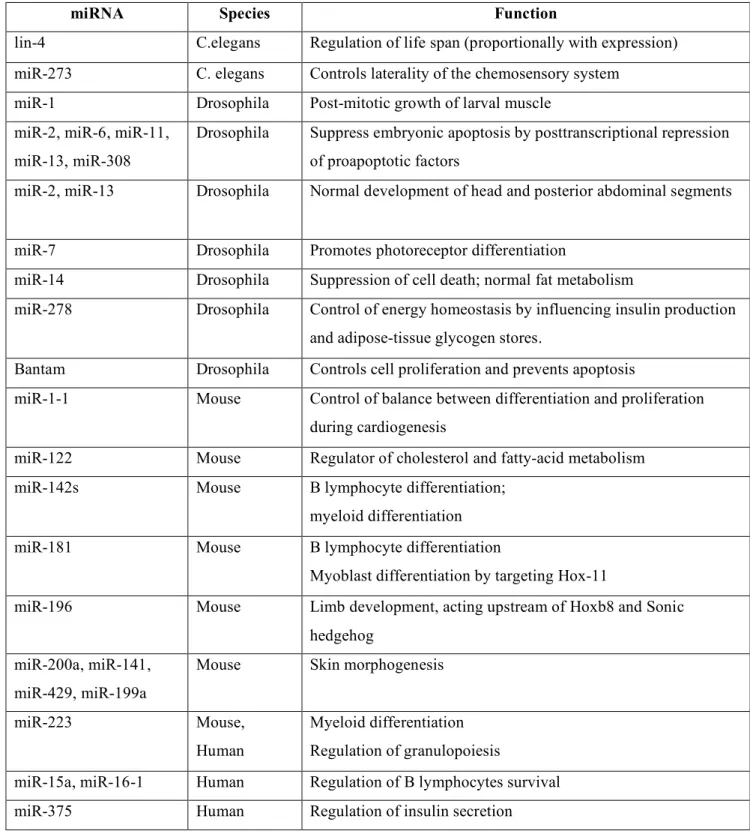
Table 1. Examples of functions of microRNAs in animals.
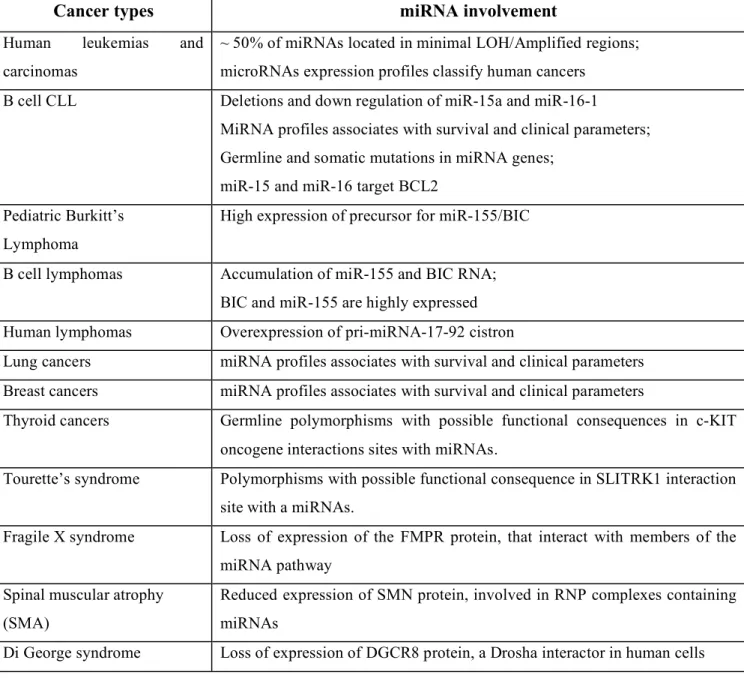
Table 2. Examples of microRNAs involvement in human diseases.
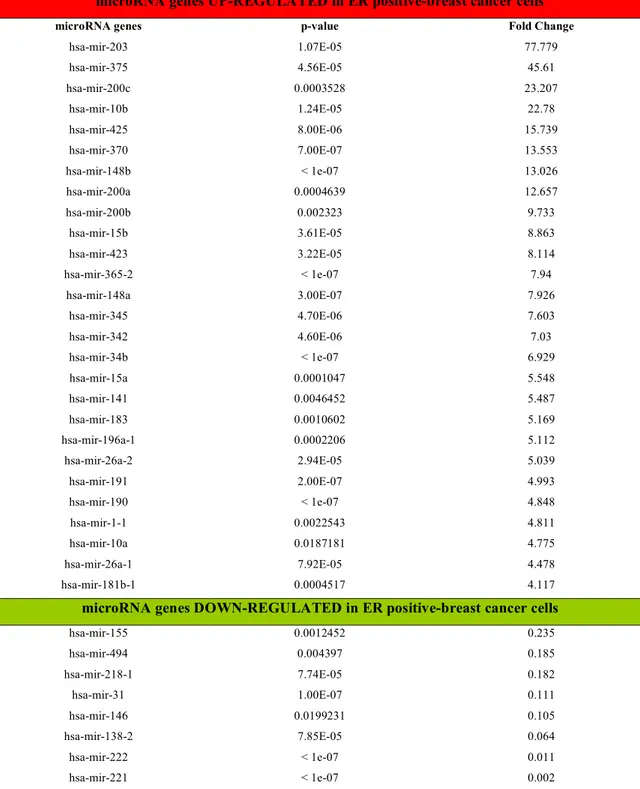
Table 3. miRNAs differentially expressed in ER-positive versus ER-negative breast cancer
cells.
Table 4. Patients and Tumors characteristics.
Figure S1. miR221&222 Binding Sites in the ERα 3`UTR. Primers List.
ABSTRACT (English Version).
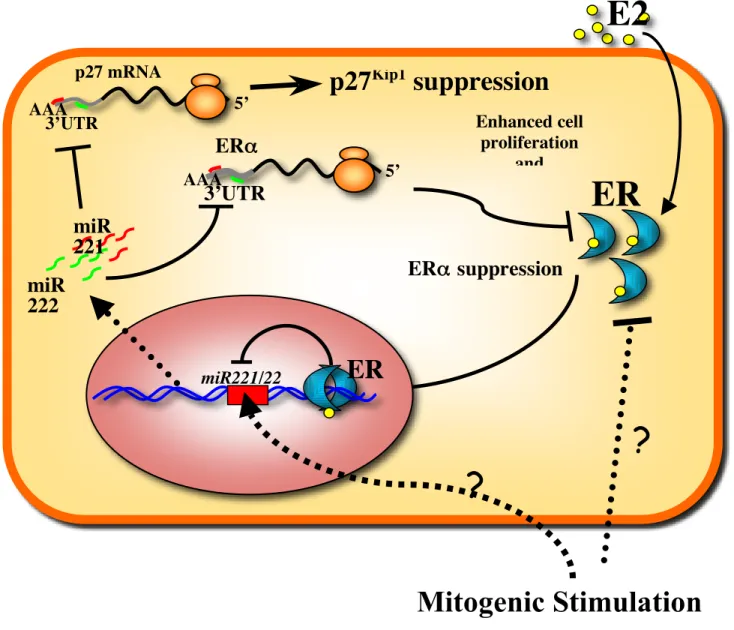
Estrogen Receptor α (ERα) is the most important diagnostic and prognostic factor in breast cancer. Several lines of evidence have suggested that ERα-negative breast tumors, highly aggressive and non-responsive to hormonal therapy, arise from ERα-positive precursors through different molecular pathways. microRNAs (miRs) are small non-coding RNAs that regulate gene expression at post-transcriptional level and are aberrantly expressed in breast cancer. We hypothesized that microRNAs may have a pivotal role in ERα suppression and ERα-negative tumors formation. MicroRNAs microarray, quantitative real-time PCR, immunohistochemistry and in-situ hybridization analyses of breast cancer cell lines and primary tumors with different ERα-status indicated that miR221&222 are exclusively expressed in negative breast tumors. Overexpression of both microRNAs in ERα-positive cell lines strongly reduces the levels of ERα protein and, using luciferase reporter assays, we clearly demonstrated that ERα is a bona fide target of miR221&222. Gene expression profiles were analyzed after miR221 or miR222 over-expression in ERα-positive cells: up-regulation of anti-apoptotic genes, growth factors and down modulation of adhesion molecules indicated that miR221&222 may not only increase the ability to suppress apoptosis and accelerate tumor formation but also promote remodeling of the tumor microenvironment and escape of tumor cells through the basement membrane, all characteristics of ERα-negative cells. To gain more insights into the inverse correlation between miR221&222 and ERα in breast cancer, by computational analyses and reporter assay, we characterized the transcriptional unit of miR221&222. We identified several estrogen-responsive elements (ERE) at the genomic locus of miR221&222 and, by using different approaches, we demonstrated that ERα suppresses miR221&222 expression. Overexpression of exogenous or endogenous ERα protein in ERα-negative cells markedly repressed miR221&222; conversely, knockdown of ERα in ERα-positive cells increased their expression. Finally, chromatin immunoprecipitation (ChIP) on ERα-positive cells showed that ligand-bound ERα and its co-repressor proteins, NcoR and SMRT, were highly enriched at miR221&222 genomic locus. Notably, ChIP experiments after estradiol (E2) stimulation or ERα-knockdown revealed that ERα recruitment is essential for the co-repressor enrichment and miR221&222 repression. These findings suggest that the negative
regulatory loop involving miR221&222 and ERα may confer proliferative advantage and migratory activity to breast cancer cells and promote the transition from ERα-positive to ERα-negative tumors. Therefore, the elucidation of this pathway could be an important step in the development of the next generation of breast cancer therapeutics agents that may prevent hormone-resistance that frequently occurs during treatment.
ABSTRACT (Italian Version).
Il recettore degli estrogeni (ERα) e` il piu` importante fattore diagnostico e prognostico nel cancro della mammella. Numerosi studi hanno proposto che i tumori ERα negativi, altamente aggressivi e non-responsivi alla terapia ormonale, hanno origine da precursori ERα positivi. I microRNA (miRs) sono piccoli RNA non codificanti che regolano l`espressione genica a livello post-trascrizionale e sono espressi in maniera aberrante nel cancro della mammella. In questo studio abbiamo ipotizzato e dimostrato che i microRNA possano esercitare un ruolo importante nella soppressione dell` ERα ed indurre la formazione dei tumori ERα-negativi. A tale scopo, analisi di microarray, qRT-PCR, immunoistochimica e in situ-ibridazione sono state impiegate per analizzare l`espressione dei microRNA in linee cellulari e tumori primitivi di mammella. Tali analisi hanno evidenziato che il miR221 ed il miR222 sono esclusivamente espressi nei tumori della mammella ERα negativi. L`over-espressione di miR221 o miR222 in linee cellulari ERα-positive riduce fortemente i livelli proteici di ERα e, usando saggi reporter di luciferasi, abbiamo chiaramente dimostrato che ERα e` target diretto di miR221&222. Analisi di microarray sono state realizzate dopo l`over-espressione di miR221 o mir222 in linee cellulari ERα-positive: up-regolazione di geni anti-apoptotici, fattori di crescita e down-modulazione di molecole di adesione cellulare hanno indicato che miR221 o miR222 possono non solo ridurre l`apoptosi ed accelerare la crescita tumorale ma anche promuovere il rimodellamento dello stroma circostante la regione tumorale e facilitare il movimento delle cellule tumorali, tutte caratteristiche delle cellule ERα-negative.
Successivamente, utilizzando analisi computazionali e saggi reporter di luciferasi, abbiamo identificato l`unita` trascrizionale dei miR221&222 e valutato la presenza di numerosi elementi responsivi agli estrogeni (ERE) nel locus genomico di miR221&222. Attraverso l`utilizzo di differenti approcci molecolari, abbiamo dimostrato che ERα sopprime l`espressione di miR221&222. In particolare, l`over-espressione di ERα in cellule ERα-negative sopprime i livelli dei miR221&222; viceversa, la down-regolazione di ERa mediante RNAi in cellule ERα-positive aumenta la loro espressione. Infine, analisi di ChIP (Chromatin Immunoprecipitation) realizzata su linee cellulari ERα-positive hanno evidenziato che il recettore degli estrogeni e i suoi co-repressori, NcoR e SMRT, sono altamente arricchiti nella regione genomica di miR221&222. Di nota, esperimenti di ChIP
dopo stimolazione con estradiolo o di knockdown contro ERα hanno evidenziato che il recrutamento di ERα e` essenziale per il recrutamento dei co-repressori e repressione di miR221&222.
Tali risultati suggeriscono che il circuito regolativo coinvolgente miR221&222 e ERα, conferendo alle cellule tumorali un vantaggio proliferativo e forte attivita` migratoria, potrebbe promuovere la transizione da tumori positivi a tumori negativi per l`espressione del recettore degli estrogeni. Quindi l`elucidazione di questo pathway potrebbe rappresentare un importante passo avanti nello sviluppo di nuove terapie anti-tumorali per il cancro al seno.
INTRODUCTION
1. The discovery of microRNAs
The discovery of microRNAs began in the early 1981 when Martin Chalfie, during a loss-of-function study in C. elegans, discovered that mutations in lin-4 gene lead to continued synthesis of larval-specific cuticle 1. At that time, together with lin-14, lin-29, and lin-28, these genes were classified as heterochronic genes, capable to control the timing of specific post-embryonic developmental events in C. elegans. Seven year later, Victor Ambros described, in hypodermal cells, a hierarchy of interaction between the heterochronic regulatory genes to coordinate the “larva-to-adult switch”: the experiments have shown that, in the early stages of development, lin-14 and lin-28 inhibit lin-29, preventing the switch; next, lin-4 inhibits lin-14 and lin-28, triggering the activation of lin-29 and the following switch in L4 larval stage 2.
Lin-14 has been shown to encode a nuclear protein that is normally present in most somatic cells of late embryos and L1 larvae but not in the later larval stages or adults. Gary Ruvkun found that two lin-14 gain-of-function mutations lead to an abnormal protein accumulation in the later larval stages; these mutations delete the 3` untranslated region of lin-14 mRNA, highlighting a regulatory element in the 3`UTR of lin-14 mRNA that controls the temporal gradient of the protein 3. Since lin-4 was described to down-regulate the lin-14 protein temporal levels, the authors proposed that lin-4 gene product could be the trans-acting factor capable to bind the 3`UTR of lin-14 and negatively regulate it. Finally in 1993, two independent studies, published in the same issue of “Cell” by Ambros and Ruvkun 4 5, presented the real nature of lin-4 gene and its ability to regulate the heterochronic gene expression. After cloning the lin-4 gene, they demonstrated that the potential open-reading frame of lin-4 does not encode for a protein; they identified two small lin-4 transcripts of approximately 22 and 61 nt and found that the 3` UTR of lin-14 mRNA contains sequences complementary to lin-4 small RNA products. According to these data, the authors suggested that the temporal regulation of lin-14 is operated at the protein translation level driven by lin4 RNA via antisense RNA-RNA interactions, involving the small RNA lin-4 and the 3`UTR of lin-14. Seven years latter, Reinhart et al. showed that let-7 gene, another heterochronic switch gene, is coding for a small 21 nt RNA with complementary sequence to the 3`UTR of lin-14, lin-28, lin-41, lin-42 and daf-12; they proposed that the sequential stage-specific
expression of let-7 and lin-4 RNAs was capable through an RNA-RNA interaction with the 3`UTR of the target genes to trigger the temporal cascade of regulatory heterochronic genes specifying the timing of C. elegans developmental events 6.
At that time, these discoveries were considered as a new piece in the complicated gene expression regulation puzzle restricted to the small temporal RNA let-7 and lin-4 (stRNA) in worms. This idea was completely changed when independent groups tried to investigate whether RNAs similar to stRNA could play a more general role in gene regulation 7,8 9. Isolating and cloning the small RNA from different organisms and cellular systems, by using the same strategy applied to clone siRNA processed from exogenous dsRNAs in an embryo lysate, researchers in three laboratories were able to isolate a group of RNAs with the same characteristics of lin-4 and let-7, providing evidence for the existence of a large class of small RNAs with potential regulatory roles. Because with their small size, the authors referred to these novel RNAs as microRNA (abbreviated miRNAs), a new abundant class of riboregulators that could regulate the gene expression at post-translational level by base-pairing the 3`UTR of mRNA targets. After this discovery, a new challenge for the researchers was to define the biological function and the potential target genes of these new genes.
2 MiRNAs: GENOMICS, BIOGENESIS AND MECHANISM OF ACTION
2a. How many miRNAs are enough?
At the beginning, the majority of microRNAs was identified by direct cloning of small RNAs10; this approach was very reductive because it permitted just the detection of abundant expressed miRNAs. Three observations suggested that miRNAs genes could be identified using computational approaches. First, miRNAs are produced from a precursor transcript of 70-100 nt with extended stem-loop structure. Second, miRNAs are usually highly conserved between the genomes of related species. Third, miRNAs display a characteristic pattern of evolutionary divergence. In according with these criteria, many computational procedures have been developed to predict miRNAs genes in the genome of different organisms, like MiRNAscan in humans, miRNAseeker in Drosophila or others in C. elegans (for review see
11,12). The sensitivity of these bioinformatic approaches was demonstrated by the presence of
a high percentage of previously experimentally identified miRNAs within the top predicted candidates and by confirmation using Northern blotting analysis and a more sensitive
RT-PCR method. The estimate of miRNA genes in the metazoan genome represents nearly 1% of the predicted genes, a fraction similar to that seen for other very large gene families with regulatory roles, such as those encoding transcription-factor proteins.
In 2003, the rapid growth of the miRNA genes number has led Sam Grifftihs-Jones from Wellcome Trust Sanger Institute to create a comprehensive and searchable database of published miRNAs sequences via a web interface, “The microRNA Registry” (http://www.sanger.ac.uk/software/Rfam/mirna/) 13. The primary aims of this registry are two-fold. The first is to avoid inadvertent overlap by assigning unique names to distinct miRNAs. The microRNAs are annotated with numerical identifiers based on sequence similarity: a standard name is like “miR-15” and the next miR without similarity will receive the name “miR-16”. For homologue miRNAs in different organisms, it is usual to assign the same name on the similarity of the 22 nt mature sequence. Identical mature forms are assigned the same name and if they are produced from different genomic loci they are differentiate by suffixes as, for example, “miR-15-1” and “miR-15-2”. Differences in one or two bases are identified by suffixes, such as “miR-181a” and “miR-181b”. If a microRNA hairpin precursor give rise to two mature miRNAs, one from each arms, the rule is to denote miRNAs in the form “miR-142-5p” (5` arm) and “miR-142-3p” (3` arm) until the expression data will confirm which form is predominantly expressed; in such cases, the specie less expressed will be identified by using an asterisk (such as “miR-191*”). The second aim of miRNA registry is to provide an all miRNAs sequences database including the stem-loop structure, with the highlighted microRNA in red, genomic location, homologous sequences and possible target predictions.
At the beginning of 2005, a phylogenetic shadowing study on microRNAs in primate species revealed a characteristic conservation profile of miRNAs genes that the authors have used to efficiently detect the 83% of the known miRNAs and predict an extensive set of novel miRNAs, opening the possibility that as many as 1000 microRNAs may exist in the human genome 14. The MicroRNA Registry contained in the version 12.0 (September 2008) 8619 entries from in primates, rodents, birds, fish, worms, flies, plants and viruses; actually, the human miRNAs are 695 and the number may still increase.
2b. Genomics of microRNAs.
Almost 50% of mammalian microRNAs are located in introns of protein coding genes or long ncRNAs transcripts, whereas the remaining part is considerable as indipendent transcription units with specific promoter core elements and polyadenilation signals (for review see 15-17). Among the intragenic miRNAs, 40% are found in introns of protein coding genes, whereas ~10% are located in introns of long ncRNA transcripts. The vast majority of miRNA clusters are single transcription units or overlapped in the same host transcripts, within exons or introns, and in some cases depending on alternative splicing of the host gene, implying that they are transcribed as polycistronic transcripts. Additionally, many miRNAs overlap with two or more transcription units transcribed on opposite DNA strands.
The analysis of miRNAs genomic loci evidences that host genes encoding proteins are involved in a broad spectrum of biological function ranging from embryonic development to the cell cycle and physiology. When the miRNAs host genes are classified for Gene Ontology (GO) “biological process”, the two most commonly identified biological process are “metabolism” and “cellular physiological process” whereas the classification for GO “molecular function” identifies “purine nucleotide binding” and “DNA binding” proteins. In addition to the miRNAs located in protein coding genes, a large group of microRNAs resides in transcripts that lack a significant protein-coding potential, classified as long ncRNAs. These types of ncRNA transcripts are sometimes referred to as mRNA-like ncRNAs (mlncRNA) because they are spliced, polyadenilated and also spatio-temporally expressed. Deleted in Leukemia 2 (DLEU2) and BIC are host-genes mlncRNAs respectively for miR-15/miR-16 cluster and miR-155 18, 19.
The maturation of miRNAs is a very complex process and in the following sections we will try to illustrate the machinery that the cell needs to activate the intricate multi-step processing from nucleus to cytoplasm, required for the production of microRNAs.
2c. MicroRNAs Transcription and Maturation.
Initially, the researchers believed that microRNAs were transcribed by RNA polymerase III like other small RNAs, as some as tRNAs. However, numerous evidences supported the possibility of a transcription mediated by RNA polymerase II. In 2004, three direct evidences have been reported to evaluate the strict correlation between microRNAs and pol II: (i) the miRNAs transcripts are capped and polyadenilated; (ii) the transcription of miRNAs
transcripts is sensitive to alpha-amanitine at the specific concentration for pol II inhibition; (iii) the promoter region, responsible for miRNA transcription, is associated to pol II complex 15.
Animal microRNAs are identified as part of 80 nt RNA with stem-loop structure (pre-miRNA) that are included in several hundreds/thousands nucleotide long miRNAs precursors, named primary miRNAs precursor (pri-miRNA) (Figure 1). Until now, few different pri-miRNA precursors have been isolated and characterized. They are all capped, polyadenilated and apparently non-coding: the human cluster miR-23a~27a~24-2 primary precursor is an unspliced ~2.2 kb RNA; in contrast, the pri-miRNA for human miR-155 (BIC) includes two introns and two alternative poly-A sites capable to produce two spliced pri-miRNAs of 0.6 and 1.4 kb 16.
The production of microRNAs from pri-miRNA to mature miR is a complex and coordinated process where different groups of enzymes and associated proteins, located in the nucleus or cytoplasm, operate the multistep maturation of these tiny RNAs. Principally, the maturation process of microRNAs can be resumed in three important steps: cropping, export and dicing (Figure 1).
In the cropping, the pri-miRNA is converted in pre-miRNA trough the cleavage activity of Drosha enzyme, a nuclear Ribonuclease III endonuclease capable to crop the flank regions of pri-miRNA in turn to liberate the 60-70 nt pre-miRNA 10. Different pri-miRNA requisitions are necessary to obtain an efficient precursor maturation by Drosha: first, a large terminal loop (> 10 nucleotides) in the hairpin and a stem region one turn bigger than the pre-miRNA; second, a 5` and 3` single stranded RNA extensions at the base of the future microRNAs 20, 21. It has been proposed that Drosha may recognize the primary precursor through the
stem-loop structure and then cleave the stem at a fixed distance from the stem-loop to liberate the pre-miRNA. How the enzyme is capable to discriminate the pri-miRNA stem-loop structure in respect to the others stem-loop cellular RNAs is not clear, but probably proteins associated with Drosha confer specificity to this process. In fact, Drosha has been found as a part of large protein complex of ~650kDa, which is known as the “Microprocessor”, where Drosha interacts with its cofactor, the Di George syndrome critical region gene 8 (DGCR8) protein in human and Pasha in Drosophila melanogaster 22. The Microprocessor appears to represent a heterotetramer consisting of two Drosha and two DGCR8 molecules; because DGCR8
FIGURE 1. MicroRNA (miRNA) genes are transcribed by RNA polymerase II (pol II) to generate
the primary transcripts (pri-miRNAs). The initiation step ('cropping') is mediated by the DroshaミDGCR8 complex (also known as the Microprocessor complex). Drosha and DGCR8 are both located mainly in the nucleus. The product of this nuclear processing step is a 70-nucleotide (nt) pre-miRNA, which possesses a short stem plus a 2-nucleotide 3' overhang. This structure might serve as a signature motif that is recognized by the nuclear export factor exportin-5. Pre-miRNA constitutes a transport complex together with exportin-5 and its cofactor Ran (the GTP-bound form). Following export, the cytoplasmic RNase III Dicer participates in the second processing step ('dicing') to produce miRNA duplexes. The duplex is separated and usually one strand is selected as the mature miRNA, whereas the other strand is degraded.
contains two consensus dsRNA binding domain, this protein may play an important role in the substrate discrimination and binding.
The resulting product of cropping, the pre-miRNA, presents a 5` phosphate and 3` hydroxy termini, and two or three nucleotides single-stranded overhanging ends, classic characteristics of Rnase III cleavage of dsRNAs. After the Microprocessor nuclear activity, the produced pre-miRNA is exported to the cytoplasm by Exportin-5/RnaGTP23. Exp-5 forms a nuclear heterotrimer with RanGTP and pre-miRNA, resulted from Drosha processing. This interaction, which is dependent on RNA structure but independent of sequence, stabilizes the nuclear pre-miRNA and promotes the export to the cytoplasm. In any export, once the Exp5-RanGTP-pre-miRNA complex has reached the cytoplasm through the nuclear pore, the RnaGTP is hydrolyzed to RanGDP and the pre-miRNA is released. Arrived into the cytoplasm, the pre-miRNA is processed in 18~22 nucleotides miR duplexes by the cytoplasmic Rnase III Dicer and, in humans, its partner TRBP. The PAZ domain of Dicer is thought to interact with the nucleotides 3` overhang present in the pre-miRNA hairpin while the dsRNA binding domain binds the stem and defines the distance of cleavage from the base of pre-miRNA. The cleavage 22nt-long miRNA duplexes have a reduced half-life. Normally, one strand of this duplex is degraded whereas the other strand accumulates as a mature miRNA. Studies on siRNAs have highlighted that the selection of the right strand is related to the thermodynamic stability of the duplex and the strand with relatively unstable base pairs at the 5` end usually represents the mature miR.
2d. MicroRNA in action: RISC and gene target inhibition
In the RNA duplex produced from the Dicer activity, the mature miRNA is only partially paired to the miRNA*, the small RNA that resides on the opposite pre-miRNA stem. From the miRNA-miRNA* duplex, only the miRNA enters preferentially in the protein effector complex, the RNA Induced Silencing Complex (RISC) or miRNAsC or miRgonaute, which mediates the degradation or translation inhibition of mRNAs target gene24. Several proteins have identified as essential components of RISC, but only a few have been functionally characterized in the post-translational regulation. The core component of every RISC is a member of the Argonaute (Ago) protein family, whose members present a central PAZ domain like Dicer and a carboxy terminal PIWI domain. This domain binds the miR/miR* duplex to the 5` end whereas the PAZ domain binds to the 3` end of singled-strand RNAs;
moreover, structural and biochemical studies have suggested that the Ago proteins are the target-cleaving endonuclease of RISC and in this activity the complex is helped and coordinated by other proteins whose function is not really understood like RNA-binding protein VIG, the Fragile-X related protein in Drosophila, the exonuclease Tudor-SN and many other putative helicases25. In the human cells, after the microRNAs transfection by miR-expressing vectors or miRNA precursors, and the following activation of RISC activity, the core component of RISC, together with the triggering miRNA target mRNA, is concentrated in cytoplasmic foci known as Processing bodies (P-bodies) or GW-bodies. According with this triggered RISC localization, the researchers thought that the microRNAs, in association with AGO proteins, might be capable to repress the translation at ribosomal level and to re-localize the mRNA targets to the P-bodies26.
The majority of the animal miRNAs are imperfectly paired to the 3` UTR of the target mRNA and inhibit the protein production by an unknown or very controversial mechanism (Figure 2); in some cases, the microRNAs show nearly precise complementarity to their target and trigger mRNA degradation as siRNA in the RNA interference process24.
The most important characterization of the function of microRNAs is the identification of mRNA target. Because the animal miRNAs have a 5`end restricted complementarity to the mRNA target (only 5-8 nucleotides perfectly complementary), RNA sequence named “seed region”, the miRNAs are predicted to regulate a large number of animal genes. Different algorithms have been developed to predict the animal miR targets; they are based on different criteria, resulted from the analysis of the in vivo demonstrated targets: (i) perfect or nearly perfect base-paring at the seed region and thermodynamically stability of the duplex miR-mRNA; (ii) phylogenetic conservation of the seed region; (iii) multiple target sites in a single target by the same or different miRNAs; (iiii) absence of strong secondary structures at the miR-binding site on the target. Several computational procedures are available to predict microRNA targets such as DianaMicroT (http://www.diana.pcbi.upenn.edu/cgi-bin/micro_t.cgi), TargetScan (http://genes.mit.edu/targetscan/), and miRanda (http://genes.mit.edu/targetscan/) 27-29.
FIGURE2. Mechanisms of miRNA-Mediated Gene Silencing. (A) Postinitiation mechanisms. MicroRNAs (miRNAs; red) repress translation of target mRNAs by blocking translation elongation or by promoting premature dissociation of ribosomes (ribosome drop-off). (B) Cotranslational protein degradation. This model proposes that translation is not inhibited, but rather the nascent polypeptide chain is degraded cotranslationally. The putative protease is unknown. (C–E) Initiation mechanisms. MicroRNAs interfere with a very early step of translation, prior to elongation. (C) Argonaute proteins compete with eIF4E for binding to the cap structure (cyan dot). (D) Argonaute proteins recruit eIF6, which prevents the large ribosomal subunit from joining the small subunit. (E) Argonaute proteins prevent the formation of the closed loop mRNA configuration by an ill-defined mechanism that includes deadenylation. (F) MicroRNA-mediated mRNA decay. MicroRNAs trigger deadenylation and subsequent decapping of the mRNA target. Proteins required for this process are shown including components of the major deadenylase complex (CAF1, CCR4, and the NOT complex), the decapping enzyme DCP2, and several decapping activators (dark blue circles). (Note that mRNA decay could be an independent mechanism of silencing, or a consequence of translational repression, irrespective of whether repression occurs at the initiation or postinitiation levels of translation.) RISC is shown as a minimal complex including an Argonaute protein (yellow) and GW182 (green). The mRNA is represented in a closed loop configuration achieved through interactions between the cytoplasmic poly(A) binding protein (PABPC1; bound to the 3′ poly(A) tail) and eIF4G (bound to the cytoplasmic cap-binding protein eIF.
3. microRNAs: function in normal and disease states.
With the discovery on a “daily - basis” of new members of the miRNA family, it becomes evident that these small genes are involved in normal cells homeostasis 10, 30. Furthermore,
with the development of new techniques of genome-wide screening of microRNAs expression, abnormal levels of microRNAs were identified in tumor cells in respect with normal counterparts 31- 33. The functions of microRNAs, initially a “shadow” area of research, revealed a general participation in every functional aspect of normal cells in organisms with different degrees of complexity. For example, in Drosophila, miR-14 suppresses cell death and is required for normal fat metabolism34 , while bantam encodes a developmentally regulated microRNA that controls cell proliferation and regulates the proapoptotic gene hid35. As Shown in Table 1, miRNAs participation in essential biological processes have consistently been proven, such as cell proliferation control (miR-125b and
let-7), hematopoietic B-cell lineage fate (miR-181), B-cell survival (miR-15a and miR-16-1),
brain patterning (miR-430), pancreatic cell insulin secretion (miR-375) and adipocyte development (miR-143) (for reviews see 36-38).
As a consequence of extensive participation in normal functions, it is quite logical to ask the question if microRNAs abnormalities should have importance in human diseases. As shown in Table 2, microRNAs and/or proteins involved in the processing of miRNAs are involved in various types of human diseases, the most studies example being human cancers.
MiRNAs can act both as tumor suppressors and oncogenes 31-33.
Homozygous deletions (as is the case for miR-15a/miR-16a cluster), the combination mutation + promoter hypermethylation or gene amplification (as is the case of miR-155 or the cluster miR-17-92) seems to be the main mechanisms of inactivation or activation, respectively 39-41. Because of the small size, the loss-of-function or gain-of-function point mutations represent rare events 42. MiRNAs activity can be influenced either by the reposition of other genes close to miRNAs promoters/regulatory regions (as is the case of
miR-142s – c-MYC translocation) or by the relocalization of a microRNA near other
regulatory elements. The overall effects in the case of miRNAs inactivation is the overexpression of target mRNAs, while the miRNAs activation will lead to downregulation of target mRNAs involved in apoptosis, cell cycle, invasion or angiogenesis.
To date, it was elegantly demonstrated that let-7 microRNA family regulates RAS oncogenes and that let-7 expression is lower in lung tumors than in normal lung tissue, while RAS protein has an inverse variation 43. Furthermore, enforced expression of the miR-17-92 cluster
from chromosome 13q32-33 in conjunction with c-myc accelerates tumor development in a mouse B-cell lymphoma model 40. Two microRNAs from the same cluster, miR-17-5p and
miR-20a negatively regulates the E2F1 transcription factor, a gene proved to function as a
tumor suppressor in some experimental systems 39.Recently, an unexpected mechanism of involvement of miRNAs in human disease was identified. Tourette syndrome is a neurologic disorder manifested particularly by motor and vocal tics and associated with behavioral abnormalities. Sequence variants of a candidate gene on chromosome 13q31.1 named SLITRK1 (Slit and Trk-like 1) were identified in patients with TS. One of them, named var321, found in two unrelated patients, was located in the 3’UTR binding site for the miR-189 and might affect SLITRK1 expression 44. This mechanism of abnormal miRNA::mRNA interaction seems to be a general one, as it was proved also in the case of oncogene c-KIT. Three of the highly overexpressed miRNAs in thyroid cancers, 221, 222 and
miR-146, are predicted to interact with KIT oncogene mRNA at two different sites. Tumors in
which the up-regulation of these miRNA was the strongest showed dramatic loss of KIT and in half of the cases the down-regulation was associated with germline single nucleotide polymorphysms (SNP) in the two recognition sites in KIT for these three miRNAs 45. One important proof for the functional importance of such abnormalities is represented by the reproduction of similar diseases in mouse models with abnormal microRNAs expression. Recently, the first example of transgenic microRNA mouse was published: as expected by the overexpression of miR-155 in human lymphomas 19 46, the miR-155 transgenic mice
overexpressing the gene only in B cells, exhibit a preleukemic pre-B cell proliferation in spleen and bone marrow, followed by frank B cell malignancy 47. These findings indicate that the role of miR155 is to induce polyclonal expansion, favoring the capture of secondary genetic changes for full transformation. This is the final proof that deciphering miRNA alterations is important and that miRNAs, as small as they are, represent big culprits in human diseases.
AIM OF THIS STUDY
Breast cancer is the second leading cause of death among women with cancer in western world and its molecular pathogenesis is still not completely understood. Breast cancers arise from the mammary gland epithelium and its complex cellular hierarchy is becoming evident during breast tumorigenesis. For example, several intensive studies to determine gene-expression profiles of breast tumors enabled classification of, at least, five reproducible subtypes including luminal A, luminal B, basal-like, Her2+, and normal basal-like48,49
, which partially correlate with the traditional histological classification of the tumor50
. Overall, such studies pointed out that Estrogen Receptor α (ERα) expression status is one of the strongest factors governing the gene expression profile in breast cancer51
and thus, determines the biopathological phenotype of the tumor.
ERα is a nuclear hormone receptor that mediates the mitogenic action of 17β-estradiol on the breast ductal epithelium. E2-bound ERα is involved not only in the epithelial cells development but also in progression of breast cancer52. About 75% of diagnosed breast
tumors are ERα positive and the expression of ERα is correlated with a better prognosis mainly because of the likelihood of response to hormonal treatment53. Different studies suggest that a fraction of ERα-negative tumors arise from ERα-positive precursors54. Several molecular events, such as estrogen withdrawal55, hypoxia56, overexpression of epidermal growth factor receptor (EGFR) or ErbB2, which brings hyperactivation of mitogen activated protein kinase (MAPK)57 and DNA methylation occurring at the promoter of ERα gene58,
have been reported to suppress ERα expression.
miRNAs play a pivotal role in tumorigenesis of breast cancer. Iorio et al. have previously determined miRNA expression profiles of breast cancer tissues59
. This study demonstrated that miRNAs were aberrantly expressed in breast cancer as compared to miRNAs expressed in normal tissue and, more interestingly, miRNA expression pattern could discriminate between breast tumors with different bio-pathologic phenothypes such as ERα status. A recent study further showed that miR-206, identified as an upregulated miRNA in ERα-negative tumors59, targets ERα mRNA60.
Here, we have determined microRNA expression profiles of a set of breast cancer cell lines with different ERα expression status and found a remarkable and consistent up-regulation of miR221&222, exclusively in ERα-negative cell lines. Demonstration of the suppressive
effect of miR221&222 on ERα protein and the identification of miR221&222 responsive target sites in the 3’UTR of ERα mRNA led us to conclude that ERα is a bonafide target of miR221&222. We showed that overexpression of miR221&222 in ERα-positive cells induces a global change in gene expression that differs from miR206 signature and may account for the generation of a more invasive and deadly tumor phenotype. Furthermore, we showed that ERα directly binds to the promoter of miR221/222 gene and recruits co-repressors NCoR and SMRT, thereby functioning as a transcriptional repressor for
miR221/222 gene. Taken together, our results uncovered the presence of a regulatory loop
composed of miR221&222 and ERα in human breast cancer cells, which may provide a new insight into understanding how breast cancer cells determine ERα-positive and-negative status.
METHODS
Cell Culture and Tumor Samples
Human breast cancer cell lines (T47D, MCF7, BT-474, BT483, 231, MDA-MB-436, MDA-MB-468) were purchased from ATCC and grown in DMEM containing 10% heat-inactivated FBS, 2mM L-glutamine and 100U/ml penicillin/streptomycin. All transfections were carried out with Lipofectamine 2000 (Invitrogen) according to the manifacturer’s instructions. For estradiol treatments, cells were grown to 70% confluency in phenol red-free Dulbecco's modified Eagle medium (DMEM) supplemented with 5% charcoal-dextran-stripped fetal bovine serum for at least 5 days. Meg01 cells were purchased from ATCC and grown in RPMI 1640 containing 10% heat-inactivated FBS, 2mM L-glutamine, 100U/ml penicillin/streptomycin. For proliferation assay, MCF7 were plated in 96-well plates and grown for 96hrs after transfection (miR final concentration 100nM) in normal culture condition. Cell growth was measured using Celltiter 96 AQueous
Non-Radicative Cell Proliferation Assay (Promega), according to manifacturer`s instructions. Cell Cycle was performed on propidium iodide stained, ethanol-fixed cells. All tumors samples were obtained with patient consent from the Department of Experimental Oncology, Fondazione IRCCS “Istituto Nazionale dei Tumori”, Milano. All samples were histologically confirmed.
To generate the ERα luciferase reporter constructs, two potential binding sites for miR221&222 within the 3` UTR of ERα mRNA were amplified by PCR and cloned downstream of the luciferase coding sequence in the pGL3-control vector (Promega). Mutations were introduced into the miRNA binding sites by using QuikChange mutagenesis kit (Stratagene). For mapping miR221/222 gene promoter, upstream genomic sequence of miR222 hairpin was amplified by PCR and cloned at the NheI and XhoI sites of pGL3-basic vector (Promega). To construct the pCRUZ-HA-ERα, ERα cDNA from ATG to TGA was synthesized from MCF7 mRNA by RT-PCR and was cloned in frame at the KpnI and EcoRV sites of pCRUZ-HA (Santa Cruz Inc). All constructs were sequenced to verify their integrities.
Microarray Analysis
For microRNAs microarray analysis61, total RNAs from 6 breast cancer cell lines were
hybridized to the Ohio State University custom miRNA microarray chip (OSU_CCC version 3.0), which contains 1150 miRNA probes, including 326 human and 249 mouse miRNA genes, spotted in duplicates. Differentially expressed miRNAs were identified using the Class Comparison Analysis of BRB tools version 3.6.0 (http://linus.nci.nih.gov/BRB-ArrayTools.html). The criteria for inclusion of a gene in miRs list is a p-value lower than a specified threshold value (0.05). A tree cluster was generated by the hierarchical cluster analysis; for this analysis, we used average linkage metrics and centered Pearson correlation (Cluster 3.0). Java Treeview 1.1 was used for tree visualization. The labeling of mRNA and the hybridization of the labeled cRNA onto the Affymetrix GeneChip HG-U133A 2.0 arrays were performed according to Affymetrix standard protocols (Santa Clara, CA). BRB Arraytools was used for Affymetrix HU133Plus2 genechips. Normalization was performed by GC-RMA and genes showing minimal variation across the set of arrays were excluded from the analysis. Genes whose expression differed by at least 1.5 fold from the median in at least 20% of the arrays were retained. Genes were considered statistically significant if their p-value was lower than 0.001 (False detection rate<0.01). All differentially expressed genes, either up- or down-regulated, along with their corresponding fold-change values, were input into Pathway-Express, a program that automatically determines the most related pathways based on pathway topology, gene expression level (fold-change), and relative positions of
genes within a pathway(s). Returned pathways were considered significant if the corrected gamma-p-value was less than 0.01. Pathways were then ranked according to impact factor.
Real Time PCR
For quantitative detection of mature miRNA, real-time PCR was performed using the TaqMan PCR Kit, followed by the detection with Applied Biosystems 7900HT Sequence Detection System (P/N: 4329002, Applied Biosystems). PCR was carried out in 10 µl reaction containing 0.67 µl RT product, 1 µl TaqMan Universal PCR Master Mix (P/N: 4324018, Applied Biosystems), 0.2 mM TaqMan probe, 1.5 mM forward primer and 0.7 mM reverse primer. The reaction mixture was incubated in a 96-well plate at 95 ˚C for 10 min, followed by 40 cycles of denaturation (95 ˚C for 15 s) and extension (60 ˚C for 1 min). All reactions were run in triplicate. The comparative CT method for relative quantization of gene expression (User Bulletin #2, Applied Biosystems) was used to determine miRNA expression level. Simultaneously determined U6 CT was used to normalize the data. For quantification of ERα, pS2 and GAPDH mRNAs, the appropriate TaqMan probes were purchased from Applied Biosystems.
Luciferase Assays
For identification of miR221&222 responsible elements, Meg01 cells were cotransfected in 24 well plates with 250ng of pGL3 reporter vector carrying the miR221 &222 binding site (see plasmid construct), 25ng of the phRL-SV40 control vector (Promega), and 100nM miR precursors or scramble control (Ambion) using Lipofectamine 2000. For mapping
miR221/222 gene promoter, Meg01 cells were cotransfected in 24 well plates with 250ng of
pGL3 reporter vector carrying upstream genomic sequence of miR222 hairpin (see plasmid construct) and 25ng of the phRL-SV40 control vector. Firefly and Renilla luciferase activities were measured consecutively by using Dual Luciferase Assay (Promega) 24h post-transfection. Reporter assay were carried out in triplicate.
Acrylamide and Agarose Northern Blot Detection.
For mature miRNA detection, acrilamide Northern blotting was performed as previously described [16]. Briefly, 10 µg aliquots of total RNAs from cell lines were resolved in a 15% denaturing polyacrylamide gel (Bio-Rad) and were electrophoretically transferred to
bright-Star blotting membrane (Ambion). The oligonucleotide encoding the complementary sequence of the mature miRNA annotated in miRNA Registry was end-labeled with [γ32
P]-ATP by T4 polynucleotide kinase (USB,Cleveland). RNA blotted membrane was prehybridized in Ultrahyb Oligo solution (Ambion) and subsequently hybridized in the same solution containing probe at a concentration of 106 cpm/ml at 37˚C, overnight. Membrane was washed at high stringency in the solution containing 2X SSC and 1% SDS at 37˚C. Northern hybridization signals was captured and converted to digital image by using Typhoon Scanner. For the detection of primary transcript of miR221&222, total RNA (10 µg per sample) was size-fractionated through 1.2% agarose-formaldehyde gels and transferred to Amersham nylon filters. Northern blot was hybridized with random-primed and α-32
P-labeled genomic DNA fragment spanning either miR221 or miR222 hairpin, as a probe (Roche).
ChIP Assay
ChIP assays were performed by using the ChIP assay kit from Upstate Biotechnology (Lake Placid, NY) with minor modifications. Briefly, cells were grown to 70% confluency in Dulbecco's modified Eagle medium (DMEM) supplemented with 10% fetal bovine serum. The cross-linking was performed with 1% formaldehyde at 37°C for 10 min. Cells were then rinsed with ice-cold PBS and resuspended in 0.4 ml of lysis buffer containing 1% SDS, 10 mM EDTA, 50 mM Tris-HCl, pH 8.1, 1xprotease inhibitor cocktail (Roche Molecular Biochemicals, Indianapolis, IN) and sonicated. A 30µl aliquot of the preparation was treated to reverse the cross-linking, deproteinized with proteinase K, extracted with phenol chloroform, and determined for DNA concentration. An aliquot of chromatin preparation containing 25 µg DNA was used per ChIP. DNase-free RNase (Roche) was added at a concentration of 200 µg/ml during reverse cross-linking. After deproteinization with proteinase K, DNA was purified in 50 µl of Tris-EDTA with a PCR purification kit (Qiagen, Valencia, CA) according to the manufacturer's instructions. A 2-µl aliquot was used for PCR. Primer sequences are listed in Supplementary Experimental Procedures. The primary antibodies used for immunoprecipitation were ERα (Bethyl laboratories A300-498A), SMRT (Santa Cruz Inc. sc-20778), NCoR (Santa Cruz Inc. sc-8994), rabbit IgG control (Zymed). In some experiments, ChiP-enriched DNA was also subjected to qPCR by using SYBR reagent
(Applied Biosystem). In this case, results were expressed as relative enrichment according to the following formula: 2^ -[(ctChIP-ctinput)-(ctIgG-ctinput)].
Results
Up-Modulation of miR221&222 in ERα-negative Cells and Primary Tumors.
First, we determined miRNA expression profiles of a small set of human breast cancer cell lines with different ERα expression status. MicroRNA microarray analysis of ERα-positive cell lines (T47D, BT474 and BT483) and ERα-negative cell lines (MB-468, MB-436 and MB-231) was performed by using our custom miRNA microarray platform61. Hierarchical clustering analysis based on the miRNA expression data distinguished sharply ERα-negative from ERα-positive cell lines (Figure 3a). MiRNAs displaying more than 4-fold change of difference are listed in Table 3. As shown previously59, we also identified miR191 and
miR26a as up-regulated miRNAs in ERα-positive breast cancer cells (Figure 3a and Table
3). We also noted that the expression level of miR206, up-regulated in ERα-negative breast
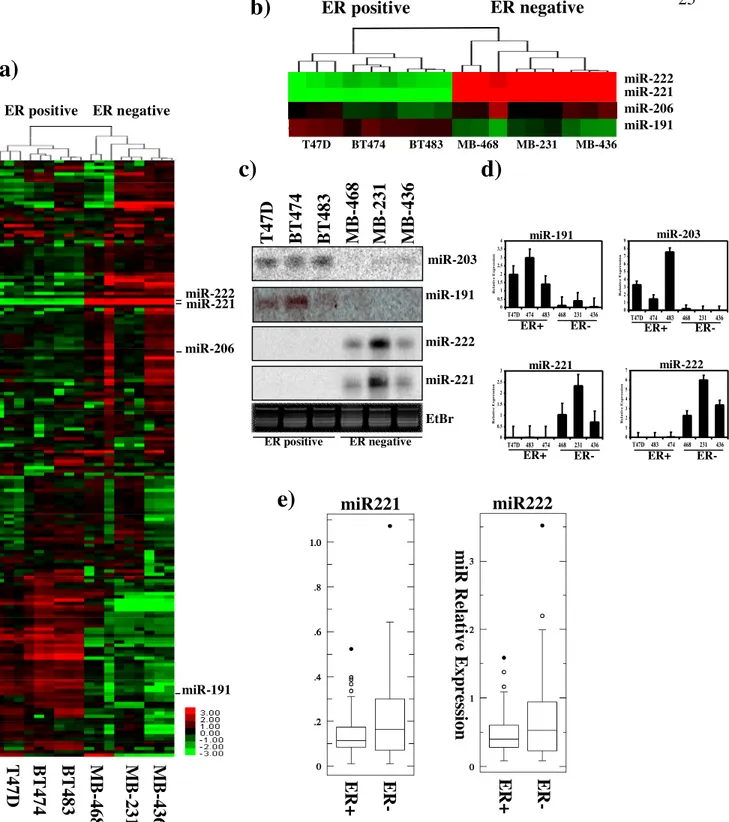
cancer59 and later shown to target ERα transcript60, was up-regulated in ERα-negative cells (Figure 3b) with statistical significance, although it was excluded from the list due to the current cut-off setting. Among up-regulated miRNAs in the ERα-negative cells, miR221&222 were identified as the miRNAs displaying the highest differential expression against the ERα-positive counterpart (Figure 3a,b and Table 3). Validation of the microarray results was performed by northern blot analysis and, further, by qRT-PCR for the most differentially and biologically relevant microRNAs, miR191, miR203, miR221 and miR222 (Figure 3c,d). Both analyses confirmed that miR221&222 were detectable only in the ERα-negative cells. Then, we wished to determine whether the observation was also extended to breast cancer tissues. To this end, qRT-PCR of miR221&222 was performed on 66 breast cancer tissues, including 44 ERα-positive and 22 ERα-negative tumors (Table 4). Results showed that the expression level of miR221&222 differentiates the two cohorts at statistical significance, according to the ERα status (Figure 3e). No other statistically significant correlations with the other patient`s or tumor`s characteristics were found. These results indicated that the up-regulation of miR221&222 in ERα-negative cells is a common feature both in established breast cancer cell lines and primary breast cancer tissues.
ER+
a)
BT483 T47D BT474 MB-468 MB-436 miR-221 miR-222 miR-191 miR-206 MB-231e)
0 0.5 1 1.5 2 2.5 3 3.5 4 T47D 474 483 468 231 436 Relative Expression miR-191 ER-ER+ ER+ ER-
0 1 2 3 4 5 6 7 8 9 T47D 474 483 468 231 436 Relative Expression miR-203 ER- ER+ 0 0.5 1 1.5 2 2.5 3 T47D 483 474 468 231 436 Relative Expression miR-221 ER- ER+ 0 1 2 3 4 5 6 7 T47D 483 474 468 231 436 Relative Expression miR-222
d)
miR222 E R + E R - miR221 m iR R el at ive E xp re ss ion T 47D BT 474 B T 483 M B -231 M B -436 M B -468 ER positive ER negative miR-222 miR-221 miR-191 miR-206Figure 3. miR221&222 Expression Distinguishes ERα-positive from ERα-negative Breast Cancer Cells and Primary Tumors. a,b, tree generated by the hierarchical cluster analysis (a) of
ERα-positive (T47D, BT-474, BT-483) and ERα-negative (MDA-MB-231, MDA-MD-436, MDA-MB-468) breast cancer cells on the basis of miRNA expression data (a). The tree displays their average absolute expression values after log2 transformation. Zoomed results of the clustering analysis of miR221,miR222, miR206 and miR191 expression are shown in (b). c,d, Detection of miR203, miR191, miR221 and miR222 in the breast cancer cells by Northern blot (c) or quantitative RT-PCR (qRT-PCR) (d). e, Detection of miR221 and miR222 by qRT-PCR in 66 breast cancer tissues (42 ER+ and 24 ER-); two data sets obtained from the two different tumor subtypes were compared by student t-test.
c)
miR-203 miR-221 miR-222 EtBr miR-191 ER negative ER positive M B -231 M B -436 M B -468 T 4 7D B T 474 B T 483 E R + E R -ERα Is Target of miR221&222.
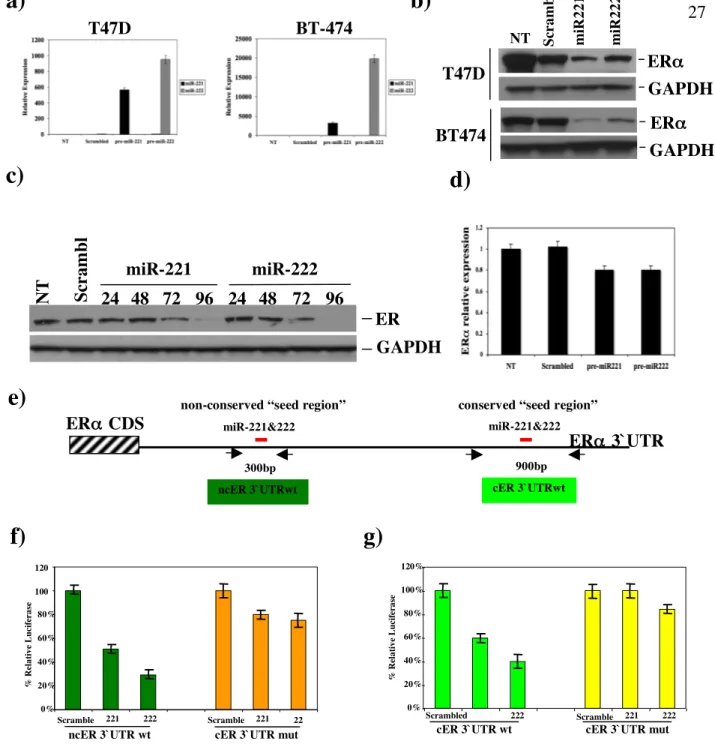
The consistent and highly differentiated expression of miR221&222 in ERα-negative cells raised the possibility of a role for miR221&222 in the loss of ERα in ERα-negative cells. To this end, two ERα-positive cell lines, T47D and BT474, lacking miR221&222 expression, were transfected with either pre-miR221, pre-miR222 or scrambled control. qRT-PCR analyses showed highly efficient production of mature miR221 or miR222 in both transfected cell lines (Figure 4a). Subsequent western blot analysis demonstrated that enforced expression of miR221 or miR222 caused remarkable reduction of ERα protein (Figure 4b). Furthermore, an additional ERα-positive cell line, MCF7, was treated by using the same procedures as described above. Cells were collected at different time points (24, 48, 72, and 96hrs) and the levels of ERα protein, assayed by western blot (Figure 4c), were undetectable 96hrs after transfection. qRT-PCR was also carried out on the same samples in order to evaluate the effect of miR221&222 overexpression on ERα mRNA (Figure 4d and data not shown). Since ERα mRNA levels were slightly reduced only after 96hrs of transfection (about 20% of reduction), the effect of miR221&222 on ERα protein reduction was due primary to a translational block and not to an ERα mRNA degradation.
MiR221 and miR222 share an identical seed sequence of 8 nucleotides and are predicted by bioinformatic algorithms (PicTar and TargetScan4.2) to bind to the ERα-3'UTR at two different sites, referred to as cER3’UTR and ncER3’UTR, respectively (Figure 4e). cER3’UTR is highly conserved across several species while ncER3’UTR is poorly conserved (Figure S1). Subsequent luciferase reporter assays showed that the insertion of both sites resulted in miR221- and miR222- dependent inhibition of luciferase activity (Figure S1,
Figure 4f, g light and dark green columns). Importantly, mutation of the seed sequences
against miR221 and miR222 markedly reduced their inhibitory effect (Figure S1, Figure 4f,
g light and dark yellow columns). We concluded that miR221&222 target ERα through the
two elements localized within the 3’ UTR of ERα mRNA and that up-regulation of miR221&222 in ERα-negative cells may play a role in loss of ERα expression.
Differential Effect of miR221&222 and miR206 on Gene Expression in Breast Cancer
As previously described, ERα is also targeted by miR20660. To determine the differential effect of miR221&222 and miR206 on ERα production and their impact on breast tumorigenesis, MCF7 were transfected with miR221, miR222, miR206 and scrambled
27
T47D BT-474
e)
miR-221&222 miR-221&222
300bp 900bp
conserved “seed region” non-conserved “seed region”
ERα CDS cER 3`UTRwt ncER 3`UTRwt ERα 3`UTR ER α miR-221 miR-222 N T S cr am b l ed 24 h 48 h 72 h 96 h 24 h 48 h 72 h 96 h GAPDH
c)
d)
f)
g)
0% 20% 40% 60% 80% 100% 120% Scrambled 221 222 Scramble d 221 222 % R el a ti v e L u ci fe ra se A ct iv it ycER 3`UTR mut cER 3`UTR wt 0% 20% 40% 60% 80% 100 % 120 % Scramble d 221 222 Scramble d 221 22 2 % R el a ti v e L u ci fe ra se A ct iv it y
cER 3`UTR mut ncER 3`UTR wt
Figure 4. ERα Is a bonafide Target of miR221&222. a,b, two ERα-positive breast cancer cells, T47D (upper panel) and BT-474 (lower panel), were transfected with 100nM each of scrambled control, miR-221 or pre-miR-222. 72hr post-transfection, total RNAs were isolated and subjected to qRT-PCR analyses to determine the levels of mature miR221 and miR222 (a). Total proteins from the transfected cells were used to detect ERα by western blot. The levels of GAPDH were shown as a loading control (b). c,d, MCF7 were treated by the same procedure as described in a. Total proteins were collected at different time points and levels of ERα were measured by western blot analysis (c). Total RNAs were prepared from the transfected cells at 96h post-transfection. Levels of ERα mRNA were mesuasured by qRT-PCR and normalized for the amount of gapdh mRNA (d). e, schematic diagram depicts two potential binding sites for miR221&222, predicted by TargetScan database, in the ERα 3`UTR; two pairs of the arrows indicate the fragments spanning the potential binding sites that were cloned into the pGL3 reporter vector. Non-conserved (dark green) and conserve (light green) seed regions were mapped at 549-555nt and 2253-2260nt from the translation stop codon, respectively. Luciferase activities were determined after transfection of Meg01 cells. See the text for the detail.
NT ERα GAPDH T47D ERα GAPDH BT474 S cr a m m iR 2 m iR 2
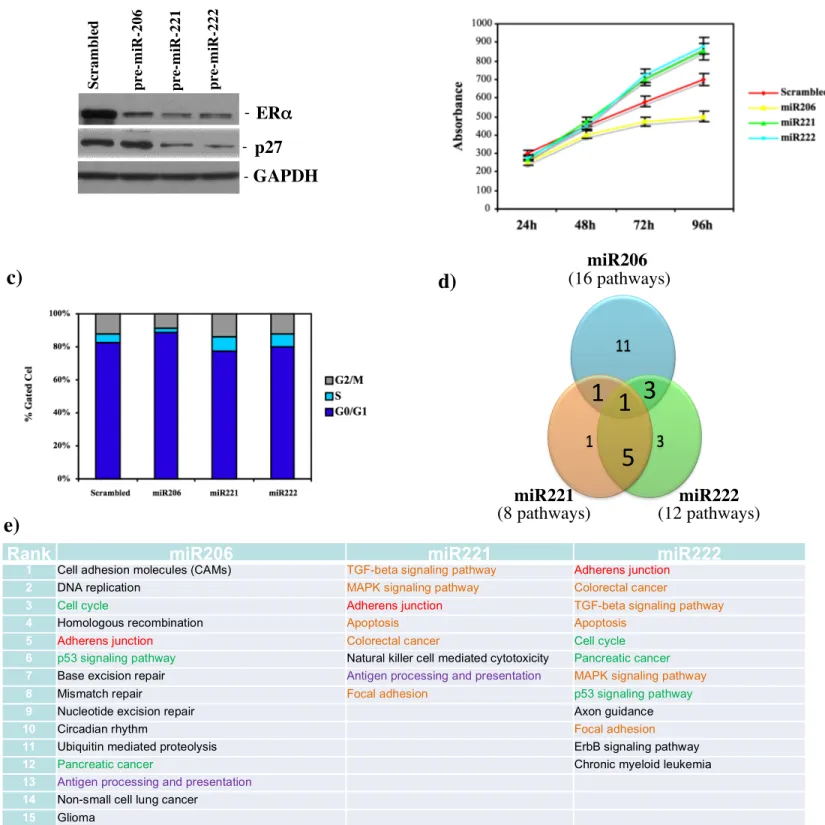
control. This study clearly showed that all these miRNAs suppress ERα protein at the same levels (Figure 5a). Recently, several studies have shown that miR221&222 target as well the tumor suppressor protein p27Kip1 62-65. These studies pointed out that a high level of miR221&222 are required to maintain low levels of p27Kip1 protein, allowing for cancer cell proliferation and tumor growth. We found that p27 Kip1 protein was repressed only in cells expressing miR221&222 but not miR206 (Figure 5a). Moreover, it was recently shown that miR206 inhibits cell growth of ER+ cells66. To assess the differential role of miR221&222
and miR206 in ER+ cells proliferation, MCF-7 were transfected either with miR206, miR221, miR222 and scrambled control and incubated in normal growth condition for up to 96hrs. MTT-based proliferation assay revealed that miR221 and miR222 increase cells proliferation although, as previously reported, miR206 has an inhibitory effect (Figure 5b). According to the miR221&222 and miR206 differential effect on p27 protein levels, FACS analyses showed that only miR221 and miR222 induce a significant increase in the transition from G1 to S phase when compared to the scrambled control (Figure 5c); indeed, a significant block in G1 phase was found for miR206 transfected cells and may be responsible for the decreased proliferation (Figure 5c). Finally, miR-transfected-MCF7 were subjected to gene expression profiles. First, SVD analyses showed that miR-transfected cells werdifferent from scrambled-transfected cells (data not shown); notably, miR221- and miR222-overexpressing MCF7 were clustering together and were separated from miR-206. Statistical analyses identified 1966, 1091, 1079 upregulated and 2390, 1014, 936 downregulated genes in miR-206, miR221, and miR222 overexpressing cells, respectively. According to these gene lists, SVD analyses were further confirmed by two-tailed Fisher's exact test; we showed that almost 75% of the genes regulated by miR221 and miR222 were overlapping while only the 30% was in common with miR206.
Finally, by using Pathway Express on all gene data set, we evaluated also that miR221&222 modulated-processes are overlapping and different from those of miR206 (Figure 5e). These co-regulated-processes are represented by apoptosis, MAPK and TGF-beta signaling pathway, focal adhesion and colorectal cancer (Figure 5e). By using only the genes up-regulated or down-modulated by miR221&222 compared to miR206, we found that main activated processes are cell cycle and apoptosis, respectively (data not shown).
Figure 5. miR221&222 induce a change in gene expression. a, MCF7 were transfected with scrambled control, miR206, miR-221 and miR-222 (100nM). ERα and p27 levels were analyzed by western blot analysis. b, Cell growth was measured by an MTT-based cell proliferation assay. c, miR-transfected MCF7 were also subjected to FACS analysis and the relative G1,S and G2/M compartments calculated. Data are representative of three independent experiments. d, Venn diagram of biological processes modulated by overexpression of miR-206, miR221 and miR222 in MCF7 cells. e, List of biological processes modulated by the overexpression of miR-206, miR221 and miR222. In red are reported all processes commonly shared by all three miRs, in green by miR206 and miR222, in orange by miR221 and miR222.
1 3
1
5
miR206 (16 pathways) miR222 (12 pathways) miR221 (8 pathways) S cr a m b le d p re -m iR -2 2 p re -m iR -2 2 p re -m iR -2 0 ERα GAPDH p27c)
Rank miR206 miR221 miR222
1 Cell adhesion molecules (CAMs) TGF-beta signaling pathway Adherens junction
2 DNA replication MAPK signaling pathway Colorectal cancer
3 Cell cycle Adherens junction TGF-beta signaling pathway
4 Homologous recombination Apoptosis Apoptosis
5 Adherens junction Colorectal cancer Cell cycle
6 p53 signaling pathway Natural killer cell mediated cytotoxicity Pancreatic cancer
7 Base excision repair Antigen processing and presentation MAPK signaling pathway
8 Mismatch repair Focal adhesion p53 signaling pathway
9 Nucleotide excision repair Axon guidance
10 Circadian rhythm Focal adhesion
11 Ubiquitin mediated proteolysis ErbB signaling pathway
12 Pancreatic cancer Chronic myeloid leukemia
13 Antigen processing and presentation
14 Non-small cell lung cancer 15 Glioma
16 Prostate cancer
d)
ERα Negatively Regulates miR221&222 Expression
Loss of miR221&222 expression in ERα-positive cells also raised the possibility that ERα negatively regulates transcription of these miRNAs. To test this hypothesis, first we overexpressed ERα in hormone-starved ERα-negative MDA-MB-436 cells (Figure 6a). After E2 stimulation, a strong reduction of miR221&222 expression was detected, indicating that ERα inhibits miR221&222 expression (Figure 6b). To corroborate this finding, another ERα-negative cell line, MDA-MB-231, previously reported to carry the promoter hypermethylation of ERα gene67, was treated for 10 days with 5-aza-2’-deoxycytidine (5’AZA). This treatment resulted in induction of ERα expression (Figure 6c) that was accompanied by reduced expression of miR221&222 (Figure 6d). Next, we investigated whether endogenous ERα is involved in miR221&222 down-regulation observed in ERα-positive cells. siRNA knockdown of ERα was carried out in MCF7 cells (Figure 6e). Highly efficient suppression of ERα was accompanied by p27 downregulation and induction of miR221&222 expression (Figure 6f). To further confirm the inhibitory effect of ERα on miR221&222 expression, T47D cells were treated with the anti-estrogen Fulvestrant, which promotes ERα protein degradation through cellular proteosome activation68. Fulvestrant-treated T47D showed a strong reduction of ERα protein (Figure 6g) and a time-dependent induction of miR221&222 expression (Figure 6h). In summary, the enforced expression of ERα in ERα-negative cells and the elimination of ERα from ERα-positive cells caused inhibition and induction of miR221&222 expression, respectively, demonstrating a novel function of ERα as a negative regulator for the expression of these miRNAs.
Genomic Structure and Transcriptional Regulation of miR221&222
miR221 and miR222 genes, located on human chromosome X, are tandemly aligned with 720 nt spacer sequence (Figure 7a). Since the genomic region lacks any protein-coding gene, both miRNAs appear to represent a single transcriptional unit. MDA-MB-231 cells, which express high levels of miR221&222, were transfected with siRNA against Drosha to produce global accumulation of pri-miRNAs69. Western blot analysis demonstrated highly efficient Drosha knockdown by siRNA (Figure 7b). Northern blot analysis of Drosha-knockdown cells, probed with genomic DNA fragment spanning pre-miR221, enabled detection of ~2.1
NT em p 24h 48h ER-HA ERα GAPDH
c)
g)
24h 48h ERαNT
si-ERα
72h 96h si G F P GAPDH p27 miR-221 miR-222 NT AZA 7d 10d EtBrd)
e)
f)
h)
Fulvestrant (10nM) NT ERα GAPDH 24h 48h 72hFigure 6. ERα Negatively Regulates miR221&222 Expression. a,b, ERα-negative MDA-MB-436 cells were cultured for 5 days in hormone-deprived media and were transfected with pCruz-HA-ERα construct. 24hrs after transfection, cells were stimulated by adding E2 at a concentration of 10nM and were kept in culture for additional 48hrs. Transfected cells were subjected to western blotting analysis (a) for the detection of HA-ERα and to qRT-PCR analysis (b) for the quantitative detection of mature miR221&222. c,d, MDA-MB-231 cells were treated with 5-aza-2`-deoxycytidine (5`AZA) at concentration of 10µM for 10 days. 5’AZA-treated cells were subjected to qRT-PCR analysis for the detection of ERα transcript (c). miR221&222 were detected by Northern blot (d). e,f, ERα-positive MCF7 cells were transfected with siRNA against ERα or with a control siRNA targeting GFP. 24, 48, 72 and 96 hrs after transfection, transfected cells were subjected to the same analytical procedures as used in a and b. Levels of p27 protein were also measured by western blot. g,h, T47D cells were treated with pure ERα antagonist, fulvestrant, after three days of hormone deprivation and were kept in culture for additional 72hrs. Fulvestrant-treated cells were subjected to the same analytical procedures as used in a and b.
kb transcript that is hardly detectable in control cells (Figure 7c, left panel). Detection of the ~2.1 kb transcript, by reprobing the blot with DNA fragment spanning pre-miR222 (Figure
7c, right panel), indicated that miR221&222 are transcribed into a single species of
miRNA. To specifically define the 5’ and 3’ termini of the transcriptional unit of pri-miR221&222, we carried out 5’ and 3’ RACE analyses and found 5’ extension of ~230nt from the 3’ end of pre-miR222 and 3’ extension of ~1000nt from the 5’ end of pre-miR221, respectively (data not shown). Based on these findings, we assumed that pri-miR221&222 of ~2.1kb starts around 120nt upstream from the 5’ terminus of miR222 hairpin structure (Figure 7a).
Analysis of miR221/222 gene by using “Promoter.2” and polyA signals database predicted two canonical TATA boxes located ~550nt and ~190nt upstream from the 5` end of pre-miR222 and reiterated polyadenylation sites close to the 3’ end of the primary transcript (blue arrow heads and green arrows, respectively in Figure 7a). To determine whether the upstream genomic region from the transcription start site functions as a regulator element for miR221&222 transcription, we constructed reporter plasmids by inserting the fragments spanning -1600 ~ -3000 and +3 ~ -1600 (+1 position corresponds to the 5’ terminus of pre-miR222) into the promoter-less vector pGL3basic (Figure 7d). Subsequent luciferase assay showed that only -1600 pGL3b gave rise to ~9-fold induction of luciferase activity as compared to the empty vector (Figure 7d). Next, 5’ end deletion mutants of -1600 pGL3b enabled us to map the minimal promoter of miR221&222 gene at -150bp ~ -50bp, where the proximal TATA box is excluded (Figure 4d). In summary, both miR221&222 are transcribed into a single species of 2.1kb RNA and the transcription is regulated by the upstream sequence located at -150bp/-50bp from the 5’ end of miR222 hairpin structure.
Co-occupancy of ERα and Co-repressor Proteins, NCoR and SMRT, at miR221&222 Genomic Region.
ERα is a nuclear receptor whose activity is regulated by E2. This ligand-dependent activation confers two important functions: 1) localization of ERα at the target genes by binding specific DNA sequences (Estrogen Responsive Element, ERE) and then 2) recruitment of additional transcriptional regulator, termed cofactors, that have either activator or repressor function on target genes70. To determine the effect of E2-bound activated ERα on