UNIVERSITÀ DEGLI STUDI DI SALERNO
Dipartimento di Farmacia
Dottorato di Ricerca
in
Scienze del Farmaco
Ciclo XXIX — Anno accademico 2016/2017
Tesi di Dottorato in
Farmacologia e Farmacoterapia
Neurodegeneration in Chronic Kidney
Disease: role of neuroinflammation and
uremic toxins
Dottorando Tutore
Dott. Simona Adesso Chiar.mo Prof. Stefania Marzocco
Index
ABSTRACT 1 CHAPTER I: INTRODUCTION 3 1.1 Neurodegeneration 3 1.2 Neuroinflammation 41.3 Oxidative stress in brain 8
1.4 Cells mediators of neuroinflammation and oxidative stress 10
CHAPTER II:
INTRODUCTION 15
2.1 Chronic Kidney Disease (CKD) 15
2.1.1 Uremic complications 19
2.1.2 Cognitive impairment in CKD 24
2.2 Uremic toxins 26
2.2.1 Indoxyl Sulphate (IS) 28
AIM OF THE WORK 35
MATERIALS AND METHODS 37
3.1 Reagents 37
3.2 Cell cultures 37
3.2.1 In vitro studies 37
3.2.2 Ex-vivo studies 37
3.2.2.1 Primary asrocytes and glial cells 37
3.2.2.2 Primary neurons 38
3.2.3 Cell treatment 38
3.3 Nitrite determination 39
3.4 iNOS, COX-2, HO-1, NQO1, SOD, caspase-1 and
nitrotyrosine detection 40
3.5 TNF-α, IL-6 and IL-1β determination 41
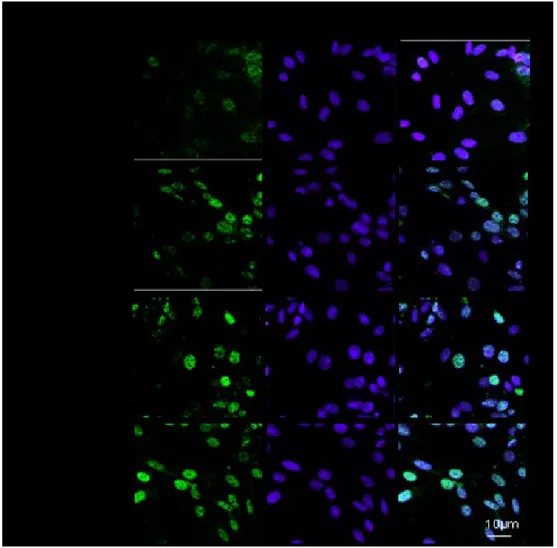
3.6 Immunofluorescence analysis with confocal microscopy 42
3.7 Measurment of ROS 42
3.8 Wound-Healing Assay 43
3.9 Antiproliferative activity 44
3.10 Analysis of Apoptosis and Cell Cycle Distribution 44 3.11 Cytotoxicity assay on primary and hippocampal neuronal
cultures 45
3.12 In vivo studies 45
3.14 Serum nitrite/nitrate, TNF-α and IL-6 evaluation 46
3.15 Hystology and immunohistochemistry 47
3.16 ROS production in serum patients 48
3.17 Data analysis 48
CHAPTER IV:
RESULTS 49
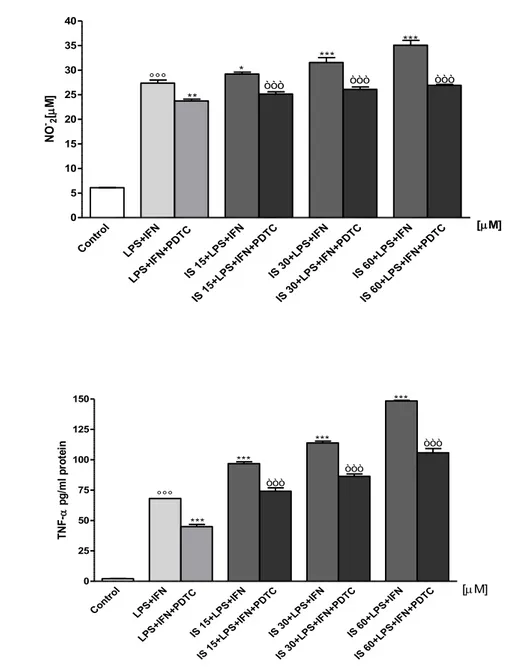
4.1 IS enhanced NO release, iNOS and COX-2 expession and
TNF-α production in C6 cells 49
4.2 IS facilitated NF-kB p65 nuclear translocation induced by
LPS+IFN in C6 cells 52
4.3 IS interfered with inflammatory response through AhR in
C6 cells 55
4.4 IS induced inflammasome activation in C6 cells 60
4.5 IS enhanced ROS release in C6 cells 62
4.6 IS reduced Nrf2 nuclear translocation and HO-1, NOQ1
and SOD expression in C6 cells 64
4.7 IS enhanced nitrotyrosine formation in C6 cells 68
4.8 Effect of IS on cell migration: effect of DPI 69
4.9 IS affected cells viability, induced apoptosis and cll cycle
arrest in C6 cells 72
and TNF-α and IL-6 production from primary astrocyes
and mixed glial cell cultures 75
4.11 IS activated AhR and facilitated p65 nuclear translocation
in primary astrocytes and mixed glial cell cultures 79
4.12 IS enhanced ROS release from primary astrocytes and mxed
glial cell cultures 82
4.13 IS enhanced nitrotyrosine formation in primary astrocytes and
mixed glial cell cultures 83
4.14 IS reduced Nrf2 nuclear translocation and HO-1
expression in primary astrocytes and mixed glial cell cultures 84 4.15 IS affected cell cultures viability induced apoptosis and cell
cycle arrest in primary astrocytes and mixed glial cell cultures 87
4.16 IS increased cellular death in neuronal cultures 90
4.17 IS induced bain and kidney damage 92
4.18 IS enhenced NO, TNF-α and IL-6 levels in mice serum and
resulted in COX-2 and nitrotyrosine expression in brain and kidney 92 4.19 IS increased ROS production in serum patients: effect of
AST-120 94
CHAPTER V
REFERENCES 101
1
ABSTRACT
Neuroinflammation and oxidative stress have been recognized as common aspects in neurodegenerative diseases. Although the inflammatory process may induce beneficial effects, such as the elimination of the pathogen, uncontrolled inflammation can lead to adverse outcomes through the production of neurotoxic factors that exacerbate neurodegenerative disease. Living cells continually generate reactive oxygen species (ROS) during energetic metabolism. ROS play an important physiological role, however, imbalanced defence mechanism of antioxidants, overproduction or incorporation of free radicals from environment to living system could be extremely deleterious, especially for the central nervous system (CNS). CNS is particularly vulnerable to oxidative stress and ROS production has been associated with different neurodegenerative diseases. Microglia and astrocytes, as the immune cells in the brain, are primary involved in different forms of neurodegeneration. These cells in response to a variety of stimuli and pathological events become activated and promote the release of inflammatory mediators and ROS. Neurodegenerative complications often occur in chronic kidney disease (CKD), a condition characterized by a progressive loss of renal metabolic activities and glomerular filtration, resulting in retention of solutes, normally excreted by healthy kidneys. These compounds, called uremic toxins, accumulate in patients with CKD and may have deleterious effects in various physiological functions in these patients, such as neurological complications associated to uremic syndrome. Indoxyl sulphate (IS) is a protein-bound uremic toxin, poorly eliminated by dialytic process, recognized as an uremic nephrovascular-toxin. IS has been reported to have effects on different type of cells such as renal tubular cells, vascular smooth muscle cells, vascular endothelial cells and osteoblasts, but no data regards CNS cells. Because of the mechanism/s involved in uremic-toxins induced neurological complications are not understood, in this project it has been examined the effects of IS on
2
neuroinflammation and oxidative stress in CNS cells. IS (15-60µM) treatment in C6 astrocyte cells increased inducible nitric oxide synthase (iNOS) and cyclooxygenase-2 (COX-2) expression, tumor necrosis factor (TNF-α). Moreover IS increased Aryl hydrocarbon Receptor (AhR), Nuclear Factor-kB (NF-kB) and inflammasome activation in these cells. In the same experimental condition, IS enhanced ROS release and decreased nuclear factor (erythroid-derived 2)-like 2 (Nrf2) activation, and heme oxigenase-1 (HO-1) and NAD(P)H dehydrogenase quinone 1 (NQO1) expression. Similiar observations are made in primary mouse astrocytes and mixed glial cells. It has been also observed that IS can also affected cell viability and cycle distribution, increasing the G0/G1 and S phases and decreasing G2 phase in C6 cells and in astrocytes and in mixed glial cells. Moreover neurons incubation with IS (15-60µM) induced cell death in a dose dependent fashion. In vivo data indicate that IS (800 mg/kg, i.p) induced histological changes and an increase in COX-2 expression and in nitrotyrosine formation in mice brain. Furthermore preliminary experiments on the effect of the human serum on ROS release in C6 cells, indicate that IS significantly contributes to oxidative stress in astrocytes. This study will be a step towards elucidating if this toxin could be not only a biomarker of disease progression in CKD patients, but also a potential pharmacological therapeutic target.
3
CHAPTER I INTRODUCTION 1.1 Neurodegeneration
Neurodegenerative diseases are a heterogeneous group of disorders chronic and progressive, characterized by gradually loss of anatomically or physiologically related neuronal systems. While the causes associated with neuronal degeneration remain poorly understood, the incidence of neurodegeneration increases with age, in mid‑to‑late adult life [1]. This phenomenon, which mainly affects elder individuals [2, 3], occurs in neurodegenerative diseases such as Alzheimer's disease (AD), multiple sclerosis (MS), Parkinson's disease (PD), amyotrophic lateral sclerosis (ALS) following viral infections. The pathological features involve the permeability of the blood brain barrier (BBB), the destruction of myelin sheath, damage of the axon, the formation of glial scar and the presence of inflammatory cells, mostly lymphocytes infiltrated into the central nervous sistem (CNS) [4]. The loss of myelin is manifested in clinical symptoms together with neuropathic pain, paralysis, muscle spasms and optic neuritis [5].
The latest report shows that neurodegenerative disorders generate 1% of mortality; out of the 11.2% of disability reported worldwide. Life expectancy increase in industrialized and developing countries leads to neurological disorders and are becoming a major public health problem that could reach pandemic proportions in the coming years. It is anticipated that by 2020 the levels of disability due to neurological diseases will be above 14.7% [6]. The most consistent risk factor for developing a neurodegenerative disorder, especially AD or PD, is increasing age. Over the past century, the growth rate of the population aged 65 and beyond in industrialized countries has far exceeded that of the population as a whole. Thus, it can be anticipated that, over
4
the next generations, the proportion of elderly citizens will double, and, with this, possibly the proportion of persons suffering from some kind of neurodegenerative disorder.
AD is the most common cause of dementia in people over 65 years of age, and is characterized by aggregated protein that forms amyloid plaques and neurofibrillary tangles, causing brain atrophy and cognitive impairment progression leading to dementia [3]. PD is a long-term degenerative disorder of the central nervous system that mainly affects the motor system. Early in the disease, the symptoms are shaking, rigidity, slowness of movement, and difficulty with walking. Thinking and behavioral problems may also occur. Dementia becomes common in the advanced stages of the disease.
Moreover, the neurodegenerative diseases, including AD and PD, are characterized by “redox state” imbalance and chronic inflammation, a major cause of cell damage and death [7].
1.2 Neuroinflammation
Inflammatory-like responce in the CNS is usually referred as neuroinflammation. Neuroinflammation is related to neuronal injury and death caused by an inflammatory process, which usually differ from peripheral inflammation, due to lack of the classic signals of pheripheral inflammation (rubor, tumor, calor and dolor)[8]. Once an immune-privileged site because of the presence of the BBB, it is now clear that while peripheral immune access to the CNS is resticted and cotrolled, the CNS is capble of dynamic immune and inflammatory responses to a variety of insults [9]. Infections, trauma, stroke, toxins and other stimuli are capble of producing an immediate and short lived activation of th innate immune system within the CNS (Figure 1.1).
5
Figure 1.1:Innate immunity in the periphery and CNS. Resident microglia and astrocytes exert multiple functions in the CNS, including protective and restorative responses to CNS infection or injury. Cytokines and chemokines expressed by resident CNS cells also promote the recruitment of circulating
lymphocytes and myeloid cells from the periphery to assist in pathogen clearance. Innate responses in the CNS cannot directly initiate adaptive
immunity. Innate CNS reactions also occur during neuroinflammatory disorders and utilize many of the same components as do host defense
responses [10].
The discipline of pathology makes a fundamental distinction between acute and chronic inflammation. In general, an acute neuroinflammatoy response is beneficial to the CNS, since it contributes to repair the damaged tissue and to minimize further injury. This response includes activation of the resident immune cells (microglia) resulting in a phagocytic phenotype and the release of inflammatory mediators such as cytokines and chemokines [11]. While an acute insult may trigger oxidative and nitrosative stress, it is typically short-lived and unlikely to be detrimental to longterm neuronal survival. In contrast, chronic neuroinflammation is a long-standing and often self-perpatuating neuroinflammatory response that persist long after an initial injury or insult [12]. Chronic neuroinflammation includes not only long standing activation of
6
microglia and subsequent release of inflammatory mediators, but also results in increased oxidative and nitrosative stress [11]. The sustained release of inflammatory mediators works to perpetuate the inflammatoy cycle, activating additonal microglia, promoting their proliferation, and resulting in further release of inflammatory factors. Owing to the chronic and sustained nature of the inflammation, there is often compromised of the BBB which increases infiltration of periphral macrophages into the brain parenchyma to further perptuate the inflammation [9]. The neuroinflammatory process involves not only infiltrating immune cells and microglia, but also astrocytes and neurons. In response of injury or disease, all these cells can produce inflammaory mediators including: cytokines (tumor necrosis factor-α, TNF-α; interleukin 1β, IL-1β and interleukin-6, IL-6), prostaglandins, reactive oxygen species (ROS) and nitrogen species and complement proteins. These proinflammatory and neurotoxic factors induce the expression of othr cytokines, chemokines and adesion molecules causing further glial activation [13].
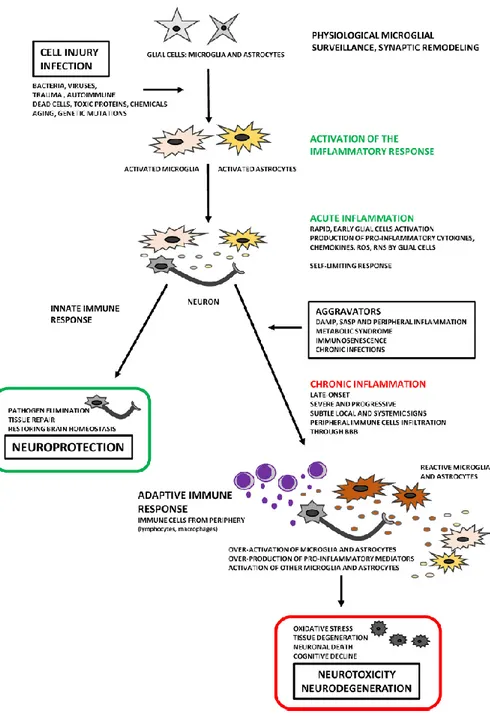
It is chronic inflammation that is typically associated with neurodegenerative diseases (Figure 1.2).
7
Figure 1.2:Two faces of neuroinflammation. Chronic inflammation is an important feature in the progressive of neurodegeneration.
Neuroinflammation is an active process and may therefore be beneficial or detrimental, depending on their duration and strengths of activation [14].
8
1.3 Oxidative stress in brain
Oxygen is vital for all living cells whether neuronal or other kinds of cells taking part in tissue formation but on the other hand it is potentially dangerous in excess. ROS are widely recognized as key mediators of cell survival, proliferation, differentiation, and apoptosis. Hydrogen peroxide is generated by a number of systems, including reactions catalyzed by monoamine oxidases A and B with a described location of neuronal and glial mitochondrial membranes. Oxidative stress has been implicated in the pathogenesis of brain desorders, mainly neurodegenerative desorders and ischemia (Figure 1.3) [15]. The brain is particulary vulnerable to oxidative damage because it has an elevated oxygen consumption, high levels of polynsaturaded fatty acids, low levels of antioxidants and relatively high levels of redox transition metal ions [16]. A major reason for the high O2 uptake by the brain is the vast amounts of adenosine
triphosphate (ATP) needed for its normal activity (4 x10¹² ATP molecules every
minute). The large amount of ATP is necessary to maintain neuronal intracellular ion homeostasis in face of all the openings and closings of ion channels associated with propagation of action potentials and neurosecretion. Neuronal membranes are packed with phospholipids containing polyunsaturated fatty acid esters, which are very sensitive to attack of ROS, causing a chain reaction which generates lipid radicals and extensive membrane damage. Brain antioxidant defenses are modest. In particular, the brain contains less catalase, glutathione peroxidase and vitamin E. In brain, the oxygen-rich enviroment and the presence of iron ions facilitate the production of ROS, such as the superoxide anion (O2.-) and hydrogen peroxide that trigger a cascade of
oxidative events [16]. Stressful or pathogenic conditions may trigger oxidative stress by unbalancing oxidant production pathways and anti-oxidant defences, leading to increased ROS level. These reactive species may interact with proteins, lipids, carbohydrates and nucleic acids, leading to oxidative damage of these biomolecules and cellular dysfunction [17].Several studies have shown
9
that brain cells, like microglia and astrocytes, induce and release inflammatory mediators in response to oxidative stress [18, 19]. In addition, ROS act as a critical signaling molecule to trigger inflammatory responses in CNS through the activation of the redox sensitive transcription factors, including Nuclear Factor-kB (NF-𝜅B) and activator protein-1 (AP-1) [20].
Figure 1.3:Oxidative stress and inflammation can damage nerve cells neurons loss of brain nerve cells.Nerve cells in the brain are organized and
networked to perform various different tasks. Chronic oxidative and inflammatory stress can progressively damage those nerve cells as well as
10
1.4 Cells mediators of neuroinflammation and oxidative stress
Microglia and astrocytes are two major types of glial cells involved in the regulation of the immune response to pathological processes in the brain [22]. Functional activation of microglia and astrocytes and the resulting neuroinflammation are associated with infection, autoimmunity, and pathogenesis of neurodegenerative diseases. In response to lead exposure, microglia and astrocytes can increase the production and release of inflammatory cytokines, enhance ROS generation, impede antioxidant activity, and result in neuronal injury or neuronal loss in the brain or other parts of the CNS [23, 24].
Microglia are the resident tissue macrophages in the CNS and are the principal mediators of inflammation and oxidative stress (Figure 1.4). Microglia represent approximately 5-10% of total cell popolation of the adult brain [25]. They assist in the remodeling and maturation of the brain and support clearance of cell remnants after apoptosis. In the resting state microglia display a small cell soma and numerous branching process (a ramified morphology). In healthy brain tissue, these processes are dynamic structures that extend and retract sampling and monitoring their microenviroment. During the resting state several key surface receptors are expressed at low levels; these include the tyrosine phosphatase (CD)45, CD-14 and CD11b/CD18. In presence of an activating stimulus, microglial cell-surface receptor expression is modified and the cells change from monitoring role to one of protection and repair [12]. Activated microglia secrete a variety of inflammatory mediators including cytokines (TNF-α, and interleukins IL-1β and IL-6) and chemokines (macrophage inflammatory protein MIP-1α, monocyte chemoattractant protein MCP-1 and interferon (IFN) inducible protein IP-10) that promote the inflammatory state. The morphology of the cells changes from ramified to amoeboid as they take on a phagocytic role. These moderately active microglia are thought to perform beneficial functions, such as scavenging neurotoxins, removing dying cells and
11
cellular debris, and secreting trophic factors that promote neuronal survival. Persistent activation of brain-resident microglia may increase the permeability of the BBB and promote increased infiltration of peripheral macrophages, the phenotype of which is critically determined by the CNS environment [26]. Microglia are the critical convergence point for the many diverse triggers that elicit an adaptive immune response. Stroke, hypoxia, and trauma compromise neuronal survival and indirectly trigger neuroinflammation as microglia become activated in response to the insult in an attempt to limit further injury. Infectious agents and the exposure to neurotoxins activate microglia. Microglial responses to these toxins may contribute to neuronal dysfunction and eventually hasten neurodegeneration [12].
Astrocytes are specialized glial cells that represent 35% of the total CNS cell population (Figure 1.4). In physiological conditions, astrocytes carry out several functions thar involve the control of neuronal function. Astrocytes are essential for brain homeostasis, as they provide metabolites and growth factors to neurons, support synapse formation and plasticity, and regulate the extracellular balance of ions, fluid and neurotransmitters [27]. Thanks to their strategic location in close contact with CNS-resident cells (neurons, microglia, oligodendrocytes and other astrocytes) and blood vessels, astrocytes participate in BBB maintenance and permeability. They also play a role in the control of immune cell trafficking and activation. Astrocytes are immune-competent cells able to detect danger signals, respond via secretion of cytokines and chemokines, and activate adaptive immune defense [28]. However, microglia can become activated to produce H2O2, and cytokines such as interleukin
(IL)-1, IL-6, and TNF-α. Subsequently such cytokines can cause microglia to generate more ROS and to produce inducible nitric oxide synthase (iNOS) and hence excess of NO (nitric oxide). Cytokines can additionally be produced by activated astrocytes, and the latter may again respondto cytokines by iNOS induction. Thus, microglia and astrocytes are major mediators in brain
12
inflammation. CNS injury triggers a process leading to scar formation, whose impact on tissue homeostasis is ambivalent, as inflammatory and neurotoxic mediators are produced at injury site but remain confined to that area thanks to the glial scar.
Figure 1.4: Astrocyte and microglia cells.The neuroglia are the non-neuronal cells of the central nervous system and play a crucial role in the development and maintenance of the neurons that they support. Microglia contain branched
cytoplasmic processes and function as the macrophages of the CNS and play an important phagocytic role. Astrocytes are supporting cells within the CNS
that have numerous functions including providing structural support, insulating receptive surfaces, and buffering the extracellular compartment. Also, during inflammation and injury, they divide and wall off damaged areas
[29].
Astrocytes, as well as microglia, display an array of receptors involved in innate immunity, including Toll-like receptors (TLRs), nucleotidebinding oligomerization domains, double-stranded RNA dependent protein kinase, mannose receptor, and components of the complement system [18]. One
13
common feature of a variety of neurodegenerative disorders is the presence of a large number of activated glial cells including astrocytes and microglia that involve the changes of morphology and expression of many inflammation-related proteins. Gliosis, especially astrogliosis, is characterized by astrocytic proliferation, extensive hypertrophy of the cell body, and functional changes, when stimulated with various factors including Lipopolysaccharide from E. coli (LPS), IL-1𝛽, TNF-𝛼 [30,31]. Most studies have demonstrated that microglial cells play an important role in neuroinflammation and neurodegeneration, accumulating evidence has also demonstrated the characteristic changes of astrocytes in neurodegenerative diseases such as dementia (Figure 1.5) [18, 19].
Figure 1.5: How direct neurotoxic insults or inflammatory triggers can generate a vicious cycle of cytotoxic and stimulatory factors that leads to
15
CHAPTER II INTRODUCTION
2.1 Chronic kidney disease (CKD)
Chronic kidney disease (CKD) is a general term for heterogeneous disorders affecting the structure and function of the kidney (Figure 2.1). CKD is recognized as a major health problem affecting approximately 13% of the United States population [33] and the numbers are expected to continue to climb.1: infact the number of patients with kidney failure treated by dialysis and transplantation has increased dramatically in the United States from 209000 in 1991 to 472000 in 2004 [34].
Figure 2.1: Normal kidney vs. diseased kidney. A normal kidney has about 1 million filtering units. Each unit, called a glomerulus, connects to a tubule, which collects urine. Conditions such as CKD take a toll on kidney function by
damaging these filtering units and collecting tubules and causing scarring [35].
16
The definition of CKD is based on the presence of kidney damage (ie, albuminuria) or decreased kidney function, quantified by measured or estimated glomerular filtration rate (GFR <60 mL/min per 1·73 m²) that persists for 3 months or more [36, 37].
Because of the central role of GFR in the pathophysiology of complications, the disease is classifed into five stages on the basis of GFR (Figure 2.2):
• Stage 1: normal GFR ≥ 90 mL/min per 1.73 m2 and persistent albuminuria
• Stage 2: GFR between 60 to 89 mL/min per 1.73 m2
• Stage 3: GFR between 30 to 59 mL/min per 1.73 m2
• Stage 4: GFR between 15 to 29 mL/min per 1.73 m2
• Stage 5: GFR of < 15 mL/min per 1.73 m2 or end-stage renal disease
17
The prevalence of these stages of CKD in the US population is as follows: 1.8% for stage 1, 3.2% for stage 2, 7.7% for stage 3 and 0.35 % for stages 4 and 5. Patients with stage 3 or 4 disease progress to end stage renal disease or stage 5 at a rate of 1.5% per year. Stage 1 or 2 CKD patients progress to more advanced stages at approximately 0.5% per year 5.
Stage 5 CKD is often called end-stage kidney disease, end-stage renal disease, or end-stage kidney failure, and is largely synonymous with the now outdated terms chronic renal failure or chronic kidney failure; and usually means the patient requires renal replacement therapy, which may involve a form of dialysis, but ideally constitutes a kidney transplant.
Kidney failure is traditionally regarded as the most serious outcome of CKD and symptoms are usually caused by complications of reduced kidney function. When symptoms are severe they can be treated only by dialysis and transplantation; kidney failure treated this way is known as end-stage renal disease. Kidney failure is defined as a GFR of less than 15 mL/min per 1·73 m², or the need for treatment with dialysis or transplantation. Other outcomes include complications of reduced GFR, such as increased risk of cardiovascular disease, acute kidney injury, infection, cognitive impairment, and impaired physical function [39, 40]. Complications can occur at any stage, which often lead to death with no progression to kidney failure, and can arise from adverse effects of interventions to prevent or treat the disease.
In developed countries, CKD is generally associated with old age, diabetes, hypertension, obesity, and cardiovascular disease, with diabetic glomerulosclerosis and hypertensive nephrosclerosis as the presumed pathological entities; however, exact diagnosis is often difficult. Diabetes is the most prominent cause of CKD, accounting for 33% of adult CKD cases [41]. Conversely, 20% to 40% of diabetics will develop diabetic nephropathy during
18
the course of their disease; therefore, as the number of diabetic patients increases, the incidence of CKD can be expected to follow.
Diabetic glomerulosclerosis is characterised by slowly worsening albuminuria, hypertension, and progressive decline in GFR, sometimes with nephrotic syndrome. Hypertensive nephrosclerosis is associated with addition signs of hypertensive end-organ damage because of long periods of poorly controlled hypertension. Hypertensive nephrosclerosis has no distinct markers of kidney damage, but highnormal to high concentrations of albuminuria can occur after the onset of decreased GFR. Many patients with diabetes and CKD do not have typical features of diabetic glomerulosclerosis, and pathological findings of hypertensive nephrosclerosis are often more severe than expected because of the level of blood pressure. Atherosclerotic renovascular disease is suggested by a sudden worsening of hypertension, with findings of atherosclerosis in non-renal areas. Renal ultrasound may show asymmetrical kidney sizes, with the smaller kidney receiving less blood supply because of its renovascular disease. Vascular disease (primarily hypertension) is the second most common cause of CKD and it includes large vessel disease such as bilateral renal artery stenosis and small vessel disease such as ischemic nephropathy, hemolytic-uremic syndrome, and vasculitis. The presence of red-blood-cell or white-bloodcell casts, or specific imaging abnormalities, suggest another cause of kidney disease. In developing countries, common causes of CKD also include glomerular and tubulointerstitial diseases resulting from infections and exposure to drugs and toxins.
About one in ten people suffer from CKD. African Americans are at greater risk due to a prevalence of hypertension among them.
People with high blood pressure and diabetes are also at high risk of suffering from CKD than those people without these underlying conditions. About one of five adults with hypertension and one of three adults with diabetes have CKD.
19
Other health conditions that may lead to CKD are obesity, high cholesterol, a family history of the disease, lupus, and other forms of cardiovascular diseases. CKD was the cause of 956,000 deaths globally in 2013, up from 409,000 deaths in 1990. Studies have shown a true association between history of CKD in first- or second-degree relatives, and risk of disease [42]. In addition, African Americans may have higher serum levels of human leukocyte antigens (HLA) [42]. High HLA concentrations can contribute to increased systemic inflammation, which indirectly may lead to heightened susceptibility for developing kidney disease. Lack of nocturnal reduction in blood pressure among groups of African Americans is also offered as an explanation [42], which lends further credence to a genetic etiology of CKD racial disparities.
2.1.1 Uremic complications
The prevalence of the complications of CKD increases with each stage of the disease. As reported by National Kidney Foundation [41], many of the disorders associated with uremia are generally asymptomatic and can first be identified at GFRs of less than about 60 mL/min per 1x73 m². These disorders are more common as GFR declines, and when GFR is 15–30 mL/min per 1x73 m². The main complications are: cardiovascular (hypertension); hematologic (anaemia); endocrine (hyperparathyroidism), hyperphosphataemia and acidosis and hypocalcaemia and neurologic (dementia, pheripheral neuropathy; Figure 2.3) [43]. Fatigue, weakness, frailty, and decreased health-related quality of life are common but non-specific, and might be caused by comorbid disorders.
20
Figure 2.3: Uremic complications in CKD [44].
Impairments in renal excretory and endocrine function parallel reductions in GFR, leading to complex disorders that are characterised by solute retention, hormone deficiencies or resistance, and compensatory responses in other organ systems [45].
The increased cardiovascular risk associated with end stage renal disease has been well established, and estimated cardiovascular mortality rates are ten to one hundred fold higher among dialysis patients than age- and sex-matched individuals in the general population [46].
21
Hypertension is a traditional cardiovascular risk factor and is attributed to salt retention and increased vascular tone due to a failure to suppress the sympathetic nervous system and renin-angiotensin system, inhibition of sodium-potassium ATPase, and NO deficiency. Hypertension contributes to the cardiovascular risk associated with CKD. Szcech and coworkers demonstrated that patients with hypertension are at increased risk for new or recurrent cardiovascular events in individuals with stage 2–3 CKD [47]. Diabetes is associated with adverse outcomes in all stages of CKD [48].
The presence of left ventricular hypertrophy (LVH), a complication which increases in relation to progressively lower levels of eGFR, is also a cardiovascular risk determinant in CKD patients. Anemia and hypertension, are two CKD associated complications hypothesized to play a role in the development of LVH [49].
Abnormal serum phosphate levels, calciumphosphate ion product, and parathyroid hormone levels are independent cardiovascular risk factors in the setting of stage 5 CKD [50]. Higher calcium–phosphate products and the cumulative dose of oral calcium-based phosphate binders correlate with the extent and progression of arterial calcification in dialysis and stage 3 or 4 CKD patients Interestingly, serum phosphate levels were associated with increased rates of death and myocardial infarction in patients with stage 3 or 4 CKD [51]. This suggests that arterial calcification results in clinical morbidity and mortality in this patient population. Poorly controlled metabolic bone disease contributes to vascular calcification, which promotes arteriolosclerosis and increases vascular wall stiffness.
Anemia is defined as a reduction in one or more of the major red blood cell measurements; hemoglobin concentration, hematocrit, or red blood cell count. A normochromic, normocytic anemia usually accompanies progressive CKD [52] and there is a strong correlation between the prevalence of anemia and the severity of CKD. Therefore, primary care providers play an important role in
22
diagnosing and managing anemia in CKD patients. While anemia in CKD can result from multiple mechanisms (iron, folate, or vitamin B12 deficiency; gastrointestinal bleeding; severe hyperparathyroidism, systemic inflammation, and shortened red blood cell survival), decreased erythropoietin synthesis is the most important and specific etiology causing CKD-associated anemia. Erythropoietin is a glycoprotein secreted by the kidney interstitial fibroblasts and is essential for the growth and differentiation of red blood cells in the bone marrow. In CKD, tubular atrophy generates tubulointerstitial fibrosis, which compromises renal erythropoietin synthetic capacity and results in anemia [53]. The anemia of CKD increases morbidity and mortality from cardiovascular complications (angina, left ventricular hypertrophy and worsening heart failure), which may lead tofurther deterioration of renal function and the establishment of a vicious cycle termed the “cardiorenal anemia syndrome” [52]. The anemia of CKD is treated via recombinant human erythropoietin. Mineral and bone disorders in CKD are characterised by abnormalities in serum concentrations of calcium, phosphorus, 1,25-dihydroxycholecalciferol, and parathyroid hormone; abnormalities in bone morphology; and vascular calcification. Renal osteodystrophy is the spectrum of histological changes, which occur in bone architecture of patients with CKD. The kidney is the primary site for phosphate excretion and 1-α-hydroxylation of vitamin D. CKD patients develop hyperphosphatemia as a result of inadequate 1,25 dihydroxy-vitamin D levels that reflect reduced synthesis from parenchymal scarring. In addition, renal phosphate excretion is reduced. Together both processes cause, serum calcium levels to fall resulting in increased secretion of parathyroid hormone (secondary hyperparathyroidism). Parathyroid hormone has a phosphaturic effect. It also increases the calcium levels by increasing bone resorption and promoting 1-α-hydroxylation of 25-hydroxy vitamin D synthesized by the liver.
23
Acidosis, the suppressive effect of phosphate retention on renal synthesis of 1, 25 dihydroxyvitamin D synthesis, and absence of the physiologic inhibitory effect of vitamin D on parathormone secretion are also minor factors that contribute to the low turnover bone disease in CKD patients [54]. CKD-associated mineral bone disorders significantly increase mortality in CKD patients.
Dyslipidemia is a major risk factor for cardiovascular morbidity and mortality and is common among patients with CKD. In general, the prevalence of hyperlipidemia increases as renal function declines, with the degree of hypertriglyceridemia and elevation of LDL cholesterol being proportional to the severity of renal impairment.
Several factors contribute to the development dyslipidemia associated with chronic renal impairment. Hypercholesterolemia in nephrotic syndrome is thought to be due to increased production and decreased catabolism of lipoproteins.
As patients progress through the stages of CKD, nutritional requirements are altered and metabolism of protein, water, salt, potassium, and phosphorous are affected [55]. These changes lead to ineffective energy generation despite adequate intake of protein and carbohydrate substrates. In more extreme manifestations, these alterations in nutrient utilization cause “uremic malnutrition,” a syndrome that is distinct from malnutrition caused by inadequate nutrient intake.
Inflammation is a non-traditional risk factor believed to play a role in mediating cardiovascular risk in CKD. Markers of inflammation are often elevated in CKD patients and are predictive of cardiovascular risk in this population [56]. The chronically activated immune system in uremia leads to a chronic low-grade inflammation, and consequently to atherosclerotic cardiovascolar diseases [56] CKD patients present a chronically activated immune system, but on the other hand they spond poory to vaccination and to challenges such as bacterial
24
infection. Uremia-related immune dysfunction is a complex interaction between the innate and adaptive systems, in which immune activation and immune suppression coexist. On the one hand, as consequence of tissue damage, the innate immune system is triggered, and although inflammation is an essential response to eliminat aggressors, it can be considered a double-edged sword when the initial reaction is not limited. During inflammation, vasodilatation, vascular permeabibly, movement of inflammation cells, and activation of cells of the immunesystem are increased. In addition, acute-phase reactants can be produced, as can complement components, fever, and activation of systemic immunity. Therefore, to avoid tissue damage, inflammatory responses must be well organized and controlled by inflammatory mediators, as cytokines, proteases, prostaglandins, leukotrienes and vasoactive molecules [57]. On the other hand, regarding poor responce to infectious challenges, recent data have proposed that innate immunity, plays an important role. Firstly, th main cause of infactions in CKD is bacteria [58]. Reduce killing capabilities, modulated spontaneuos apoptosis of neutrophilis [59] and inhibited NO syntesis by macrophages have been described in the presence of uremia.Oxidative stress, as well as inflammation is crucial for the defense against infections and increases in parallel with the progression of CKD. Furthermore, the antioxidant systems are severely impaired in CKD patients and worsen progressively with the degree of renal failure.
2.1.2 Cognitive impairment in CKD
CKD is frequently associated with cognitive impairment: 17–50 % of all patients with CKD present with executive, memory and language deficits, depending on the stage of kidney disease [60-62]. Among patients with terminal CKD receiving hemodialysis, more than 85 % had cognitive deficits [63]. The neurological disease in CKD includes cognitive slowing, attention deficits, reduced cognitive flexibility, interference susceptibility, verbal and non-verbal
25
memory deficits, language (particularly disturbances in naming and word fluency) deficits. Cognitive deficits have direct relevance for daily function in CKD patients and contribute largely to the morbidity and mortality in these patients [64].
In patients with renal failure, encephalopathy is a common problem that may be caused by uremia, thiamine deficiency, dialysis, transplant rejection, hypertension, fluid and electrolyte disturbances or drug toxicity [65]. In general, encephalopathy presents with a symptom complex progressing from mild sensorial clouding to delirium and coma. It is often associated with headache, visual abnormalities, tremor, asterixis, multifocal myoclonus, chorea and seizures [65].
Dementia is more common in patients with renal failure than in the general population. The incidence of dementia in aged patients undergoing dialysis is estimated at 4.2%, with predominant occurrence of multi-infarct dementia [66,67]. Dementia should be differentiated from delirium and depression, which are also common problems in renal failure. Subacute and fast progressive dementia can occur in progressive multifocal leukoencephalopathy and dialysis dementia. Cerebral atrophy is common in patients with chronic renal failure, even in patients without evident cognitive, affective or behavioural changes. Cerebrovascular disease is a predominant cause of morbidity and mortality in patients with CKD. This population is prone to the development of atherosclerosis and ischemic stroke. But the presence of several risk factors also predisposes to hemorrhagic complications. Ischemic stroke in renal failure mainly results from atherosclerosis, thromboembolic disease or intradialytic hypotension. Atherosclerosis in patients with CKD is generally more diffuse and distally located than in the general population, probably because of combination of traditional atherogenic risk factors such as male gender, age, diabetes mellitus, hypertension, dyslipidemia and smoking with factors more specifically related to renal failure and its treatment [68].
26
Movement disorders in patients with renal failure can occur as a result of encephalopathy, medication or structural lesions. Several types of involuntary movements can occur in metabolic encephalopathy. Asterixis or “flapping tremor” is probably caused by sudden loss of tonus, originating from cortical dysfunction and clinically consists of multifocal action-induced jerks that can even mimic drop attacks in severe cases [69].
Neurological infections in patients with renal failure mainly present as acute, subacute or chronic meningitis, encephalitis, myelitis or brain abscess [70]. Infection with cytomegalovirus is the most frequent opportunistic infection following renal transplantation. The immunosuppressive state of patients with renal failure not only predisposes to infection with opportunistic pathogens, but is also associated with an increased incidence of de novo neoplasia.
Although development of neoplasms in the neurologic system is rare, malignant meningioma [71] and primary central nervous system lymphoma have been described in end stage renal failure [72].
2.2 Uremic Toxins
The uremic syndrome is characterized by the retention of various solutes that would normally be excreted by the kidneys. These compounds are called uremic called uremic retention solutes, or uremic toxins and they interact negatively with biologic functions [73].
In the past years, research on uremic toxicity resulted in the identification of dozens of retention solutes. In 2003, the European Uremic ToxinWork Group (EUTox) proposed a classification of 90 retention solutes providing data on normal and pathologic serum concentrations [73]. In 2007, results were further discussed and expanded with the addition of 14 solutes [74,75]. More recently, scientific and technological progress resulted in the identification of many new uremic retention solutes [76,77].
27
The most common classification, given by EUTox discriminates these solutes according to molecular weight (MW), to the ability to bind the proteins and to the removal pattern by dialysis process, into three groups:
1. Low-Molecular-Weight Water-Soluble Uremic Toxins. This group consists of small molecules (molecular weight <500 Da) that are soluble in water and easily removed by any dialysis strategy. Low-molecular-weight organic compounds may occur in free water-soluble form or bound to plasma proteins, which alters the function of both the toxin and the transporter protein. Of the 90 molecules evaluated by EUTox, 68 were found to be members of this group, the most common compounds being ADMA (asymmetric dimethylarginine), creatine, creatinine, hyaluronic acid, guanidine, guanidinoacetate, guanidinosuccinate, oxalate, SDMA (symmetric dimethylarginine), urea and uric acid. 2. Middle-Molecular-Weight Molecules. The molecular mass of
middle-molecular-weight molecules is above 500 Da. Members of this group include adiponectin, cystatin C, leptin, motilin, α1-acid glycoprotein, α1-microglobulin, endothelin, ghrelin, osteocalcin, β2-microglobulin. 3. Protein-Bound Solutes. This grup included protein-bound solutes.
Although the molecular weight of most members of this group is less than 500 Da, because of their protein-binding capacity they are recognized as ‘difficult to remove’ by dialysis. The main protein-bound solutes include: advanced glycation end products (AGEs), carboxy methyl propyl furanpropionic acid, cytokines, interleukins, TNF-α, dimethylguanidines, hippuric acid, homocysteine, indole-3-acetic acid, indoxyl glucuronide, indoxyl sulfate, kynurenic acid, kynurenine, leptin, phenolic compounds, p -cresyl sulfate, p -cresyl glucuronide, phenol sulfate, phenol glucuronide, phenylacetic acid, quinolinic acid and retinol-binding protein.
28
The gradual accumulation of retained uremic toxins results in uremic illness, which accompanies the progressive loss of kidney function [78]. Numerous signs and symptoms are associated with uremic illness, including anorexia, lethargy, decreased mental acuity, itching, nausea, sleep disturbance, and sexual dysfunction. Accumulation of uremic toxins has also been associated with progression of CKD, adverse cardiovascular outcomes, and mortality.
It has been suggested that uremic toxins promote progression of renal failure by damaging tubular cells and their overload accelerates the loss of kidney function, glomerular sclerosis and tubulointerstitial injury [78,80].
The liver and kidneys together comprise an organ system responsible for the removal of toxic compounds from the body. Renal function loss in patients with cirrhosis has been associated with a worse prognosis.
Studies investigating the phatophysiology of neurological disease in CKD have tended to focus on the hypothesis that ore more of these retained toxins is responsable for mediating the neurological dysfunction and cerebral endothelial dysfunction [81]. Uremic toxins in CKD may modulate lung dysfunction, susceptibility to lung injury [82]. Several studies have postulated that middle molecules are the toxins that underlie the developement of neurological disfunction in CKD [83].
2.2.1 Indoxyl Sulphate (IS)
Indoxyl sulfate (IS) is a solute that accumulates in the serum of CKD patients. Originally called “indican,” it was first isolated by Obermayer and Popper in 1911 and noted to be present in high concentrations in the blood of CKD patients. IS is a small solute (MW 213) and is at least 90% bound to plasma proteins (Figure 2.4). Being bound to proteins affects the dialytic behavior of IS. Vanholder and coworkers [84] proposed that the protein binding of IS limited its clearance, because the plasma levels of IS declined less than urea after dialysis, as only the free unbound solute can diffuse across the dialyzer
29
membrane [85-87]. Protein-bound solutes exist in rapid equilibrium between the bound and free, unbound state. As IS passes through capillaries surrounding the proximal tubules, the unbound solute is taken up in tubule cells by organic anion transporters (OAT1 and OAT3) located on the basolateral membrane [88,89]. It then passes into the tubular lumen through apical membrane transporters [90]. As an unbound IS molecule is secreted, another molecule will dissociate from plasma protein to maintain the binding equilibrium, allowing for its secretion.
Figure 2.4: IS chemical structure [91].
IS is derived from dietary tryptophan that reaches the colon is converted to indole by by gut microbiota tryptophanase (TnaA) action and absorbed into the systemic circulation. Indole is then oxidized to indoxyl by cytochrome p450 (CYP)-2E1, and sulphated by sulphotransferase (SULT)-1A1 to IS, in the liver (Figure 2.5). IS subsequently reaches the bloodstream is taken up into the tubular cells by basolateral multispecific organic anion transporters (OATs), especially OAT1 and OAT3, and then excreted from the kidney through tubular secretion [92].
Diet also plays an important role in the production of IS. As IS is derived from breakdown of tryptophan, higher dietary protein intake increases its production. Subjects with normal kidney function who consumed a high protein diet for 2
30
weeks had greater IS level and urinary excretion than those who consumed a low protein diet. In addition, subjects who consumed vegetarian diets had lower IS excretion than those consuming an unrestricted diet with higher protein content [93].
Figure 2.5: IS production and accumulation in CKD. Dietary tryptophan is converted to indole, by gut microbiota action. Indole is then oxidized to indoxyl by cytochrome p450 (CYP)-2E1, and sulphated by sulphotransferase (SULT)-1A1 to IS, both in the liver. During CKD, IS is unable to be excreted
in the urine, and therefore accumulates in serum. IS accumulation is associated with increased progression of kidney damage [94].
While IS is normally excreted into urine, in uremia the inadequate renal clearance of IS leads to an elevation of it [87]. The clearance value of IS in normal human is 3023±533 mL/min/1.73 m2, which is 22±4 times of creatinine
31
normal 0.53± 0.29 mg/L) and free IS (uremic patients 3.22±1.21mg/L vs. normal Not Detected) increases significantly in uremic patients [72].
Multiple studies have suggested that IS is toxic, having both renal and non-renal effects. It has been most extensively identified as a contributor to renal disease progression and vascular disease [87].
IS has been reported to injure the proximal tubule cells. As IS accumulates in the plasma with renal insufficiency, the level in the proximal tubule cells presumably rises and causes injury. The accumulation of IS, infact, generates free radicals, reduces superoxide scavenging activity, and consequently causes tubular cell injury by impairing the kidney’s anti-oxidative systems [96]. The damaged tubular cells produce transforming growth factor (TGF-b1) as well as chemokines such as intercellular adhesion molecule-1 (ICAM-1), monocyte chemoattractant protein-1 (MCP-1), osteopontin and endothelin-1 (ET-1). These chemokines promote the infiltration of macrophages. The secreted TGF-b1 stimulates the production of TIMP-1 and collagen. The damaged tubular cells are transformed into myofibroblasts through an epithelial-to-mesenchymal transition induced by TGF-b1, these changes facilitate interstitial fibrosis. IS accumulated in uremic serum accelerates tubular cell injury and induces subsequent interstitial fibrosis, thus acting as a nephrotoxin [87].
A series of studies by Niwa [87] tested the effect of oral IS administration on renal injury in rats with 5/6th nephrectomies. Compared to control, rats orally fed IS increased glomerular sclerosis. In proximal tubule cell culture studies, IS induces inflammation and fibrosis.
IS is thought to injure the vasculature through various mechanisms. Dou and coworkers [97] showed that IS impairs the proliferation and repair of human umbilical vein endothelial cells. Moreover IS may be involved in the pathogenesis of atherosclerosis in CKD patients, because it promotes worsening of atherosclerotic lesions and thrombosis by inducing vascular smooth muscle
32
cell proliferation [98]. Such in vitro experiments suggest that IS may play a role in the dysfunction of endothelial and vascular smooth muscle cells in CKD patients [87]. Gondouin and coworkers [99] reported the mechanism by which IS elicits this effect. IS is an agonist for the aryl hydrocarbon receptor (AhR) on vascular smooth muscle cells. The activation of this receptor inhibits the degradation of tissue factor, an initiator of coagulation, increasing its levels in endothelial cells.
Adijiang and coworkers [100] have demonstrated that IS promotes aortic calcification and aortic wall thickening in hypertensive rats. They also have further demonstrated in vitro that IS stimulates the generation of free radicals such as superoxide by up-regulating NADPH oxidase, and induces the expressions of osteoblast-specific proteins in human aortic smooth muscle cells. Free radicals production is important in inducing the transdifferentiation of human aortic smooth muscle cells into cells with a more osteoblastic phenotype. Vascular calcification plays a vital role in the development of cardiovascular morbidity and its resultant increased mortality, while vascular calcification affects both vascular intima and media layers, its underlying mechanism remains poorly understood. Other studies found that in patients with cardiomyopathy and CKD Stage 1 to 3, higher total IS levels were associated with risk of hospitalization for heart failure and cardiac death.
Barreto and coworkers [101] observed greater risk of cardiovascular mortality in CKD patients with increased total IS levels.
It has recently been reported the osteoblast cytotoxicity of IS. It induces oxidative stress in osteoblasts, impair osteoblast function and down-regulates parathyroid hormone (PTH) receptor expression and consequently leasds to osteodystrophy such as low-turnover bone [102].
Patients with renal failure exhibit neurological symptoms. Cognitive impairment is prominent and thought to be due to the accumulation of solutes in the plasma and the brain. IS levels were higher in the brain and plasma of
33
CKD patients (30µM) compared to control subjects (4.7 µM) [103]. Limited studies have related uremic solutes levels to cognitive impairment and their results have been inconclusive. Among various uremic toxins, IS is a likely candidate renal triggered cerebraldysfunction [104]. Yeh and coworkers [105] found higher IS levels were associated with impaired executive function in patients with CKD stage 3. There was no association, however, in the patients with more advanced CKD. A recent metabolomic analysis in hemodialysis patients did not show a relationship between IS and cognitive impairment [106].
35
AIM OF THE WORK
IS has been considered mainly as a nefro-toxin Considering that cognitive dysfunctions are frequent in CKD patients and it has been reported an IS accumulation, throught the OAT1/3 channels, in brain during CKD, in this project it has been examined the effects of IS on neuroinflammation and oxidative stress in CNS cells. For this purpose in vitro, in vivo and ex vivo experimental models have been used.
This study will be a step towards elucidating whether if this toxin could be a potential pharmacological therapeutic targets or solely biomarkers of disease progression in CKD patients.
37
CHAPTER III
MATERIALS AND METHODS 3.1 Reagents
Unless stated otherwise, all reagents and compounds were purchased from Sigma Chemicals Company (Sigma, Milan, Italy).
3.2 Cell cultures 3.2.1 In vitro studies
Glioma cells (C6) were obtained from American Type Culture Collection (ATCC; Manassas, VA, USA). Cells were grown in DMEM, 10% FBS (mL/L), 2 mML-glutamine and penicillin/streptomycin (100 units/0.1 mg/mL) at 37 °C in 5% CO2 atmosphere. Cells were passaged at confluence using a solution of
0.025% trypsin and 0.01% EDTA. The C6 glioma cell line was originally derived from rat brain tumors induced by N-nitrosomethylurea [107]; these cells have oligodendrocytic, astrocytic and neuronal properties [108] and are widely used as an astrocyte-like cell line [109].
3.2.2 Ex-vivo studies
3.2.2.1 Primary astocytes and glial cells
Mixed glial cell cultures from cortex and spinal cord were prepared from postnatal day 1–2 mouse pups (Female C57BL/6J mice; Harlan Laboratories, Udine, Italy). Mice were fed with standard chow diet and housed under specific pathogen-free conditions at the University of Messina, Department of Chemical, Biological, Pharmaceutical and Environmental Sciences. All animal experiments were performed under protocols that followed the Italian and European Community Council for Animal Care (DL. 26/2014). Cerebral cortices were excised, meninges, olfactory bulb and thalami removed, and the
38
hemispheres were transferred to Petri dishes containing HBSS and were cut into 4 small pieces. Brains were centrifuged for 1 min at 200-300g. The supernatant was removed and the pellet was incubated with HBSS/10mM HEPES buffer, 0.5 mg/ml Papain, 10μg DNAse solution for 25 min at 37°C. The extracted cells were centrifuged for 5 min at 200-300g and the pellet was resuspend in BME medium (10% FBS and 0.5% penicillin/streptomycin). The cell suspension was filtered through a 70-µm cell strainer to remove debris. The extracted cells were suspended in BME medium (10% FBS and 0.5% penicillin/streptomycin) in 75 cm3 flasks. Medium was changed after 48 h and then twice per week [110]. After 20 days, in some flasks, microglia were dislodged using an orbital shaker (200 rpm for 1 h, 37°C). Moreover to remove residual microglia from the remaining cell monolayers, it was used a 60-min exposure (50 mM) to the lysosomotropic agent Leu-Leu-OMe (<5 % microglia, flow cytometry using anti-Iba1 as antibody) [111].
3.2.2.2 Primary neurons
Dissociated cell cultures of mouse cortex and hippocampus were established from day 16 C57BL/6J mouse embryos, as previously described [112]. Cortical and hippocampal neurons were plated in 35, 60 or 100-mm diameter polyethylenimine-coated plastic dishes and maintained at 37 °C in Neurobasal medium containing 25 mM of glucose and B-27 supplement (Invitrogen), 2 mM Lglutamine, 0.001% gentamycin sulfate and 1 mM HEPES (pH 7.2). Approximately 95% of the cells in such cultures were neurons and the remaining cells were astrocytes.
3.2.3 Cell treatment
C6 cells, primary astrocytes and mixed glial cell cultures were plated and allowed to adhere for 24 h; thereafter, the medium was replaced with fresh
39
medium and cells were treated with IS (15-60 µM) for 1h alone or in combination with LPS (1 µg/ml) and Interferon γ (IFN 100 U/ml) for 24h. Primary cortical and hippocampal neuronal cultures were plated and allowed to adhere for 2 weeks; thereafter, the medium was replaced with fresh medium and cells were treated with IS (15-60 µM) or with supernatant from primary astrocytes and mixed glial cultures treated with IS (15-60µM) for 24h.
For the experiments, we referred to the list of uremic toxins provided by the European Uremic Toxin Work group [69] and thus consided an IS concentration range found in the cerebrospinal fluid of CKD patients [112].
3.3 Nitrite determination
C6 cells were plated at a density of 3.0x10⁵ cells/well into 24-well plates and
primary astrocytes and mixed glial cell cultures were plated at a density of 1.5x10⁵ cells/well into 24-well plates. Thereafter, the medium was replaced with
fresh medium and cells were treated with IS (15-60 µM) for 1 h and then co-exposed to LPS (1 µg/ml)+IFN (100 U/ml). In some experiments with C6 cells, pyrrolidine dithiocarbamate (PDTC; 200 μM) a potent NF-kB inhibitor or CH-223191 (1 μM),a selective AhR antagonist, were added 1 h before IS. NO generation was measured as nitrite (NO2-), index of NO released by cells, in the
culture medium 24 h after LPS stimulation by Griess reaction, as previously reported [113]. Briefly, 100 µL of cell culture medium were mixed with 100 µL of Griess reagent – equal volumes of 1% (w:v) sulphanilamide in 5% (v:v) phosphoric acid and 0.1% (w:v) naphtylethylenediamine-hydrogen chloride (HCl) and incubated at room temperature for 10 min, and then the absorbance was measured at 550 nm in a microplate reader Titertek (Dasit, Cornaredo, Milan, Italy). The amount of NO2-, as µM concentration, in the samples was
40
3.4 iNOS, COX-2, HO-1, NQO1, SOD, caspase-1 and nitrotyrosine detection
iNOS, cicloxygenase-2 (COX-2), heme oxigenase-1 (HO-1), NAD(P)H dehydrogenase quinone 1 (NQO1), superoxide dismutase (SOD) expression and nitrotyrosine formation in C6 cells and iNOS, COX-2, HO-1 expression and nitrotyrosine formation were assessed by cytofluorimetric analysis primary astrocytes and mixed glial cell cultures. C6 cells were plated into 96-well plates (5×10⁴ cells/well) and astrocytes and mixed glial cell cultures were plated into
96-well plates (3.5×10⁴ cells/well) and were allowed to grow for 24 h at 37 °C
in a 5% CO2 atmosphere before experiments. Thereafter the medium was
replaced with fresh medium and cells were treated with IS (15-60 µM) for 1 and then co-exposed to LPS (1 µg/ml)+IFN (100 U/ml) for further 24 h. Cells were collected, washed twice PBS and then incubated in Fixing Solution for 20 min at 4°C and then incubated in Fix Perm Solution for 30 min at 4°C. Anti-iNOS antibody, anti-COX-2 antibody (BD Laboratories), anti-HO-1 antibody (Santa Cruz Biotechnologies), anti-NQO1 antibody (Santa Cruz Biotechnologies), anti-SOD antibody (Santa Cruz Biotechnologies) and anti-nitrotyrosine antibody (Millipore) were then added to C6 cells for further 30 min and anti-iNOS, anti-COX-2 (BD Laboratories), anti-nitrotyrosine antibody (Millipore) and HO-1 (Santa Cruz Biotechnologies) were added to astrocytes and mixed glial cells for further 30 min. The secondary antibody was added in Fix Perm solution and cells were evaluated using a fluorescence-activated cell sorting (FACSscan; Becton Dickinson) and elaborated with Cell Quest software as previously reported [114].
Caspase-1 protein expression in C6 cells was assessed by Western blot analysis. C6 cells were seeded in P60 plates (1.8x10⁶ cells/P60) and allowed to adhere.
Thereafter, the medium was replaced with fresh medium and cells were treated with IS (15-60 µM) for 1 h and then co-exposed to LPS (1 µg/ml)+IFN (100 U/ml) for further 24 h for detection of caspase-1 expression.
41
Cells were scraped off, washed with ice-cold phosphate-buffered saline (PBS), and centrifuged at 5.000 g for 10 min at 4°C. The cell pellet was lysed in a buffer containing 20 mM Tris HCl (pH 7.5), 1 mM sodium orthovanadate, 1 mM phenylmethylsulfonyl fluoride, 10 µg/ml leupeptin, 10 mM sodium fluoride, 150 mM sodium chloride, 10 mg/ml trypsin inhibitor, and 1% Tween-20. Protein concentration was estimated by the Bio-Rad protein assay using bovine serum albumin as standard. Equal amounts of protein (50 µg/line) were dissolved in Laemmli’s sample buffer, boiled, and run on a SDS polyacrylamide gel electrophoresis (SDS-PAGE) minigel (8% polyacrylamide) and then transferred to hybond polyvinylidene difluoride membrane for 40 min. at 5 mA cm2 into 0.45 mm. Membranes were blocked for 40 min in PBS and 5% (w/v)
nonfat milk and subsequently probed overnight at 4°C with mouse monoclonal anti-caspase-1 (Abcam) in PBS, 5% w/v non fat milk, and 0.1% Tween-20. Blots were then incubated with horseradish peroxidase conjugated goat antimouse immunoglobulin (Ig)G (1:5.000) for 1 h at room temperature. Immunoreactive bands were visualized using electro-chemiluminescence assay (ECL) detection system according to the manufacturer’s instructions and exposed to Kodak X-Omat film. The protein bands of caspase-1 and tubulin on XOmat films were quantified by scanning densitometry (Imaging Densitometer GS-700 BIO-RAD U.S.A.). Data were normalized with tubulin expression, used as reference protein, and expressed as arbitrary densitometric units as previously reported [114].
3.5 TNF-α, IL-6 and IL-1β determination
TNF-α, IL-6 and IL-1 β concentration in the supernatant of C6 cells and cultured primary astrocytes and mixed glial cells stimulated for 1h with IS (15-60 µM) and then co-exposed to LPS (1 µg/ml)+IFN (100 U/ml) for further 24 h were assessed by an Enzyme-Linked Immuno Sorbent Assay (ELISA) assay. In some experiments with C6 cells, PDTC (200 μM) or CH-223191 (1 μM), were added
42
1 h before IS. For this we used commercially available kits for murine TNF-α and IL-6 according to manufacturer’s instruction (e-Biosciences, CA, USA). 3.6 Immunofluorescence analysis with confocal microscopy
For immunofluorescence assay, C6 cells (3.0x10⁵/well), primary astrocytes and
mixed glial cells (2.0x10⁵/well) were seeded on coverslips in 12 well plate and
treated for 1 h with IS (30 µM) and then co-exposed to LPS (1 µg/ml)+IFN (100 U/ml) for 1h. In some experiments with C6 cells, PDTC (200 μM) or CH-223191 (1 μM), were added 1 h before IS.
Then cells were fixed with 4% paraformaldehyde in PBS and permeabilized with 0.1% Triton X-100 in PBS. After blocking with BSA and PBS, cells were incubated with rabbit anti-nuclear factor (erythroid-derived 2)-like 2 (Nrf2) antibody (Santa Cruz Biotechnologies), with mouse anti-AhR antibody (Abcam) and with rabbit anti-p65 NF-kB antibody (Santa Cruz Biotechnologies) for 1 h at 37°C. The slides were then washed with PBS for three times and fluorescein-conjugated secondary antibody was added for 1 h. DAPI was used for counterstaining of nuclei. Coverslips were finally mounted in mounting medium and fluorescence images were taken using the Laser Confocal Microscope (Leica TCS SP5).
3.7 Measurement of ROS
ROS formation was evaluated utilizing the probe 2’,7’-dichlorofluorescin-diacetate (H2DCF-DA) as previously reported [116]. In the presence of intracellular ROS, H2DCF is rapidly oxidized to the highly fluorescent 2’,7’-dichlorofluorescein (DCF). Briefly, C6 cells were plated at a density of 3.0x10⁵
cells/well into 24-well plates and primary astrocytes and mixed glial cell cultures were plated at a density of 1.5x10⁵ cells/well into 24-well plates. Cells
were allowed to adhere for 24h; thereafter, the medium was replaced with fresh medium and cells were treated with IS (15-60 µM) for 1 h and then co-exposed

![Figure 2.2: Stages of CKD [38].](https://thumb-eu.123doks.com/thumbv2/123dokorg/7206205.76097/24.892.143.693.679.867/figure-stages-of-ckd.webp)
![Figure 2.3: Uremic complications in CKD [44].](https://thumb-eu.123doks.com/thumbv2/123dokorg/7206205.76097/28.892.251.662.178.640/figure-uremic-complications-in-ckd.webp)