INTERNATIONAL JOURNAL OF MOLEcULAR MEdIcINE 43: 2303-2318, 2019
Abstract. down syndrome (dS) is caused by the presence of part or all of a third copy of chromosome 21. dS is associ-ated with several phenotypes, including intellectual disability, congenital heart disease, childhood leukemia and immune defects. Specific microRNAs (miRNAs/miR) have been described to be associated with dS, although none of them so far have been unequivocally linked to the pathology. The present study focuses to the best of our knowledge for the first time on the miRNAs contained in nanosized RNA carriers circulating in the blood. Fractions enriched in nanosized RNA-carriers were separated from the plasma of young participants with dS and their non-trisomic siblings and miRNAs were extracted. A microarray-based analysis on a small cohort of samples led to the identification of the three most abundant miRNAs, namely miR-16-5p, miR-99b-5p and miR-144-3p. These miRNAs were then profiled for 15 pairs of DS and non‑trisomic sibling couples by reverse transcription-quantitative polymerase chain reaction (RT-qPcR). Results identified a clear differential expression trend of these miRNAs in dS with respect to their non-trisomic siblings and gene ontology analysis pointed to their potential role in a number of typical dS features, including ‘nervous system development’, ‘neuronal cell body’ and certain forms of ‘leukemia’. Finally, these expression levels
were associated with certain typical quantitative and qualita-tive clinical features of dS. These results contribute to the efforts in defining the DS‑associated pathogenic mechanisms and emphasize the importance of properly stratifying the miRNA fluid vehicles in order to probe biomolecules that are otherwise hidden and/or not accessible to (standard) analysis. Introduction
down syndrome (dS) is the most frequent human chromo-somal disorder with a frequency of 1/400 conceptions and 1/1,000 births worldwide (1,2). Since the initial discovery of Lejeune et al (3), it is known that the presence of full or partial chromosome 21 (Hsa21) in three copies (trisomy 21) in the cells of the affected subjects is responsible for the typical features of dS, in particular intellectual disability (Id), cardiovascular defects (4,5) and craniofacial dysmorphism. Importantly, a highly restricted ‘down syndrome critical region’ of 34 kb on distal 21q22.13 appears to be specifically duplicated in all individuals with dS (6,7). In addition, a recent study conducted on plasma and urine samples of individuals with dS demonstrated a systematic deviation of metabolites involved in central metabolic processes associated with mito-chondrial metabolism including the Krebs cycle, glycolysis and oxidative phosphorylation in dS (8).
despite intense efforts of the scientific community, the pathogenic mechanism linking chromosome 21 and dS is remains largely uncharacterized, and pharmacological therapies targeting genes located on Hsa21 have not been developed so far. Therefore, current research shifted to study the involvement of non-coding RNAs (e.g., microRNAs) in the process (7). microRNAs (miRNAs/miR) are small single stranded nucleic acids that regulate gene expression post-transcriptionally via binding to different mRNA targets, resulting in inhibition of mRNA translation (9,10). Increasing evidence indicates that miRNAs serve important roles in a large variety of biological
Analysis of a nanoparticle‑enriched fraction of plasma reveals
miRNA candidates for Down syndrome pathogenesis
ALESSANdRO SALVI1, MARIKA VEZZOLI2, SARA BUSATTO1, LUcIA PAOLINI1,3, TERESA FARANdA1, EdOARdO ABENI1, MARIA cARAcAUSI4, FRANcEScA ANTONAROS3,
ALLISON PIOVESAN3, cHIARA LOcATELLI5, GUIdO cOccHI5,6, GUALTIERO ALVISI7, GIUSEPPINA dE PETRO1, dORIS RIcOTTA1, PAOLO BERGESE1,3 and ANNALISA RAdEGHIERI1,3
1department of Molecular and Translational Medicine, University of Brescia; 2Unit of Biostatistics,
department of Molecular and Translational Medicine, University of Brescia, I-25123 Brescia; 3cSGI, Research center for colloids and Nanoscience, Sesto Fiorentino, I-50019 Florence; 4department of Experimental, diagnostic and Specialty
Medicine (dIMES), Unit of Histology, Embryology and Applied Biology, University of Bologna; 5Neonatology Unit, St. Orsola-Malpighi Polyclinic; 6department of Medical and Surgical Sciences (dIMEc), University of Bologna,
I-40138 Bologna; 7department of Molecular Medicine, University of Padua, I-35121 Padua, Italy Received November 16, 2018; Accepted March 20, 2019
dOI: 10.3892/ijmm.2019.4158
Correspondence to: dr Annalisa Radeghieri, department of Molecular and Translational Medicine, University of Brescia, viale Europa 11, I-25123 Brescia, Italy
E-mail: [email protected]
Key words: down syndrome, miRNA, extracellular vesicles, high-density lipoproteins, gene ontology
processes including development, differentiation, proliferation and apoptosis (11). It is well documented that intracellularly produced miRNAs can be secreted in the extracellular milieu, mostly associated with Ago proteins, bound to lipoproteins or secreted in extracellular vesicles (EVs) (12-15). due to their nature, the latter two may provide an enriched and preserved source of miRNAs (16-19), therefore they may be better associated with the disease state than total plasma analysis (20,21), allowing a deeper understanding of the ongoing pathological processes and complementing previous studies.
Intriguingly, several circulating miRNAs have been differ-entially retrieved from either placenta or plasma samples of euploid and subjects with dS (22,23). However, only a few of them (miR-99a, miR-125b, let-7c and miR-155) were mapped on Hsa21 (24). It should also be noted that in other studies no Hsa21‑derived miRNAs were identified to be differentially expressed in association with dS (25,26). This variability may derive from the type of sample analyzed and the extraction procedure used to recover the nucleic acids.
The present study focused for the first time on a subset of miRNAs carried by circulating biogenic nanoparticles, namely EVs and high-density lipoproteins (HdLs). Biogenic nanopar-ticles formulations, also referred to as nanoparticle-enriched fraction (NEF), were obtained from the plasma of young subjects with DS and their miRNA expression profiles system-atically compared with those of NEF from their non-trisomic siblings. Interestingly, three novel candidate miRNAs emerged from the present study (miR-16-5p, miR-144-3p and miR-99b-5p) that could help unraveling molecular aspects underlying the complex dS pathogenic phenotype.
Materials and methods
Subject enrolment. For all participants involved in the present
study (approved by the competent Ethics committee of Sant'Orsola-Malpighi Hospital in Bologna, Italy; approval no. 39/2013/U/Tess) written informed consent was obtained from the parents in the case of subjects with age below 18 years and from the subjects themselves if aged over 18 years, according to the approved protocol.
Patient enrolment was performed at the Unit of Neonatology of Sant'Orsola-Malpighi Hospital in Bologna, Italy from February 2014 to March 2016. All methods were performed in accordance with ethical principles for Medical Research involving human subjects of the Helsinki declaration.
The exclusion criteria of the enrolment to the study were: Age <2 years old, distress at birth, strongly premature (EG <35 weeks) and severe central nervous system (cNS) disease at birth. The presence or absence of each clinical feature and comorbidity was assessed based on the agreed clinical judgment of at least two pediatricians with long-time experience in the follow-up of children with dS, following a complete, systematic visit of the subject and an interview with the parents.
Case selection. In this study, a dataset containing 30
partici-pants: 15 young subjects with dS (dS; 7 females and 8 males, aged 4-20 years, mean 11.71±5.12 years) and the corresponding 15 healthy siblings (c; 4 females and 11 males, aged 2-25 years, mean 14.24±6.42 years) was used. For each subject with dS,
information was collected on the age of the parent, birth weight, development stage in the first months of life (sitting, babbling, walking and sphincter control), the presence/absence of 37 typical down syndrome traits (dichotomous variables) and the evaluation of the neurological impairment (mild, moderate and severe). In the absence of the availability of cognitive test quantitative results, the latter evaluation was based, following accurate visit of the subject and an interview with the parents, on the agreed clinical judgment of at least two pediatricians with long-time experience in the follow-up of children with dS, aimed to assess if each subject fell in the relative top, medium or lower class of cognitive and global performance within the population.
Collection of blood samples. Blood samples (3 ml) were
collected in EdTA-coated blood collection tubes and processed within 2 h from blood draw (27,28). All traceable identifiers were removed prior to analysis to protect patient confidentiality, all samples were analyzed anonymously (29). The sample was transferred in a new tube and centrifuged at 1,250 x g for 10 min at room temperature (centrifuge ALc 4235 A, rotor ALc T111). The plasma fraction was isolated and centrifuged for a second time at 800 x g for 30 min at room temperature (centrifuge ALc4214, rotor 6642) and the supernatant was transferred to new tubes without touching the pellet or the bottom of the tube, and divided in aliquots of 300 µl. All plasma samples were rapidly frozen and stored at ‑80˚C until needed for subsequent analysis.
The exclusion criteria of plasma samples from the subse-quent analysis were: Blood sample treatment after 2 h from the draw, or evident contamination of plasma samples by residual erythrocytes at the end of the treatment.
NEF separation from plasma and miRNA isolation. A total of
300 µl of plasma were used to obtain the NEF with Exosome Precipitation Solution (Serum/Plasma; Macherey-Nagel GmbH, düren, Germany), according to manufacturer's protocol. Briefly the plasma was centrifuged at 10,000 x g for 15 min at 4˚C to pellet intact cells, cellular debris and bigger vesicles. Then the supernatant was mixed with ‘Exosome precipitation solution’, incubated for 30 min on ice and finally centrifuged at 600 x g for 5 min at 4˚C. The supernatant was kept for further analyses. The pellet was then resuspended in 300 µl RNAse free water and miRNAs were extracted using ‘NucleoSpin miRNA Plasma’ kit (Machery-Nagel GmbH), according to the manufacturer's protocol.
For reverse transcription-quantitative polymerase chain reaction (RT-qPcR) analyses, 3 µl of a 4.16 nM solution of the synthetic miRNA cel-miR-39-3p from C. elegans (custom synthesized by Integrated dNA Technologies, coralville, IO, USA) were added. miRNA fractions were eluted in 35 µl of nuclease-free water.
Western blotting. Proteins from NEF preparations obtained
from c and dS plasma and associated supernatants were extracted with reducing SdS sample buffer (80 mM Tris, pH 6.8, 2% SdS, 7.5% glycerol, and 0.01% bromophenol blue) supplemented with 2% 2‑mercaptoethanol for 5 min at 95˚C and quantified by a Bradford's assay. A total of 50 µg of the prepara-tions were loaded onto a 10% acrylamide/bis-acrylamide gel,
INTERNATIONAL JOURNAL OF MOLEcULAR MEdIcINE 43: 2303-2318, 2019 2305
electrophoretically separated by SdS-PAGE and transferred to polyvinylidene difluoride membranes (30,31). Membranes were then blocked at 37˚C for 1 h in 5% non‑fat milk, 10 mM Tris-Hcl pH 7.5, 100 mM Nacl, 0.1% Tween-20 and probed with the following primary antibodies (all at 1:500 dilu-tion) at 4˚C for 16 h: Mouse anti‑Lamp1 (BD Biosciences, San Jose, cA, USA; cat. no. 611042), mouse anti-cluster of differentiation (cd)63 (EMd Millipore, Billerica, MA, USA; clone RFAc4, cat. no. cBL553), rabbit anti-Adam10 (Acris OriGene Technologies GmbH, Germany, clone 3c6, cat. no. AP05830PU-N), mouse anti-TSG101 (Santa cruz Biotechnology, Inc., dallas, TX, USA; clone c-2, cat. no. sc-7964), mouse anti-Flotillin2 (Bd Biosciences, San Jose, cA, USA; cat. no. 610383), mouse anti-cd81 (Santa cruz Biotechnology, Inc.; clone B11, cat. no. sc-7637), mouse anti GM130 (Bd Biosciences, San Jose, cA, USA; clone 35/GM130, cat. no. 610822) (32), mouse anti-ApoAI (Thermo Fischer Scientific, Inc.; clone 19H20L19, cat. no. 701239), mouse anti-Ago2 (Origene Technologies, Inc., Rockville, Md, USA; cat. no. TA352430) and incubated in the presence of specific horseradish-peroxidase conjugated immunoglobulin (Ig)G, Rabbit anti-mouse (cat. no. A90-117P) or Goat anti-rabbit (cat. no. A120-101P) (Bethyl Laboratories, Inc, USA, 1:3,000 dilu-tion) at room temperature for 1 h (33,34). Immunoreactive bands were identified using the Luminata classico detection system (EMd Millipore). Images were acquired using a G:Box Chemi XT Imaging system and quantified using Gene Tools software version 4.01 (Syngene, Frederick, Md, USA) (35).
Atomic force microscopy (AFM) imaging. AFM imaging was
conducted as described (36,37). Briefly, NEF preparations were diluted 1:200 with deionized water. A total of 5-10 µl of samples were then spotted onto freshly cleaved mica sheets (Grade V-1, thickness 0.15 mm, size 10x10 mm). All mica substrates were dried at room temperature and analyzed using a Nanosurf NaioAFM (Nanosurf AG, Liestal, Switzerland), equipped with Tap190AI-G tips (Budget Sensors; Innovative Solutions Bulgaria Ltd., Sofia, Bulgaria). Images were captured in tapping mode; the scan size ranged from 0.5-15 mm; the scan speed ranged from 0.6 to 1.5 sec x line.
miRNA expression by qPCR. Mature hsa-miR-16-5p,
hsa-miR-99b-5p and hsa-miR-144-3p were amplified by a two-step Taq-Man RT-PcR analysis, using primers and probes obtained from Thermo Fisher Scientific, Inc., (hsa‑miR‑144‑3p, cat. no. 002676; hsa-miR-16-5p, cat. no. 000391; hsa-miR-99b-5p, cat. no. 000436; cel-miR-39-3p, cat. no. 000200). cdNA was synthesized from 5 µl of the each RNA fraction in 15 µl reactions, using TaqMan MicroRNA Reverse Transcription kit (Thermo Fisher Scientific, Inc.). The reverse transcription reaction was performed by incubating the samples at 16˚C for 30 min, followed by incubation at 42˚C for 30 min and 85˚C for 5 min. The RT-qPcR reaction (20 µl) contained 1.3 µl of reverse transcription product, 10 µl of Taq-Man 2X Universal PcR Master Mix and 1 µl of the appropriate TaqMan MicroRNA Assay (20X) specific for the miRNA targeted by the assay. The PCR mixtures were incubated at 95˚C for 10 min, followed by 40 cycles at 95˚C for 15 sec and 60˚C for 60 sec. PCRs were performed in triplicate using the 7500 real time PcR system (Applied Biosystems; Thermo Fisher Scientific, Inc.). The
expression of miRs was based on the 2-∆∆cq method (38), using cel-miR-39-3p as reference.
Bioinformatic analysis. For functional enrichment analysis
of gene ontology terms and molecular signalling pathway, the following online software packages were used: database for Annotation, Visualization and Integrated discovery (dAVId) (39) and WebGestalt (40) and Kyoto Encyclopedia of Genes and Genomes analysis (KEGG; www.genome. jp/kegg/). The human disease database Malacards (41) was used to search the diseases and the genes associated with dS. The miRNA targets were predicted by miRWALK (42). considering that these procedures may have a certain false positive rate, the target genes of miRNA only considered the genes predicted by at least 7 procedures.
Statistical analysis
Descriptive statistics. The descriptive statistics for all
quanti-tative variables available in the dataset (minimum, maximum, first, second and third quartile, mean ± standard deviation, number and corresponding percentage of missing values) and the frequency distributions of 37 typical dS pathologies (presence/absence of the pathology-in absolute value and %-) have been computed.
The investigation on the linear association between the quantitative variables collected on 15 individuals with dS has been performed by calculating the Pearson correlation coefficient ρ.
For the graphical representation of the significant asso-ciations (correlation tests with P<0.05) between variables under inspection, bubble charts were used that introduce in a simple scatterplot a third dimension, namely the diameter of the bubble. This dimension is proportional to the categorical variable called ‘number of comorbidities’. In detail, for each individual with dS his/her number of comorbidities were summed, obtaining a quantitative score; then the first (Q1) and third (Q3) quartile were computed and the quantitative score were turned into the following three categories: i) First quartile (Q1=17.5), each subject with number of comorbidities <17.5 was classified as Low comorbidities; ii) third quartile (Q3=21), each subject with number of comorbidities >=17.5 and <21 was classified as Medium comorbidities; and iii) each subject with number of comorbidities >=21 was classified as High comorbidities.
consequently, the scatterplots that highlight the significa-tive association between quantitasignifica-tive variables report the dot circumference proportional to the number of assigned comor-bidities: Small dots when subjects with DS are classified as ‘Low comorbidities’ (green); medium size dots for ‘Medium comorbidities’ (orange) and big dots when they are labeled as ‘High comorbidities’ (red).
For each of the qualitative variables reported (Table SI; considering also the neurological severity), the median values of the miRNAs expression levels in correspondence of subgroups of subjects defined by its categories were computed. Then, the non-parametric Wilcoxon signed-rank test (or Kruskal Wallis test when the subgroups are >2) was computed in order to compare the medians obtained (Table SII). These non-para-metric tests do not require any assumptions on the shape
distributions of the three miRNAs and permit analysis of the possible association between clinical variables and miRNAs expression. The unique significant associations were visual-ized by means of a boxplot for each category (Low, Medium and High comorbidities).
Heatmap generation. The data matrix with the investigated
miRNAs was visualized by means of a heatmap. Starting from the standardized matrix (each miRNA has mean 0 and standard deviation 1), a heatmap was generated to visualize the miRNA expression (low values are represented with blue while high values with red). In this graph, similar values were placed near each other according to the clustering algorithm used in the analysis, thereby realizing one dendrogram appended on the left y-axis.
k‑medoids cluster analysis. Starting from the data matrix
containing only miRNA expression levels, we use the
k-medoids cluster analysis generating k=2 groups. For
evalu-ating the distance between subjects the Manhattan distance was used, which is based on absolute value distance. This choice should provide more robust results, whereas Euclidean distance would be influenced by unusual values in the data matrix.
Inside each group, subjects exhibit a high degree of similarity based on miRNA expression while subjects belonging to different groups are as dissimilar as possible. The k-medoids cluster analysis (known also with the acronym PAM-Partitioning Around Medoids) searched for k repre-sentative subjects (in the present study k=2) among all the subjects in the dataset. These representative subjects are called medoids (43) and the algorithm assigns each patients of the dataset to nearest medoid.
By means of silhouettes a graphical representation of cluster analysis was provided where the entire clustering was displayed by plotting the silhouette into a diagram highlighting the cluster quality. denoting cluster 1 with C1 and cluster 2 with C2, silhouette for the subject i contained in C1 was:
where: a(i)=average dissimilarity of I to all subjects of C1 and b(i)=average dissimilarity of I to all subjects of C2.
From the ratio above, it is evident that each silhouette belongs to the interval ‑1≤ s(i) ≤+1. This means that when s(i) is close to 1 the within dissimilarities a(i) is smaller than the between dissimilarities b(i) and i is well classified. When s(i)
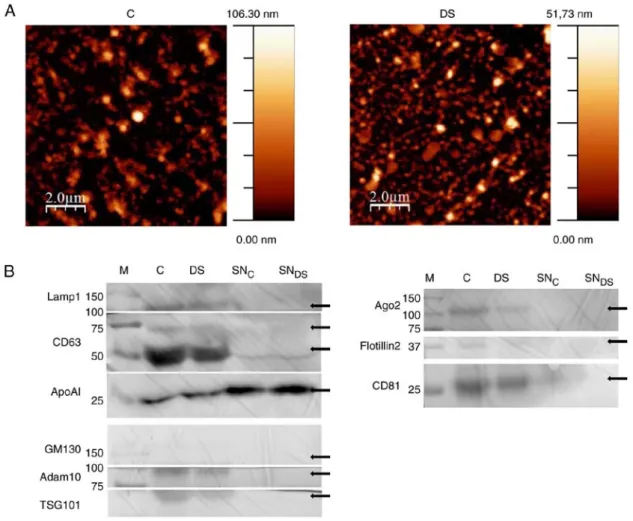
Figure 1. NEF characterization by AFM and western blotting. (A) Morphological analysis by AFM of c and dS NEF preparations. Images are representative of 3 independent experiments. (B) NEF obtained from c and dS plasma and the corresponding supernatants (SNc and SNdS) were immunoblotted for the indicated
extracellular vesicles and high density lipoprotoeins markers (see text for details). Due to antibody‑unspecific signals, the original image of western blotting membranes has been cropped. The uncropped, original image is available upon request. dS, down syndrome; c, healthy control; NEF, nanoparticle-enriched fraction; AFM, atomic force microscopy; miR, microRNA; SNc, SNdS, c and dS plasma corresponding supernatants; M, marker; cd, cluster of differentiation.
INTERNATIONAL JOURNAL OF MOLEcULAR MEdIcINE 43: 2303-2318, 2019 2307
is about 0, it is not clear where i should be assigned (cluster C1 orC2) and finally when s(i) is close to -1, a(i) is larger than b(i) and this means that i has been misclassified.
All statistical analyses were performed using R version 3.4.4.
Results
NEF separation, characterization and miRNA extraction.
NEF samples were obtained with a commercial polymer-based precipitation (PBP) kit as described in the Materials and methods section. PBP is a simple, timesaving and cheap EV concentration method (44) characterized by low specificity. Formulations obtained by PBP consist in a heterogeneous mix of nanosized particles that overlap EVs in size and morphology, including HdLs.
NEF morphological properties were determined by AFM (45). The preparation was adsorbed on a freshly cleaved mica surface and imaged under ambient conditions. Samples were composed by spherical nano-objects with a size ranging from 10s to a few 100s of nm, which are visible despite the presence of background material, very like the polymeric matrix on which the precipitation kit is based (44,46) (Fig. 1A). The resulting fraction is mainly composed by small EVs and HDLs, as can be deduced by the enrichment of specific EV markers (47), including Lamp1, cd63, Adam 10, TSG101, Ago2 and cd81, as compared with the supernatant fractions by western blot analysis (Fig. 1B). On the other hand, NEF is devoid of both GM130s and Flotillin, excluding the presence of intracellular contaminants and implying that that large EVs are not efficiently enriched by this protocol. On the other hand Apo-A1, a biomarker characteristic of HdL lipoproteins (48),
Figure 2. Expression levels of miRNAs in NEF from the couples of siblings. Relative expression levels of (A) mature miR-16-5p, (B) miR-144-3p and (c) miR-99b-5p in each of the 15 siblings couples obtained by quantitative polymerase chain reaction. Average expression levels of (d) miR-16-5p, (E) miR-114-3p and (F) miR-99b-5p in individuals with dS and in control subjects. miR, microRNA; dS, down syndrome; c, healthy control.
is detectable in supernatant fractions and in a lesser extent also in NEFs (Fig. 1B). Overall, the above results indicate that the final NEF is specifically enriched with nanosized RNA-carriers, namely small EVs and HdLs.
NEF miRNA extraction and expression analysis. miRNAs
were subsequently extracted from NEF using commercial columns. First, Agilent miR microarray analysis aimed to search for NEF miRNA content and was performed on samples derived from 4 couples of siblings: 4 subjects with dS and their 4 correspondent healthy siblings. This allowed identifica-tion of the most abundant miRNAs in the NEF recognized at least by 3 probes and expressed in all the 8 subjects included in the analysis (Table SIII). consequently, the expression levels of the three most abundant miRNAs (hsa-miR-16-5p, hsa-miR-144-3p and hsa-miR-99b-5p) were further assessed in a larger cohort of dS and c by qPcR (15 couples of siblings; n=30).
As presented in Fig. 2A-c, the expression levels of these three miRNAs were very different among the couples of siblings considered and in general the results demonstrated an increased average expression trend in dS NEF with respect to C [miR‑16‑5p: Mean Relative Quantification (RQ) of DS: 29.5±13.3, mean RQ of C: 11.9±3.3, Fig. 2D; miR‑144‑3p: Mean RQ of DS 66.6±18.7, mean RQ of C: 49.5±14.3, Fig. 2E; miR‑99b‑5p: Mean RQ of DS: 42.0±15.8, mean RQ of C: 27.7±10.6 Fig. 2F].
Since hsa-miR-16-5p, hsa-miR-144-3p and hsa-miR-99b-5p have all been previously identified as exosome-associated miRNAs and, in certain cases, associated with distinct pathologies (49-52), although never associated with the dS phenotype previously, it was decided to statistically correlate the expression levels of the three miRNAs with the available quantitative clinical data of the participants (quantitative vari-ables, Table SIV) in order to have insight into their functional role in dS.
Correlation analysis of miRNA expression with clinical features of subjects with DS. In Table I the correlation matrix
computed on the quantitative variables obtained from the subjects with dS was reported (correlation test with P<0.05). Bubble chart analysis (Fig. 3A-E) was subsequently performed only on the significant associations, introducing a third dimension, the diameter of the bubble. This dimension was proportional to the categorical variable named ‘number of comorbidities’, obtained as described in Material and methods section and reported in Table SV for each subject. An inverse significant linear association between the clinical feature ‘development babbling’ expressed in months and miR-16-5p and miR-144-3p expression levels was evident (Fig. 3A and B). From the bubble charts it is clear that these two miRNAs demonstrated high expression levels in subjects with dS with high number of comorbidities and beginning to babble earlier.
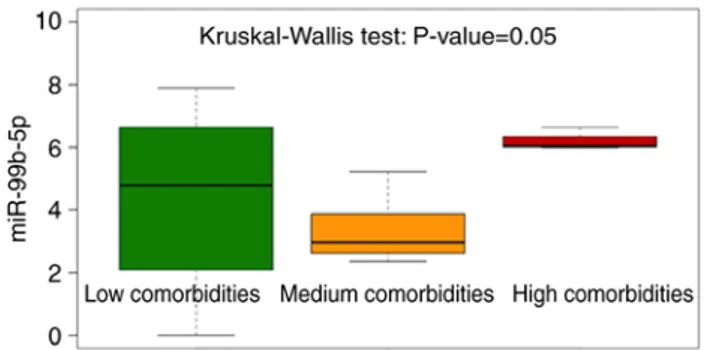
concerning miR-99b-5p, it was observed that the median value of the expression level was significantly increased (Kruskal test: P=0.05) in individuals with DS presenting high comorbidities (Fig. 4 and Table SII) suggesting a potentially more relevant role of miR-99b-5p upregulation in this subgroup of subjects with DS. Instead, no significant differences were identified for miR‑144‑3p and miR‑16‑5p (Table SII).
Table I. correlation matrix. Sphincter Mother Father Birth Sitting Babbling W alking control Variables age age weight (g) months months months months miR -16 -5p miR -144 -3p miR -99b -5p Mother age 1,0000 Father age 0,9197 1,0000 Birth weight (g) -0,0982 -0,1577 1,0000 Sitting months 0,2095 0,2532 -0,4586 1,0000 Babbling months 0,1798 -0,0132 -0,1090 -0,0157 1,0000 W alking months 0,3488 0,1835 0,2421 0,2210 0,1501 1,0000
Sphincter control months
0,2018 0,2531 -0,3816 0,7177 0,2275 0,5274 1,0000 miR -16 -5p -0,1994 -0,0205 -0,0940 -0,1439 -0,7441 -0,4159 -0,2803 1,0000 miR -144 -3p -0,1070 0,0451 -0,2181 0,1 122 ‑0,8070 -0,191 1 -0,0212 0,8383 1,0000 miR -99b -5p -0,1954 -0,0176 -0,2089 -0,1 102 -0,6024 -0,1794 -0,0208 0,8780 0,8516 1,0000
INTERNATIONAL JOURNAL OF MOLEcULAR MEdIcINE 43: 2303-2318, 2019 2309
Fig. 3c highlights a significant linear positive asso-ciation between miR16-5p and miR-144-3p expression. The same consideration can be extended to miR16-5p versus miR-99b-5p and miR144-3p versus miR-99b-5p, respectively (Fig. 3d and E). Furthermore, individuals with dS with the highest expression levels of miRNAs exhibited a high number of dS-associated typical clinical features. It is interesting to outline that when the same correlations were calculated by Pearson correlation analysis on the healthy siblings (on the basis of the descriptive statistics reported in Table SVI), we obtained low values of ρ (miR-16-5p vs. miR-144-3p: ρ=0.1895; miR‑16‑5p vs. miR-99b-5p: ρ=0.5123; miR‑144‑3p vs. miR-99b-5p: ρ=0.6820). This well agrees with the finding that the three selected miRNAs were upregulated in the dS cases in the present study, indicating a possible role in dS-associated typical clinical anomalies, probably mainly in subjects with ‘high comorbidities’. As expected, by repeating
the same analysis on all the 30 participants (DS+C), significant positive correlations were again obtained between miRNAs (Fig. 5A-c).
Figure 3. Bubble charts for the graphical representation of the significant association (ρ> |0.7|, P<0.05) between the quantitative variables. The bubble diameter is proportional to the variable Number of comorbidities: High number of comorbidities is represented with a red circle while few numbers of comorbidities with a green circle and the orange circles are a middle way. (A) Linear negative association between miR-16-5p expression levels and the clinical feature ‘develop-ment babbling’ expressed in months. (B) Linear negative association between miR-144-3p and the clinical feature ‘develop‘develop-ment babbling’ expressed in months. (c) Linear positive association between miR16-5p and miR-144-3p expression levels. (d) Linear positive association between miR16-5p and miR-99b-5p expression levels. (E) Linear positive association between miR144-3p and miR-99b-5p expression levels.
Figure 4. Box plot on miR-99b-5p expression level using like grouping vari-able classification based on the number of comorbidities (Low, Medium and High). The individuals with down syndrome bearing high comorbidities display the highest miR-99b-5p expression levels. miR, microRNA.
ρ was also computed on the expression level of each miRNA comparing couples of siblings (Fig. 5d-F). The only significant positive linear correlation was for miR-99b-5p (Fig. 5F). By computing ρ for couples of unrelated subjects (c subjects and subjects with dS were repeatedly randomized computing the correlation coefficients and corresponding test) it was noted that there was no correlation for miR-99b-5p (data and Figure provided upon request). This result demonstrates the same expression trend of miR-99b-5p among brothers, demonstrating the importance of the genetic background when analyzing miRs.
miRNA expression was visualized using heatmaps either on the entire sample (DS+C) (Fig. 6A), or separating C subjects and subjects with dS (Fig. 6B and c, respectively). The subjects with the highest miRNA expression (at the top three positions of the graph) belonged to the dS group. Furthermore, the c subjects at the top positions were siblings
of the dS with highest miRNA expression. Focusing the attention on heatmaps in Fig. 6B and c, it was evident that miRNA expression levels were different between dS and c (in dS the color key is red-shifted compared with c); among the subjects with dS there was only one case exhibiting very low miRNA expression and notably this subject also presented low comorbidities; the miRNAs less expressed were miR-144-3p and miR-99b-5p in dS and c, respectively.
Using the Partitioning Around Medoids algorithm (PAM) 2 clusters of subjects were identified (Fig. 7A): The first one, called C1, contained subjects with low median and mean expression values for each miRNA with a prevalence of c subjects (55% of individuals in C1 were c which corresponded to 73% of healthy siblings in the study, see Table SVII for major details). cluster 2, called C2, contained a number of subjects with dS with increased miRNA expression (60% of individuals in C2 were dS which corresponded to 40% of Figure 5. Scatter plots (with r and corresponding P‑value) computed on all subjects (DS+C) evidencing the significant linear positive association between the miRs expression levels: (A) miR-16-5p vs. miR144-3p, (B) miR-16-5p vs. miR-99b-5p and (c) miR-144-3p vs. miR-99b-5p expression. Scatter plot (with ρ and corresponding P-value) of each miR expression levels [(d) miR-16-5p; (E) miR-144-3p and (F) miR-99b-5p], measured on dS vs. their corresponding siblings, C. The unique significant positive linear correlation is for miR‑99b‑5p. miR, microRNA; DS, Down syndrome; C, healthy.
INTERNATIONAL JOURNAL OF MOLEcULAR MEdIcINE 43: 2303-2318, 2019 2311
subjects with down syndrome in the study). Furthermore, certain subjects with dS in C2 were classified together with
their siblings (dS10 and c10, dS12 and c12) confirming similar miRNA expression levels.
Figure 6. Heatmaps of the expression levels of miR‑16‑5p, miR‑144‑3p and miR‑99b‑5p. (A) Heatmaps on the entire sample DS+C, (B) on subjects with DS and (c) on healthy individuals. dS, down syndrome; c, healthy individuals.
From the PAM algorithm it was also clear that miRNA levels were able to generate clusters of subjects that were well classified. In fact, the ‘within dissimilarities’ was smaller than the ‘between dissimilarities’ and 73% of individuals were well classified, as presented in Fig. 7B, where 22 subjects on 30 analyzed (on y-axis) exhibited a width silhouette s(i) (on x-axis) higher than 0.4. Therefore, this representation confirmed the goodness of the classification induced by the miRNAs matrix (note that s(i) reaches its maximum in correspondence of 1). Furthermore, in Fig. 7B each subject with dS is colored using the classification based on number of comorbidities: In
C2 cluster, subjects with dS with high comorbidities prevailed. miRNAs gene target prediction and enrichment study. The main
putative targets of the 16 most abundant miRNAs identified in the NEFs (Table SIII) were subsequently predicted using the online software miRWalk (6). The analysis in the present study identi-fied 2,515 targeted genes, including 25 of the 536 genes located
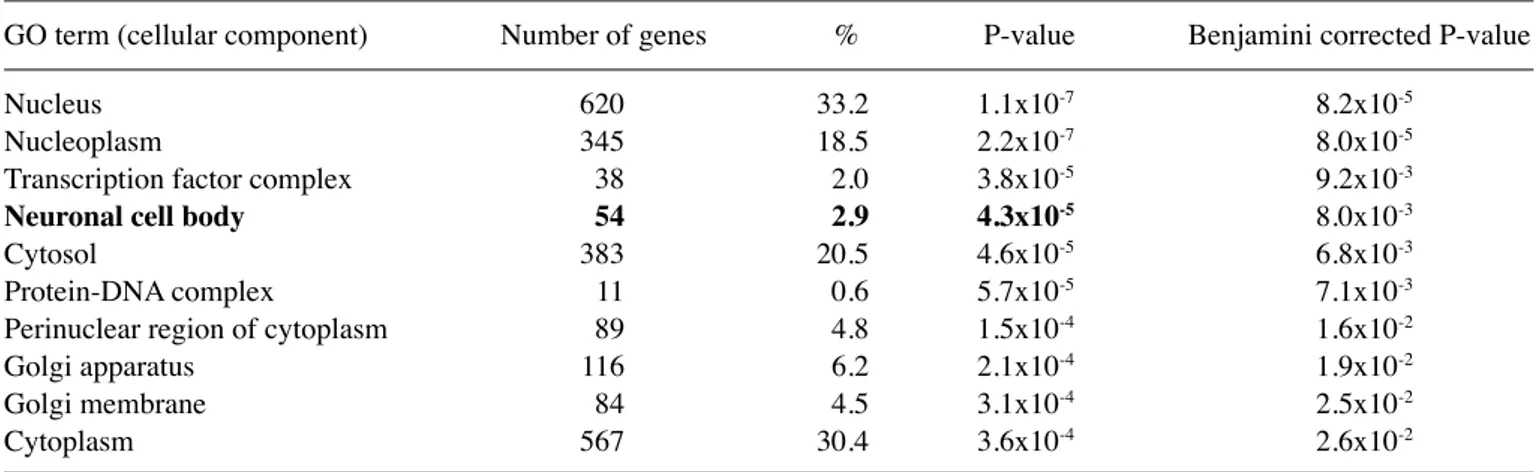
on Hsa21. Functional annotation analysis of the 2,515 genes was performed next. In a GO analysis conducted by dAVId (1,865 unique IDs identified), the candidate genes were analyzed in all categories including biological process (Table II), molecular function (Table III) and cellular component (Table IV). For the biological process category, the first 4 enriched terms were referred to the transcriptional process; the fifth biological term was ‘nervous system development’ with 53 predicted genes included in this term (P=0.0140). In the molecular function category, 1,010 genes were included in ‘protein binding’ term and the other enriched terms belonged essentially to ‘transcription process’ categories. In the cellular component category, the ‘nucleus’ was the predominant term with 620 associated-genes, the fourth term was ‘neuronal cell body’ with 54 genes (P=0.0080). Therefore, >50 candidate miRNAs target genes may have a role in ‘nervous system development’ or in the ‘neuronal cell body’ formation.
To characterize the predominant pathways, putative targets were searched by Kyoto Encyclopedia of Genes and Genomes
Figure 7. Partitioning around medoids algorithm based on miRs expression levels of dS and c, highlighting 2 well separated clusters [cluster 1(c1), subjects
indicated with circles and cluster 2, (c2), subjects indicated with triangles]. (A) Silhouettes computed for each subject in the analysis. The Id of each subject
is reported on the left side of the graph and the DS silhouettes are colored using the classification based on number of comorbidities. Cluster 1 (C1) contains
subjects with low median and mean expression values for each miR with a prevalence of c subjects. cluster 2 (c2) (comprising 60% of individuals with dS) with
INTERNATIONAL JOURNAL OF MOLEcULAR MEdIcINE 43: 2303-2318, 2019 2313
analysis, which revealed the term ‘chronic myeloid leukemia’ (P<<0.01) with 23 target genes among the top 10 signal path-ways (Table V). A disease association analysis of the predicted miRNA targets was also performed using Webgestalt demonstrating that terms as ‘leukemia T-cell’, ‘leukemia, myeloid, acute’, ‘chromosome aberration’, ‘Precursor T-cell Lymphoblastic Leukemia-Lymphoma’, ‘leukemia myeloid’ ‘secondary leukemia’ were among the top 10 statistically significant (Table VI). In this context, the predicted target genes of miR-16-5p, miR-99b-5p and miR-144-3p were reported together with their expression values in peripheral blood leucocytes from individuals with dS and controls (Table SVIII). Expression values were obtained from a publicly available transcriptome map resulted from integration of microarray datasets through TRAM (Transcriptome Mapper)
software previously (53). A total of 12 predicted target genes of miR‑16‑5p and 22 of miR‑144‑3p were identified to be differ-entially expressed in individuals with dS respect to controls (Ratio <0.8 and Ratio >1.2; in bold).
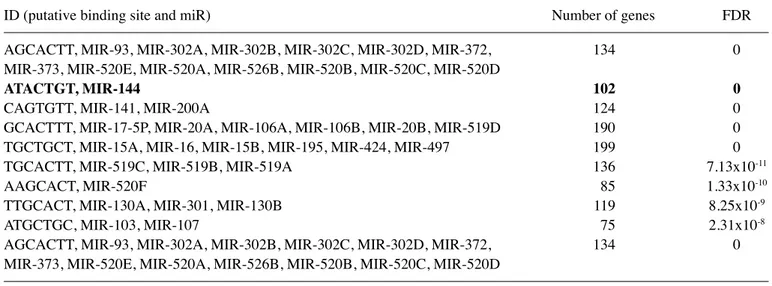
Furthermore, the miRNA enrichment analysis conducted by Webgestalt demonstrated that the major part (102 genes; P<<0.01) of the predicted miRNA target genes were targeted by miR-144-3p, which recognizes the binding site ATAcTGT (Table VII).
Among the predicted targets of miR-144-3p, two dS-associated genes, DYRK1A, encoding for dual‑specificity tyrosine-(Y)-phosphorylation regulated kinase 1a and SIM1, encoding for the transcriptional factor, have been respectively reported at the 2nd and 26th positions in the Malacard gene list. DYRK1A and SIM1 gene transcripts were predicted to be Table III. GO Top 10 significant terms belonging to ‘molecular function’ category.
Number Benjamini
GO term (molecular function) of genes % P-value corrected P-value
Protein binding 1,010 54.2 1.6x10⁻¹³ 2.4x10⁻¹⁰
Transcriptional activator activity. RNA polymerase II core 56 3.0 1.0x10⁻⁹ 7.5x10⁻⁷
promoter proximal region sequence‑specific binding
Transcription factor activity. sequence‑specific DNA binding 154 8.3 1.1x10⁻⁹ 5.2x10⁻⁷
Sequence‑specific DNA binding 88 4.7 5.1x10⁻⁷ 1.9x10⁻⁴
RNA polymerase II core promoter proximal region 66 3.5 6.9x10⁻⁷ 2.0x10⁻⁴
sequence‑specific DNA binding
Protein serine/threonine kinase activity 66 3.5 5.2x10⁻⁶ 1.3x10⁻³
RNA polymerase II regulatory region sequence‑specific 41 2.2 2.9x10⁻⁵ 6.0x10⁻³
dNA binding
GdP binding 17 0.9 4.2x10⁻⁵ 7.7x10⁻³
Zinc ion binding 157 8.4 4.7x10⁻⁵ 7.6x10⁻³
Transcriptional repressor activity. RNA polymerase II 26 1.4 6.6x10⁻⁵ 9.5x10⁻³
core promoter proximal region sequence‑specific binding
GO, Gene Ontology.
Table II. GO Top 10 significant terms belonging to the ‘biological process’ category.
Number Benjamini
GO term (biological process) of genes % P-value corrected P-value
Positive regulation of transcription. dNA-templated 102 5.5 1.40x10⁻¹¹ 6.80x10-08
Positive regulation of transcription from RNA polymerase II promoter 163 8.7 2.80x10⁻¹¹ 7.10x10-08 Negative regulation of transcription from RNA polymerase II promoter 126 6.8 2.50x10⁻¹⁰ 4.20x10-07
Transcription from RNA polymerase II promoter 96 5.1 1.40x10-09 1.70x10-06
Nervous system development 53 2.8 1.40x10‑05 1.40x10‑02
Protein phosphorylation 73 3.9 4.90x10-05 4.00x10-02
Steroid hormone mediated signaling pathway 17 0.9 9.30x10-05 6.40x10-02
dentate gyrus development 9 0.5 1.00x10-04 6.00x10-02
Stem cell differentiation 11 0.6 1.60x10-04 8.40x10-02
Transcription. dNA-templated 241 12.9 1.9x10⁻⁴ 9.1x10⁻²
targeted by miR-144-3p respectively by 8 and 6 prediction soft-ware programs (miRWalk). TargetScan (release 7.1, June 2016)
predicted 2 conserved putative binding sites for DYRK1A and 1 for SIM1 gene transcripts in the 3'UTR portions.
Discussion
The present study compares the expression of miRNAs carried by biogenic nanoparticles separated from plasma samples of young individuals with dS and their healthy siblings. This is the first study that tackles noncoding RNAs encased in EVs and HdLs in association with dS pathogenesis, demonstrating specific miRNA‑signatures (19). So far, only two studies have addressed an ‘exosome approach’ regarding this syndrome, although focusing on proteins rather than on miRNAs (54,55).
The adopted comprehensive approach of plasma NEF analysis was very informative since it allowed identifica-tion novel miRNAs probably involved in dS pathogenetic mechanisms. This approach represents a first breakthrough in respect to previous findings about miRNA and DS and sets the proof of concept for further study. It will be interesting to indicate a sharp stratification of EV and HDL miRNAs, provided the availability of sufficient starting media to perform the very challenging separation of the two nanopar-ticle populations.
Table VI. disease association of genes targeted by miRNAs. Number
disease association (Term) of genes FdR
cell transformation, neoplastic 56 7.02x10-04
Neoplastic processes 81 3.59x10-03
Leukemia, T‑cell 41 3.59x10‑03
Leukemia, myeloid, acute 45 3.59x10‑03
Neoplasms 123 3.64x10-03
Chromosome aberrations 64 4.38x10‑03
costello syndrome 9 5.93x10-03
Precursor T‑cell lymphoblastic 22 7.53x10‑03 leukemia‑lymphoma
Leukemia, myeloid 50 9.16x10‑03
Secondary leukemia 20 1.25x10‑02
Bold font indicates typical down syndrome features. FdR, false discovery rate.
Table V. Top 10 significant terms belonging to KEGG pathway.
KEGG pathway Number of genes % P-value Benjamini corrected P-value
Pathways in cancer 77 4.1 1.8x10⁻⁸ 5.0x10⁻⁶
FoxO signaling pathway 35 1.9 3.6x10⁻⁷ 5.0x10⁻⁵
Chronic myeloid leukemia 23 1.2 1.5x10‑6 1.4x10‑4
Glioma 21 1.1 4.1x10⁻⁶ 2.9x10⁻⁴
Pancreatic cancer 20 1.1 1.6x10⁻⁵ 9.1x10⁻⁴
Prostate cancer 24 1.3 1.7x10⁻⁵ 7.8x10⁻⁴
Long-term depression 19 1.0 1.8x10⁻⁵ 7.3x10⁻⁴
AMPK signaling pathway 28 1.5 8.0x10⁻⁵ 2.8x10⁻³
cGMP-PKG signaling pathway 34 1.8 1.3x10⁻⁴ 4.0x10⁻³
Signaling pathways regulating pluripotency of stem cells 30 1.6 1.5x10⁻⁴ 4.3x10⁻³
Bold font indicates typical down syndrome features. KEGG, Kyoto Encclopedia of genes and genomes.
Table IV. GO Top 10 significant terms belonging to ‘cellular component’ category.
GO term (cellular component) Number of genes % P-value Benjamini corrected P-value
Nucleus 620 33.2 1.1x10⁻⁷ 8.2x10⁻⁵
Nucleoplasm 345 18.5 2.2x10⁻⁷ 8.0x10⁻⁵
Transcription factor complex 38 2.0 3.8x10⁻⁵ 9.2x10⁻³
Neuronal cell body 54 2.9 4.3x10‑5 8.0x10⁻³
cytosol 383 20.5 4.6x10⁻⁵ 6.8x10⁻³
Protein-dNA complex 11 0.6 5.7x10⁻⁵ 7.1x10⁻³
Perinuclear region of cytoplasm 89 4.8 1.5x10⁻⁴ 1.6x10⁻²
Golgi apparatus 116 6.2 2.1x10⁻⁴ 1.9x10⁻²
Golgi membrane 84 4.5 3.1x10⁻⁴ 2.5x10⁻²
cytoplasm 567 30.4 3.6x10⁻⁴ 2.6x10⁻²
INTERNATIONAL JOURNAL OF MOLEcULAR MEdIcINE 43: 2303-2318, 2019 2315
Gene target prediction on the over-represented miRNAs identified during the initial discovery phase by microarray analysis and subsequent GO analysis of the predicted targets, suggested the possible involvement of the identified miRNAs in ‘nervous system development’, ‘neuronal cell body’ and in the pathogenesis of certain dS-associated diseases like leukemia. These are interesting results since the nervous system is remark-ably affected during development and aging in individuals with dS. Furthermore, it is well known that children with dS have a markedly increased risk for a subtype of myeloid leukemia (ML) (56) classified by the World Health Organization as ML-dS (Table VIII).
Expression profiling of the three most abundant miRNAs (miR-16-5p, miR-144-3p and miR-99b-5p) by RT-qPcR identi-fied a trend of dysregulation in individuals with DS compared with c.
The expression of these miRNAs has not been previously associated with dS and in general little data were published
regarding the expression of such miRNAs in human plasma. miR‑16‑5p was identified in circulating exosomes of patients with multiple myeloma (57) as well as in circulating serum exosomes of patients with esophageal adenocarcinoma (49). miR‑99b‑5p is known as one of five most common miRNA in human plasma exosomes by RNA deep sequencing (58).
concerning function, miR-16-5p was previously described in rat neurons as a negative regulator of dendritic complexity and mediates brain derived neurotrophic factor (BdNF)-induced dendritogenesis by regulating the translation of the BdNF mRNA itself, supporting the hypothesis that miR-16-5p may be important during neuronal development (59).
miR-144-3p has emerged as an important miRNA impli-cated in certain human cNS pathologies (60,61). In a mouse model, miR-144-3p targets a number of genes implicated in the control of neuronal plasticity-associated signaling cascades, including PTEN, Spred1 and Notch1 (62).
Among the predicted targets of miR-144-3p, two dS-associated genes, DYRK1A and the transcription factor
SIM1 were identified. While no experimental evidence about
miR-144-3p and both dS-genes expression regulation has previously been demonstrated, it is known that dYRK1A expression can be regulated by miRNAs (63,64).
dYRK1A kinase produced by Hsa21 serves a pivotal role in the cNS and its overexpression in individuals with dS may be implicated in cognitive impairments, therefore it has been suggested as a putative therapeutic target for treating the cognitive deficiencies observed in DS (58,65,66). Deregulation of dYRK1A levels are also frequently observed in Alzheimer and Parkinson diseases (67-69).
A recent study about the transcriptome map analysis of dS vs. control human tissues (6) has demonstrated that in the differential transcriptome map of brain, induced pluripotent stem cells, blood and fibroblasts of DS and controls samples dYRK1A gene has expression ratios of 1.51, 1.36, 1.30 and 1.37, respectively. These ratios are consistent with a possible dYRK1A gene expression alteration in trisomy 21 samples due to the presence of the Hsa21 in three copies in the cells of Table VII. miRNA enrichment analysis. Top 10 significant miRs targeting the gene list.
Id (putative binding site and miR) Number of genes FdR
AGcAcTT, MIR-93, MIR-302A, MIR-302B, MIR-302c, MIR-302d, MIR-372, 134 0
MIR-373, MIR-520E, MIR-520A, MIR-526B, MIR-520B, MIR-520c, MIR-520d
ATACTGT, MIR‑144 102 0
cAGTGTT, MIR-141, MIR-200A 124 0
GcAcTTT, MIR-17-5P, MIR-20A, MIR-106A, MIR-106B, MIR-20B, MIR-519d 190 0
TGcTGcT, MIR-15A, MIR-16, MIR-15B, MIR-195, MIR-424, MIR-497 199 0
TGcAcTT, MIR-519c, MIR-519B, MIR-519A 136 7.13x10⁻¹¹
AAGcAcT, MIR-520F 85 1.33x10⁻¹⁰
TTGcAcT, MIR-130A, MIR-301, MIR-130B 119 8.25x10⁻⁹
ATGcTGc, MIR-103, MIR-107 75 2.31x10⁻⁸
AGcAcTT, MIR-93, MIR-302A, MIR-302B, MIR-302c, MIR-302d, MIR-372, 134 0
MIR-373, MIR-520E, MIR-520A, MIR-526B, MIR-520B, MIR-520c, MIR-520d
Bold font indicates miRNA under study. FdR, false discovery rate; miR/miRNA, microRNA.
Table VIII. down syndrome-associated diseases according to Malacards.
Related disease Id Score
Leukemia, megakaryoblastic, with or without 12.0 down syndrome, somatic
Acute megakaryoblastic leukemia in down syndrome 12.0 Acute megakaryoblastic leukemia without 11.9 down syndrome Ayme-gripp syndrome 11.1 intellectual disability 10.4 Leukemia 10.4 Macroglossia 10.2 dementia 10.1 Myeloid leukemia 10.1 Neuronitis 10.1
subjects with dS. Furthermore, it is interesting to note that the SIM1 gene, which maps on human chromosome 6 is homolo-gous to SIM2 gene mapping on Hsa21. These two genes are homologs to Drosophila single-minded (sim) gene and have expression ratios in dS vs. control brain samples of 0.75 and 0.73 respectively. It was already proposed that the human SIM1 gene may be involved in the manifestation of brain development and cognitive disability of dS (70).
Therefore, it would be interesting to experimentally verify whether dYRK1A and SIM1 genes may be targeted by miR-144-3p in order to shed light on their post-transcriptional gene regulation. Notably, the amyloid precursor protein (APP) gene, one of the most recognized genes to be overexpressed in DS (6), was not identified among the targets of the investi-gated miRNAs, on the basis of the selection criteria. In future studies, it would be intriguing to study if APP overexpression could be mediated by circulating miRNAs, not enclosed in nanoparticles.
The correlation of the expression levels of the three identi-fied miRNAs with clinical features of the subjects with DS by a non‑parametric test like Kruskal Wallis allowed identifica-tion of an inverse significant linear associaidentifica-tion between the development of babbling (expressed in months) and miR-16-5p and miR-144-3p in subjects with dS, which also demonstrates a high number of comorbidities. Kruskal Wallis has been applied as the present study used a small sample size where the quantitative variables analyzed, in particular miRNAs, have extremely asymmetric distributions. On the basis of the results, it can be hypothesized that miR-16-5p and miR-144-3p may be involved in controlling the timing of the babbling devel-opment: Indeed the role of miRNAs has been suggested by previous studies about speech and language impairment (71).
By means of two exploratory statistical methods, namely heatmap and cluster analysis it was demonstrated that indi-viduals with dS expressing high levels of the three miRNAs displayed also a high number of dS-associated typical clinical features and allowed us to generate clusters of subjects well classified on the basis of the three miRNA expression data. cluster analysis is not frequently applied to biological data, but together with heatmaps, follows the visual mining philosophy. This is an interesting strategy for understanding association and patterns into the data, visualizing simple and understandable plots.
In conclusion, the results of the present study demonstrate the importance of the comprehensive analysis of plasma miRNA vehicles, enriching for different substructures, which may lead to the discovery of unknown pathways. In the case of dS, this approach could lead to the discovery of novel molec-ular entities (miRNA, proteins, metabolites) that are involved in the pathology but have never been identified earlier.
Acknowledgements Not applicable. Funding
The present study was partially supported by a BIOMANE grant (University of Brescia, Brescia, Italy) to AR, AS, GdP and PB. AR was also supported from Fondo per il
Finanziamento delle Attività Base di Ricerca (Ministero dell'Istruzione, dell'Università e della Ricerca) and University of Brescia research fund (ex 60%). This study was partially supported by centro Bresciano down (cBd), Brescia, Italy to AR and dR.
Availability of data and materials
The analyzed datasets generated during the study are available from the corresponding author on reasonable request.
Authors' contributions
AR and dR conceived the project. Mc, FA, AP, cL and Gc were involved in sample and medical record recruitment. AS, MV, AR wrote the manuscript. AR, LP, SB performed NEF separation and biophysical and biochemical characterization. AS, TF performed the qPcR experiments; AS, EA performed the GO analysis. GdP, GA and PB were involved in the study conception and design, analysis and interpretation of data, and critical revision of the manuscript. All authors read and approved the manuscript.
Ethics approval and consent to participate
The present study was approved by the competent Ethics committee of Sant'Orsola-Malpighi Hospital in Bologna, approval number: 39/2013/U/Tess.
Patient consent for publication
Informed consent was obtained from the subjects for participation in this study.
Competing interests
No potential conflict of interest was reported by the authors. References
1. Strippoli P, Pelleri Mc, caracausi M, Vitale L, Piovesan A, Locatelli c, Mimmi Mc, Berardi Ac, Ricotta d, Radeghieri A,
et al: An integrated route to identifying new pathogenesis-based
therapeutic approaches for trisomy 21 (down Syndrome) following the thought of Jérôme Lejeune. Sci Postprint 1: e00010, 2013.
2. delabar JM, Allinquant B, Bianchi d, Blumenthal T, dekker A, Edgin J, O'Bryan J, dierssen M, Potier Mc, Wiseman F, et al: Changing paradigms in down syndrome: The first international conference of the trisomy 21 research society. Mol Syndromol 7: 251-261, 2016.
3. Lejeune J, Gauthier M and Turpin R: Human chromosomes in tissue cultures. c R Hebd Seances Acad Sci 248: 602-603, 1959 (In French).
4. Chen YQ, Li T, Guo WY, Su FJ and Zhang YX: Identification of altered pathways in down syndrome-associated congenital heart defects using an individualized pathway aberrance score. Genet Mol Res 15: 2016.
5. Pelleri Mc, Gennari E, Locatelli c, Piovesan A, caracausi M, Antonaros F, Rocca A, donati cM, conti L, Strippoli P, et al: Genotype-phenotype correlation for congenital heart disease in down syndrome through analysis of partial trisomy 21 cases. Genomics 109: 391-400, 2017.
6. Pelleri Mc, cattani c, Vitale L, Antonaros F, Strippoli P, Locatelli c, cocchi G, Piovesan A and caracausi M: Integrated quantitative transcriptome maps of human trisomy 21 tissues and cells. Front Genet 9: 125, 2018.
INTERNATIONAL JOURNAL OF MOLEcULAR MEdIcINE 43: 2303-2318, 2019 2317
7. Pelleri Mc, cicchini E, Locatelli c, Vitale L, caracausi M, Piovesan A, Rocca A, Poletti G, Seri M, Strippoli P and cocchi G: Systematic reanalysis of partial trisomy 21 cases with or without down syndrome suggests a small region on 21q22.13 as critical to the phenotype. Hum Mol Genet 25: 2525-2538, 2016.
8. caracausi M, Ghini V, Locatelli c, Mericio M, Piovesan A, Antonaros F, Pelleri Mc, Vitale L, Vacca RA, Bedetti F, et al: Plasma and urinary metabolomic profiles of down syndrome correlate with alteration of mitochondrial metabolism. Sci Rep 8: 2977, 2018.
9. Ambros V: The functions of animal microRNAs. Nature 431: 350-355, 2004.
10. Bartel dP: MicroRNAs: Genomics, biogenesis, mechanism, and function. cell 116: 281-297, 2004.
11. Bartel dP: MicroRNAs: Target recognition and regulatory func-tions. cell 136: 215-233, 2009.
12. Turchinovich A, Weiz L, Langheinz A and Burwinkel B: characterization of extracellular circulating microRNA. Nucleic Acids Res 39: 7223-7233, 2011.
13. Arroyo Jd, chevillet JR, Kroh EM, Ruf IK, Pritchard cc, Gibson dF, Mitchell PS, Bennett cF, Pogosova-Agadjanyan EL, Stirewalt dL, et al: Argonaute2 complexes carry a popula-tion of circulating microRNAs independent of vesicles in human plasma. Proc Natl Acad Sci USA 108: 5003-5008, 2011. 14. Vickers Kc, Palmisano BT, Shoucri BM, Shamburek Rd and
Remaley AT: MicroRNAs are transported in plasma and deliv-ered to recipient cells by high-density lipoproteins. Nat cell Biol 13: 423-433, 2011.
15. Valadi H, Ekström K, Bossios A, Sjöstrand M, Lee JJ and Lötvall JO: Exosome-mediated transfer of mRNAs and microRNAs is a novel mechanism of genetic exchange between cells. Nat cell Biol 9: 654-659, 2007.
16. Michell dL and Vickers Kc: Lipoprotein carriers of microRNAs. Biochim Biophys Acta 1861: 2069-2074, 2016.
17. cheng L, Sharples RA, Scicluna BJ and Hill AF: Exosomes provide a protective and enriched source of miRNA for biomarker profiling compared to intracellular and cell-free blood. J Extracell Vesicles 3: 2014.
18. Mateescu B, Kowal EJ, van Balkom BW, Bartel S, Bhattacharyya SN, Buzás EI, Buck AH, de candia P, chow FW, das S, et al: Obstacles and opportunities in the functional analysis of extracellular vesicle RNA-an ISEV position paper. J Extracell Vesicles 6: 1286095, 2017.
19. Li K, Rodosthenous RS, Kashanchi F, Gingeras T, Gould SJ, Kuo LS, Kurre P, Lee H, Leonard JN, Liu H, et al: Advances, challenges, and opportunities in extracellular RNA biology: Insights from the NIH exRNA strategic workshop. JcI Insight 3: 98942, 2018.
20. Momen-Heravi F, Saha B, Kodys K, catalano d, Satishchandran A and Szabo G: Increased number of circulating exosomes and their microRNA cargos are potential novel biomarkers in alco-holic hepatitis. J Transl Med 13: 261, 2015.
21. Berardocco M, Radeghieri A, Busatto S, Gallorini M, Raggi c, Gissi c, d'Agnano I, Bergese P, Felsani A and Berardi Ac: RNA-seq reveals distinctive RNA profiles of small extracel-lular vesicles from different human liver cancer cell lines. Oncotarget 8: 82920-82939, 2017.
22. Svobodová I, Korabečná M, calda P, Břešťák M, Pazourková E, Pospíšilová Š, Krkavcová M, Novotná M and Hořínek A: differentially expressed miRNAs in trisomy 21 placentas. Prenat diagn 36: 775-784, 2016.
23. Xu Y, Li W, Liu X, chen H, Tan K, chen Y, Tu Z and dai Y: Identification of dysregulated microRNAs in lymphocytes from children with down syndrome. Gene 530: 278-286, 2013. 24. Alexandrov PN, Percy ME and Lukiw WJ: chromosome
21-encoded microRNAs (mRNAs): Impact on down's syndrome and trisomy-21 linked disease. cell Mol Neurobiol 38: 769-774, 2018.
25. Brás A, Rodrigues AS, Gomes B and Rueff J: down syndrome and microRNAs. Biomed Rep 8: 11-16, 2018.
26. Lim JH, Kim dJ, Lee dE, Han JY, chung JH, Ahn HK, Lee SW, Lim dH, Lee YS, Park SY and Ryu HM: Genome-wide microRNA expression profiling in placentas of fetuses with down syndrome. Placenta 36: 322-328, 2015.
27. Lacroix R, Judicone c, Mooberry M, Boucekine M, Key NS, dignat-George F and The ISTH SSc Workshop: Standardization of pre-analytical variables in plasma microparticle determi-nation: Results of the International Society on Thrombosis and Haemostasis SSc collaborative workshop. J Thromb Haemost 11: 1190-1193, 2013
28. Witwer KW, Buzás EI, Bemis LT, Bora A, Lässer c, Lötvall J, Nolte-'t Hoen EN, Piper MG, Sivaraman S, Skog J, et al: Standardization of sample collection, isolation and analysis methods in extracellular vesicle research. J Extracell Vesicles 2: 2013.
29. Paolini L, Di Noto G, Maffina F, Martellosio G, Radeghieri A, Luigi c and Ricotta d: comparison of Hevylite™ IgA and IgG assay with conventional techniques for the diagnosis and follow-up of plasma cell dyscrasia. Ann clin Biochem 52: 337-345, 2015. 30. Alvisi G, Roth dM, camozzi d, Pari GS, Loregian A, Ripalti A
and Jans DA: The flexible loop of the human cytomegalovirus DNA polymerase processivity factor ppUL44 is required for effi-cient dNA binding and replication in cells. J Virol 83: 9567-9576, 2009.
31. Alvisi G, Avanzi S, Musiani d, camozzi d, Leoni V, Ly-Huynh Jd and Ripalti A: Nuclear import of HSV-1 dNA polymerase proces-sivity factor UL42 is mediated by a c-terminally located bipartite nuclear localization signal. Biochemistry 47: 13764-13777, 2008. 32. Montis c, Zendrini A, Valle F, Busatto S, Paolini L, Radeghieri A, Salvatore A, Berti d and Bergese P: Size distribution of extracel-lular vesicles by optical correlation techniques. colloids Surf B Biointerfaces 158: 331-338, 2017.
33. Paolini L, Radeghieri A, civini S, caimi L and Ricotta d: The Epsilon Hinge-Ear region regulates membrane localization of the AP‑4 complex. Traffic 12: 1604‑1619, 2011.
34. Alvisi G, Paolini L, contarini A, Zambarda c, di Antonio V, colosini A, Mercandelli N, Timmoneri M, Palù G, caimi L, et al: Intersectin goes nuclear: Secret life of an endocytic protein. Biochem J 475: 1455-1472, 2018.
35. Paolini L, Orizio F, Busatto S, Radeghieri A, Bresciani R, Bergese P and Monti E: Exosomes secreted by HeLa cells shuttle on their surface the plasma membrane-associated sialidase NEU3. Biochemistry 56: 6401-6408, 2017.
36. Radeghieri A, Savio G, Zendrini A, di Noto G, Salvi A, Bergese P and Piovani G: cultured human amniocytes express hTERT, which is distributed between nucleus and cytoplasm and is secreted in extracellular vesicles. Biochem Biophys Res commun 483: 706-711, 2017.
37. Vescovi R, Monti M, Moratto d, Paolini L, consoli F, Benerini L, Melocchi L, calza S, chiudinelli M, Rossi G, et al: collapse of the plasmacytoid dendritic cell compartment in advanced cuta-neous melanomas by components of the tumor cell secretome. cancer Immunol Res 7: 12-28, 2019.
38. Livak KJ and Schmittgen Td: Analysis of relative gene expres-sion data using real-time quantitative PcR and the 2(-delta delta c(T)) method. Methods 25: 402-408, 2001.
39. Huang da W, Sherman BT and Lempicki RA: Systematic and integrative analysis of large gene lists using dAVId bioinfor-matics resources. Nat Protoc 4: 44-57, 2009.
40. Wang J, Vasaikar S, Shi Z, Greer M and Zhang B: WebGestalt 2017: A more comprehensive, powerful, flexible and interactive gene set enrichment analysis toolkit. Nucleic Acids Res 45: W130-W137, 2017.
41. Rappaport N, Twik M, Plaschkes I, Nudel R, Iny Stein T, Levitt J, Gershoni M, Morrey cP, Safran M and Lancet d: Malacards: An amalgamated human disease compendium with diverse clinical and genetic annotation and structured search. Nucleic Acids Res 45: d877-d887, 2017.
42. dweep H and Gretz N: miRWalk2.0: A comprehensive atlas of microRNA-target interactions. Nat Methods 12: 697, 2015. 43. Kaufman L and Rousseeuw PJ: clustering by means of medoids.
Statistical data Analysis Based on the L1 Norm. North-Holland/ Elsevier, Amsterdam, pp405-416, 1987.
44. Andreu Z, Rivas E, Sanguino-Pascual A, Lamana A, Marazuela M, González-Alvaro I, Sánchez-Madrid F, de la Fuente H and Yáñez-Mó M: comparative analysis of EV isolation procedures for miRNAs detection in serum samples. J Extracell Vesicles 5: 31655, 2016.
45. Paolini L, Zendrini A and Radeghieri A: Biophysical proper-ties of extracellular vesicles in diagnostics. Biomark Med 12: 383-391, 2018.
46. Paolini L, Zendrini A, di Noto G, Busatto S, Lottini E, Radeghieri A, dossi A, caneschi A, Ricotta d and Bergese P: Residual matrix from different separation techniques impacts exosome biological activity. Sci Rep 6: 23550, 2016.
47. Théry c, Witwer KW, Aikawa E, Alcaraz MJ, Anderson Jd, Andriantsitohaina R, Antoniou A, Arab T, Archer F, Atkin-Smith GK, et al: Minimal information for studies of extra-cellular vesicles 2018 (MISEV2018): A position statement of the international society for extracellular vesicles and update of the MISEV2014 guidelines. J Extracell Vesicles 7: 1535750, 2018.
48. Karimi N, cvjetkovic A, Jang Sc, crescitelli R, Hosseinpour Feizi MA, Nieuwland R, Lötvall J and Lässer c: detailed anal-ysis of the plasma extracellular vesicle proteome after separation from lipoproteins. cell Mol Life Sci 75: 2873-2886, 2018. 49. Huang X, Yuan T, Tschannen M, Sun Z, Jacob H, du M,
Liang M, dittmar RL, Liu Y, Liang M, et al: characterization of human plasma-derived exosomal RNAs by deep sequencing. BMc Genomics 14: 319, 2013.
50. Shurtleff MJ, Temoche-diaz MM, Karfilis KV, Ri S and Schekman R: Y-box protein 1 is required to sort microRNAs into exosomes in cells and in a cell-free reaction. Elife 5: e19276, 2016.
51. Pu C, Huang H, Wang Z, Zou W, Lv Y, Zhou Z, Zhang Q, Qiao L, Wu F and Shao S: Extracellular vesicle-associated mir-21 and mir-144 are markedly elevated in serum of patients with hepato-cellular carcinoma. Front Physiol 9: 930, 2018.
52. Garcia-contreras M, Shah SH, Tamayo A, Robbins Pd, Golberg RB, Mendez AJ and Ricordi c: Plasma-derived exosome characterization reveals a distinct microRNA signature in long duration Type 1 diabetes. Sci Rep 7: 5998, 2017.
53. Pelleri Mc, Piovesan A, caracausi M, Berardi Ac, Vitale L and Strippoli P: Integrated differential transcriptome maps of acute megakaryoblastic leukemia (AMKL) in children with or without down syndrome (dS). BMc Med Genomics 7: 63, 2014.
54. Hamlett Ed, Goetzl EJ, Ledreux A, Vasilevko V, Boger HA, LaRosa A, clark d, carroll SL, carmona-Iragui M, Fortea J, et al: Neuronal exosomes reveal Alzheimer's disease biomarkers in down syndrome. Alzheimers dement 13: 541-549, 2017.
55. Gauthier SA, Perez-Gonzalez R, Sharma A, Huang FK, Alldred MJ, Pawlik M, Kaur G, Ginsberg Sd, Neubert TA and Levy E: Enhanced exosome secretion in down syndrome brain-a protective mechanism to alleviate neuronal endosomal abnor-malities. Acta Neuropathol commun 5: 65, 2017.
56. Zhang L, Pan L, Xiang B, Zhu H, Wu Y, chen M, Guan P, Zou X, Valencia cA, dong B, et al: Potential role of exosome-associated microRNA panels and in vivo environment to predict drug resistance for patients with multiple myeloma. Oncotarget 7: 30876-30891, 2016.
57. chiam K, Wang T, Watson dI, Mayne Gc, Irvine TS, Bright T, Smith L, White IA, Bowen JM, Keefe d, et al: circulating serum exosomal miRNAs as potential biomarkers for esophageal adenocarcinoma. J Gastrointest Surg 19: 1208-1215, 2015. 58. Neumann F, Gourdain S, Albac c, dekker Ad, Bui Lc, dairou J,
Schmitz-Afonso I, Hue N, Rodrigues-Lima F, delabar JM, et al: dYRK1A inhibition and cognitive rescue in a down syndrome mouse model are induced by new fluoro‑DANDY derivatives. Sci Rep 8: 2859, 2018.
59. Antoniou A, Khudayberdiev S, Idziak A, Bicker S, Jacob R and Schratt G: The dynamic recruitment of TRBP to neuronal membranes mediates dendritogenesis during development. EMBO Rep 19: e44853, 2018.
60. Cheng C, Li W, Zhang Z, Yoshimura S, Hao Q, Zhang C and Wang Z: MicroRNA-144 is regulated by activator protein-1 (AP-1) and decreases expression of Alzheimer disease-related a disintegrin and metalloprotease 10 (AdAM10). J Biol chem 288: 13748-13761, 2013.
61. Katsuura S, Kuwano Y, Yamagishi N, Kurokawa K, Kajita K, Akaike Y, Nishida K, Masuda K, Tanahashi T and Rokutan K: MicroRNAs miR-144/144* and miR-16 in peripheral blood are potential biomarkers for naturalistic stress in healthy Japanese medical students. Neurosci Lett 516: 79-84, 2012.
62. Murphy cP, Li X, Maurer V, Oberhauser M, Gstir R, Wearick-Silva LE, Viola TW, Schafferer S, Grassi-Oliveira R, Whittle N, et al: MicroRNA-mediated rescue of fear extinc-tion memory by miR-144-3p in extincextinc-tion-impaired mice. Biol Psychiatry 81: 979-989, 2017.
63. Zhang Y, Liao JM, Zeng SX and Lu H: p53 downregulates down syndrome-associated dYRK1A through miR-1246. EMBO Rep 12: 811-817, 2011.
64. da costa Martins PA, Salic K, Gladka MM, Armand AS, Leptidis S, el Azzouzi H, Hansen A, coenen-de Roo cJ, Bierhuizen MF, van der Nagel R, et al: MicroRNA-199b targets the nuclear kinase dyrk1a in an auto-amplification loop promoting calcineurin/NFAT signalling. Nat cell Biol 12: 1220-1227, 2010.
65. Feki A and Hibaoui Y: dYRK1A protein, A promising thera-peutic target to improve cognitive deficits in down syndrome. Brain Sci 8: E187, 2018.
66. Najas S, Arranz J, Lochhead PA, Ashford AL, Oxley d, delabar JM, cook SJ, Barallobre MJ and Arbonés ML: dYRK1A-mediated cyclin d1 degradation in neural stem cells contributes to the neurogenic cortical defects in down syndrome. EBioMedicine 2: 120-134, 2015.
67. Arbones ML, Thomazeau A, Nakano-Kobayashi A, Hagiwara M and delabar JM: dYRK1A and cognition: A lifelong relation-ship. Pharmacol Ther 194: 199-221, 2019.
68. Janel N, Sarazin M, corlier F, corne H, de Souza Lc, Hamelin L, Aka A, Lagarde J, Blehaut H, Hindié V, et al: Plasma dYRK1A as a novel risk factor for Alzheimer's disease. Transl Psychiatry 4: e425, 2014.
69. Barallobre MJ, Perier c, Bove J, Laguna A, delabar JM, Vila M and Arbonés ML: dYRK1A promotes dopaminergic neuron survival in the developing brain and in a mouse model of Parkinson's disease. cell death dis 5: e1289, 2014.
70. chrast R, Scott HS, chen H, Kudoh J, Rossier c, Minoshima S, Wang Y, Shimizu N and Antonarakis SE: cloning of two human homologs of the drosophila single-minded gene SIM1 on chromosome 6q and SIM2 on 21q within the down syndrome chromosomal region. Genome Res 7: 615-624, 1997.
71. Fu L, Shi Z, Luo G, Tu W, Wang X, Fang Z and Li X: Multiple microRNAs regulate human FOXP2 gene expression by targeting sequences in its 3' untranslated region. Mol Brain 7: 71, 2014.
This work is licensed under a Creative Commons Attribution-NonCommercial-NoDerivatives 4.0 International (CC BY-NC-ND 4.0) License.