396 Int. J. Manufacturing Technology and Management, Vol. 14, Nos. 3/4, 2008
Improvement through process integration
using a simulative, dynamic method
Marco Mazzola*, Enzo Gentili
and Francesco Aggogeri
Department of Mechanical Engineering, University of Brescia,via Branze 38, 25123 Brescia, Italy
Fax: 00390303702448 E-mail: [email protected] E-mail: [email protected]
E-mail: [email protected] *Corresponding author
Abstract: The need for globalisation, the saturation and instability of markets,
the life-cycle time reduction of products, the growth of item variety, the customer demands have been main factors contributing to a radical change of management conceptions and strategies. This complex environment has induced companies to search the keys to achieve competitiveness, focusing on process integration. The purpose of the paper is to explain how managing the internal functions of a company in an integrated way can lead to an effective improvement. In order to represent the flows and to quantify improvements, a simulative, dynamic and integrated model is developed.
Keywords: process integration; continuous improvement; simulative method. Reference to this paper should be made as follows: Mazzola, M.,
Gentili, E. and Aggogeri, F. (2008) ‘Improvement through process integration using a simulative, dynamic method’, Int. J. Manufacturing Technology and
Management, Vol. 14, Nos. 3/4, pp.396–409.
Biographical notes: Marco Mazzola is part of the Technology and Production
Systems Research group at the University of Brescia. His research subjects are improvement of processes, implementation of improvement methodologies, integrated planning and production management.
Enzo Gentili is full Professor of Special Technologies at University of Brescia. He began his research in the field of metal plasticity (wire and tube drawing, deep drawing, forging, extrusion forging and the ring test). His research interests are the use of FEM in metal plasticity and metal cutting optimisation, total quality management, preventive and improving systems for quality control and safety management. He is author of several publications and editorial member of a number of journals.
Francesco Aggogeri is part of the Technology and Production Systems Research group at the University of Brescia. His research subjects are improvement of processes, implementation of improvement methodologies (Six Sigma, Lean Sigma and Scor) and quality control. He is a LeanSigma Expert.
Improvement through process integration 397
1 Introduction
The need for globalisation, the saturation and instability of markets, the life-cycle time reduction of products, the growth of item variety and customer demands have been the main factors that have contributed to a radical change of management conceptions and strategies. In the modern, complex environment, managing uncertainty is a very hard skill. This is reflected in companies that follow narrow paths in order to achieve flexibility and leanness. The only certainty for the company is the focus on the final customer. In a modern business conception, the customer is not the only one who could benefit from the output of companies, but, above all, he is the starting point on which the companies’ strategic decisions are based. In fact, the market has changed to a customer-driven one; in particular, demand has considerably decreased, becoming more and more unpredictable, while markets require higher and higher quality in products and services. So markets become highly conditioned by customers who require a great input in design and technology innovation and in customer service improvement from enterprises, along with a very astute evaluation of product prices (Koufteros et al., 2005; Liker, 2004; Ortiz et al., 1999; Volker and Wu, 2001).
As a consequence, companies are called to change their old paradigms and to search for the keys to achieve competitiveness and profits. The way to reach customer satisfaction, measured by service level indicators, is not univocal, and there is no specific methodological tool that can solve the problem by itself. Companies have to assimilate that the customer is the target and that his requirements (products, services or information) drive the processes, generating flows that involve a series of players, functions and activities, concurrent to the transformation and the movement of the required goods.
Companies have to develop a new philosophy, understanding that, at present, the principle by which the company had boundaries to defend has to be archived definitively (Badaracco, 1991). Leaving the conception that management is a closed engineering activity, they must focus on the process of organic coordination, interactivity and cross function aims. The flow coordination, first of all within the company requires managerial logics to be based on a ‘pull’ system, with a ‘lean’ organisation of flows. (Liker, 2004; Tan, 1998).
The topic that characterises this modern philosophy and that represents the first objective of this paper is ‘integration’: all functions and players involved in a common process have to share a common language in order to achieve customer satisfaction and, as a consequence, to increase company profits.
2 Process integration
This topic is frequently mentioned in an industrial environment as it is highly overworked and has wide and various meanings. It is not so easy to simplify, classify and resume various characteristics and meanings of integration; nevertheless, at every company level, between all interfaced players, between every related company function, integration provides to build a common language through which multiple players or disciplines can share activities and ensure a unified focus on process coordination improvement (Volker and Wu, 2001; Ahern et al., 2003).
398 M. Mazzola et al.
Generally, modern literature attempts to classify integration, by principally dividing it into internal or external. ‘Internal’ integration refers to the coordination between some interfaced company functions, while ‘external’ integration focuses on the cooperation and coordination between two or more different companies involved in a particular flow, linked by a supplier–customer relationship.
External integration is the base of the modern idea of a supply chain, in which a series of players are brought together in order to lean the flow that transforms raw materials into an ended product for customer satisfaction. Obviously, companies could coordinate their activities in a similar chain, only if every one has developed an internal philosophy about integration (Chopra and Meindl, 2001).
So, the challenging goal to achieve competitiveness through coordination in every complex market starts from business process integration. It means that all functions involved have to be managed together, in order to achieve customer needs in the most profitable way for the enterprise. Process integration spreads a common way of thinking and emphasises the importance of a goal widely understood in the company and shared at every step. Every part of the company contributes to the process improvement, focusing on the principle that managing the activities of one function alone can only produce suboptimal performances, because the overall goal of the company must come first (Blumenfeld et al., 1985; Dornier et al., 1998; Pyke and Cohen, 1994).
Process integration consists in facilitating the material and information decision and control flows throughout the organisation. It attempts to link functions with information, resources, applications and people, with the aim of improving communication, cooperation and coordination in the enterprise, so that the enterprise behaves as a whole and operates according to the strategy of the enterprise (Koufteros et al., 2005; Ortiz et al., 1999).
In order to effectively improve process flows by integration, every involved function has to be considered together and their trade-offs have to be evaluated. Once customer requirements are achieved and represented through an opportune indicator, strategic decisions must be taken into account looking to the company’s goal. This could be represented by a performance maximisation or, frequently, by a minimisation of a total enterprise cost function.
Costs and performances are characteristics of every function, and their own voices are often in conflict. Each part of a company is not an island in itself – any change in an integrated environment will probably affect at least one other group. To analyse trade-offs means to find the best (or near the best) solution from the performance or cost levels of the multiple combinations of functions (Dornier et al., 1998). It is important that the global function goal is optimised; even the function goal takes a second place. As Skinner suggested, the broad goal is not to obtain an aeroplane that flies at a supersonic speed, transports 500 people and lands easily on an aircraft-carrier too. Instead, the goal must be found through a combination of relevant characteristics in accordance with the company’s field.
These features lend themselves to the development of a model that can support these complex decisions, thus helping management to evaluate trade-offs.
Improvement through process integration 399
3 Integrated process modelling
An easy way to obtain a support for process improvement analysis and quantification is to create a model. Firstly, it is fundamental to understand that a model supports and does not replace the managerial decision-making process. By using a model, a company can establish current situations and then consider many different alternatives to test the outcome.
Every time the trade-offs are encountered during the process analysis, a model furnishes an essential support to the management experience and intuitions through reality abstraction.
In building a model, initially, the objective has to be clearly defined. Then, according to specific company devices, the model must be adapted to company features, including every process input and output and all resources involved in it. In this way, the model with the best methodology can be used, looking at process specifications, such as environment, decision process variables, main parameters, indicators, constraints and data distributions.
As modern literature proves, a great effort is needed in order to find the best tool for modelling a complex system. Looking at a wide taxonomy, the models for process integration analysis could be divided into many classes (Beamon, 1998; Sarmiento and Nagi, 1999; Vidal and Goetschalckx, 1997).
Only the management objective drives this choice, remembering that a model is only a tool in company hands and that it has to possess two characteristics for process integration support – it must represent information and product flows properly and its structure must be functional to statistical analysis.
4 Case study
The goal of this case study is to achieve global company improvement and optimisation across functions, without forgetting the need to increase the system solidity. According to a company’s interests, an optimisation based on minimisation of a total cost function is chosen, subject to main constraint represented by the service level to the customer.
Main functions involved in company flows are considered; everyone is characterised by particular managerial variable. The variable perturbations are reflected on a specific function performance indicator. Finally, for every function analysed, constraints, parameters and costs are defined.
4.1 Case study environment
The company chosen for analysis is involved in a grocery supply chain. It produces and distributes home and fabric care products across Europe. In this study, the company’s strategic decisions such as networks, structures, plant’s and warehouses’ location and routes are considered as already optimally defined. In fact, the interest is really focused on process integration and on function trade-off analysis.
400 M. Mazzola et al.
The company is structured as a two-level production–distribution system. It is characterised by a single plant with a central warehouse and by eight peripheral warehouses strategically located in Europe.
4.2 Case study modelling
As briefly described considering the environment and the goal of this work, a simulative, integrated, dynamic model is chosen. Firstly, through simulation, it is possible to describe in the best manner the company flows. In an environment characterised by high decision complexity, dynamism, wide product differentiation, in a system that needs reactivity, flexibility and visibility, simulation can help strategic and tactic decisions, furnishing a view of company flows and a base for successive analytical or statistical elaborations.
Secondly, simulative models guarantee freedom to try wide-ranging ideas and uncover system alternative configurations that might not have been possible to try using a real system (Kelton et al., 2004).
Every simulative work applied on a specific case study starts by considering the model that must be built ex novo. It is possible only to select the tools that seem to be the most appropriate for study purposes.
The basic software used in this work is Arena Software, widely used in industrial environments and easily available on the market. This tool is characterised by great application flexibility and by an easy implementation. It is able to support dynamic analysis, to test and to compare many alternatives, and to incorporate both deterministic and stochastic variables. Direct flow visibility and powerful interfacing with common applicative programs are two other important Arena features (Kelton et al., 2004).
In the following paragraphs, simulated functions are described as singular boxes, with every real and modelled features, variables, constraints and characteristics; however, how the model has been effectively created has not been included. Then all functions are considered and analysed together in order to understand and evaluate trade-offs, as an integrated process approach requires.
4.3 Customer order modelling
Before introducing the first main function, it is better to explain something about the orders and products modelling. The customers’ modelled demand comes from the company databases and is divided into two factors – a normal distributed function factor and a promotional or peak factor. Every order is expressed as the number of pallets that a customer requires from a specific peripheral warehouse. These represent two fundamental hypothesis on which the model is based.
According to the continuous replenishment theory and lean production philosophy, every time an order arrives to a peripheral warehouse, it is doubled – one is delayed by the processing time and sent to the plant and the other is sent, with a deadline of 12, 24 or 48 h divided by specific percentages, to the selling function. Order indicates item, family, destination, product quantity and production priority.
It is important to note that priority is given dynamically as a function of product availability to the system, refreshed at every simulated event.
Improvement through process integration 401 Products are divided firstly into families and then into several items, differentiated by fluid characteristics, bottle size, destination and packaging requirements. A total of 118 items are modelled.
4.4 Production function modelling
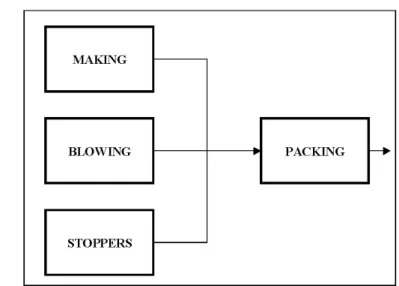
As outlined in the company product flows, the first function to be modelled is the production one. The plant includes four production areas, strictly connected together, as described in Figure 1.
Figure 1 Production areas
In the first area (called making), chemical fluid mixtures are made. In the blowing area, bottles as recipients for fluids are produced, while the third area (called stoppers) deals with the production of bottle stoppers. Inside the packing area, the end product is finally realised – empty bottles are filled, plugged and labelled. After these operations, the bottles are packed together. Since the stoppers and making areas do not present problems, owing to a very high production rate, they have not been considered in the model.
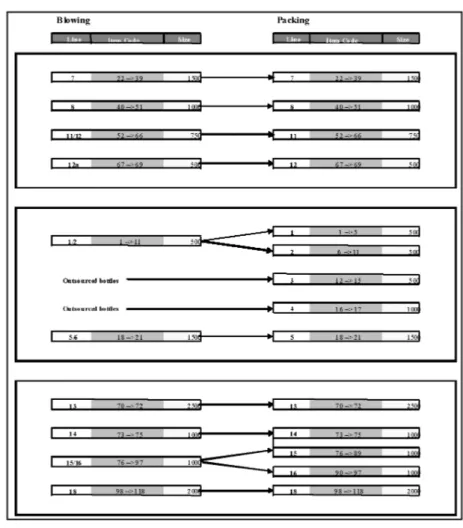
The blowing area has ten production lines, while the packing area has 14 lines. The simplified plant layout is represented in Figure 2, where line number, product code’s range and bottle size (ml) are quoted.
Every line has a specific production rate (bottle/min), and it is multiplied by a coefficient so as to consider the efficiency of these lines.
Job priority over a specific line is given dynamically by the ratio between product availability in the system and safety stocks stored in peripheral warehouses. Job priority determines job position along line queues, where items wait to be worked. Every event that causes a variation of product availability in the system requires a review of all jobs priorities.
402 M. Mazzola et al.
Figure 2 Modelled plant layout
In order to complete production modelling, fixed and variable delays are simulated. Set-ups occurred every time different families have to be produced on the same production line. Set -up times are simulated as uniformly distributed.
Transfer times between lines and from lines to central storage are considered as fixed values, while failures downtime and uptime are uniformly distributed. The model considers both occasional failures and productive maintenance.
The decision variable chosen for production function representation and for consequent trade-off analysis is the number of workforces employed in the areas. Every line requires a fixed number of employees for its operation, set-up and maintenance.
Obviously, in order to work all the lines contemporarily, the total number of employees is not enough. Therefore, the workforce variation influences directly the performance variable of the production lead time (time elapsed between order enters the system and arrives to central warehouse) and the workforce cost factor.
Improvement through process integration 403
4.5 Transportation function modelling
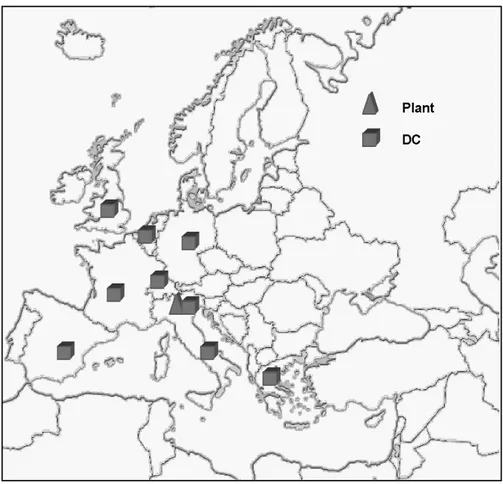
Once items are produced and packaged, they arrive in the plant’s central warehouse where docks are simulated as simple queues, driven again by priority. Nine European warehouses are considered, strategically located near main markets, as in Figure 3. The central warehouse receives orders from customers, so it is considered as a peripheral too.
The simulated transportation network is very simple. Routes directly connect the central warehouse with a peripheral one, so a one-way network is configured. According to the company transportation features, the model considers as a hypothesis, distances, transport charge capacity and fleet.
Delays for charge loading and unloading are considered fixed, while travel times are uniformly distributed.
A decision variable that marks the transportation function is delivery frequency expressed as the number of planned shipments per day. This variable is strictly connected to vehicle saturation – higher delivery frequency means lower vehicle saturation.
The performance function indicator, related to these variables, is delivery delay, i.e., the time elapsed between loading and unloading operations.
Figure 3 Modelled transportation network
404 M. Mazzola et al.
4.6 Storage function modelling
In this integrated model, the last function is represented by peripheral warehouse stocks management. In order to meet customer requirements, every item must be available on the warehouse shelves, according to the particular service level chosen by the company. In particular, this case study considers satisfying at least 99.5% of customer orders as a service-level constraint. Obviously, a high service level is reflected in product stocks. In particular, it is possible to estimate safety stock indicative quantity related to lead times and demand level, using the company’s logics.
Safety stocks level for every product code is introduced in the model as a decision variable, and its perturbation directly influences both medium inventory level and stockout number. Stock holding cost and stockout cost are both considered.
4.7 Integrated approach
Different functions are involved in the company’s organisation to obtain a common strategy and global shared objectives. The difficulty is to consider simultaneously many factors and parameters that are frequently in conflict.
There are three company functions analysed and modelled – production, transportation and stocks management. The objective of this paper is to evaluate trade-offs between these functions and to reach a near-to-best solution following an integrated approach. Principally, measurements and results will be based on total cost function.
A simulative, integrated and dynamic model suggests what, when and how much the company has to produce and store, and when, where, what and how much the company has to transport, according to the chosen service level. Later analysis would like to confirm how a function-limited decision systematically influences the others.
For example, if a company decides to increase production lead time employing a smaller workforce, this choice reflects on transportation and stock management functions. As a consequence, management could maintain the same service level by increasing transportation frequency or by increasing stock levels, or by a combination of both.
5 Simulation results
Simulation features agree with the company’s main requirements. A three shift, 24-hour working day and a six-month planning and analysis horizon are considered. Twelve replications for every simulated environment guarantee results and statistical accuracy; first and twelfth replications are discarded, thus eliminating transitory effects from system analysis.
By maintaining variables and parameters with the actual values, base case is first simulated.
Looking at obtained cost and performance statistics and comparing them with real furnished company data, a model can be successfully validated. In fact, it is able to photograph and to reproduce system flows, with a 1% error measured on the total cost function, as the graph in Figure 4.
Improvement through process integration 405 Figure 4 Real and base case simulated
6 Perturbations
Once the model has been validated, it is possible to play ‘what if’ games with it. Service level has to be considered as fixed and decision measure is the total cost function value. So, the analysis area is limited.
6.1 Variable perturbation
First, the analysis is conduced using perturbing decision variables previously modelled. There are an infinite number of decision variable combinations; so, for a simplified but useful study, grouped variables are considered. In this way, the model has to be able to test three sets of variables – workforce, delivery frequency and safety stock level. For a statistically correct approach, every variable set can vary between five levels, (+2, +1, 0, –1, and –2, respectively). Level ‘+’ increases variables (one unit for workforce, half a day for delivery frequency, and 20% for safety stock medium level), while level ‘–’ decreases them.
An integrated approach for analysis is chosen and every possible system configuration is considered. Using a fully factorial experimental design supported by analysis of variance, 53 = 125 experiments are simulated. Then, through the implemented
model, four system configurations are noted; every configuration respects the service-level fixed value and leads to a six-month total cost value less than that found in the base case.
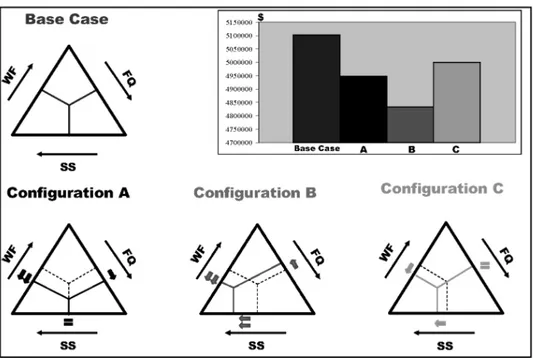
Besides the base case configuration, configuration A (–2 workforce, +1 delivery frequency, 0 SS level), configuration B (–2 workforce, –1 delivery frequency, +2 SS level) and configuration C (–1 workforce, 0 delivery frequency, +1 SS level) were chosen.
Looking at the total cost minimisation under a service level constraint, the analysis suggests how configuration B optimises an integrated system. In fact, this configuration guarantees a saving of 5.2% in respect to simulated base case total cost (Figure 5).
406 M. Mazzola et al.
Figure 5 Decision variable perturbation: chosen configurations and results
These operations almost give a near-to-optimum solution, but they do not consider fundamental influences given by variation of exogenous parameters. In a correct, integrated approach, these elements cannot be excluded; managing integrated processes by only looking at an optimisation of total cost function leads to an optimal solution but causes the system to be very frail against market factors perturbation.
6.2 Parameter perturbation
During model creation, exogenous parameters were implemented. Output variables like lead times or stockout quantities depend on many of these factors. Production lead time cannot be separated from demand entity or by failures down- and uptimes; delivery delay is strictly connected to transportation lead time as safety stocks to demand variance.
Every exogenous parameter was modelled using a particular distribution that is recommended for modelling uncertainty.
A second series of tests focused upon parameter perturbation of four previously selected configurations. The study would like to find a final solution matching optimisation with a solidity objective.
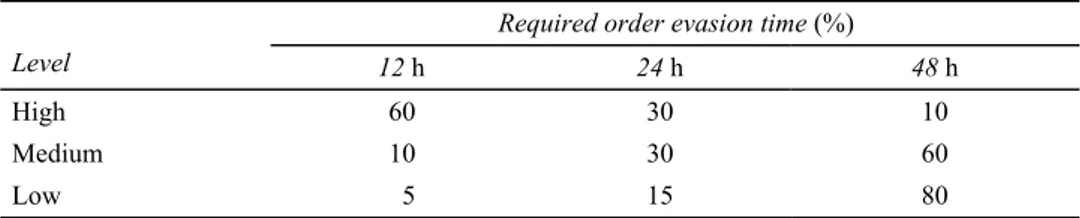
Three representative parameters were chosen – demand main level, demand standard deviation and customer required order evasion time. According to the historical data analysis and company management experience, demand level varies between ±5%; in the same way, demand standard deviation varies between ±20%, while customer required order evasion times are expressed in percentages and are shown in Table 1.
Improvement through process integration 407 Table 1 Customer required order evasion levels
Required order evasion time (%)
Level 12 h 24 h 48 h
High 60 30 10
Medium 10 30 60
Low 5 15 80
Every parameter varies between three levels. For every chosen configuration, the study involved 33 = 27 simulated experiments.
As a final result, the analysis shows how Configuration C better matches the company’s main objectives. In fact, it guarantees a saving of 2% in respect to simulated base case, and it seems very steady against exogenous parameter perturbation. The graph in Figure 6 shows the final results, where configuration C is evaluated looking at the notable concentration of total cost values during tests.
Figure 6 Final results
7 Conclusions
In order to analyse integrated processes, a case study is presented and explained. A real example helps towards a better understanding of the complexity and the importance of an integrated industrial approach.
The company involved has been divided into its main functions – production, transportation and stock management. Analysis has evaluated trade-offs between these functions, using some specific variables to represent them.
408 M. Mazzola et al.
As a result, a dynamic, integrated, simulative model has been built as a tool for a study.
Two main goals have been reached. Firstly, the model has been successfully validated, so it can correctly represent the company’s flows; secondly, the model with its features appears to be a flexible and powerful tool, useful to conduce rigorous statistical analysis.
‘What if’ games have been played, by perturbing implemented variables and parameters. Based on a full factorial experimental environment, perturbations give the possibility to consider a wide series of system-possible configurations.
Theories about process integration have been confirmed. In fact, by using the model, it has been possible to manage functions, obtaining both savings and system solidity. This paper shows not only an optimisation case study, but also explains how an integrated vision conduces a better performance against better uncertainty management and gives economic advantages, according to company objectives.
The statistical analysis conducted gives a preference for a particular system configuration (called configuration C). With respect to a simulated real case, this configuration is characterised by a smaller workforce employment and by a greater safety stock medium level. It guarantees a 2% savings and an acceptable system solidity.
For future studies, the model could be implemented in a wide range of companies that operate in the grocery market or other industrial fields characterised by functions trade-offs.
Finally, by analysing different variables or parameters already implemented, or by considering other levels, it is possible to play other ‘what if’ games with the model and then to consider other system configurations.
Acknowledgements
The authors wish to acknowledge the generous support offered by MIUR in the realisation of this work. Special thanks to Mrs. Mary Flynn who checked the manuscript.
References
Ahern, D.M., Clouse, A. and Turner, R. (2003) CMMI Distilled: A Practical Introduction to
Integrated Process Improvement, Addison-Wesley ed., Boston (MA).
Badaracco, J. (1991) The Knowledge Link: How Firms Compete Through Strategic Alliances, Harvard Business School Press, Boston (MA)
Beamon, B. (1998) ‘Supply chain design and analysis: models and methods’, International Journal
of Production Economics, Vol. 55, No. 3, pp.281–294.
Blumenfeld, D., Burns, L., Diltz, D. and Daganzo, C. (1985) ‘Analysis trade-offs between transportation, inventory and production costs on freight networks’, Transportation Research
Part B, Vol. 19, No. 5, pp.361–380.
Chopra, S. and Meindl, P. (2001) Supply Chain Management: strategy, planning and operations, Prentice Hall ed., New York (NY).
Dornier, P., Ernst, R., Fender, M. and Kouvelis, P. (1998) Global Operations and Logistics:
Improvement through process integration 409 Kelton, D., Sadowski, R. and Sturrock, D. (2004) Simulation with Arena, McGraw-Hill ed.,
New York (NY).
Koufteros, X., Vonderembse, M. and Jayaram, J. (2005) ‘Internal and external integration for product development: the contingency effects of uncertainty, equivocality, and platform strategy’, Decision Sciences, Vol. 36, No. 1, pp.97–133.
Liker, J.K. (2004) The Toyota Way: 14 Management Principles from the World’s Greatest
Manufacturer, McGraw-Hill ed., New York (NY).
Ortiz, A., Lario, F. and Ros, L. (1999) ‘Enterprise integration – business processes integrated management: a proposal for a methodology to develop enterprise integration program’,
Computers in Industry, Vol. 40, Nos. 2–3, pp.155–171.
Pyke, D. and Cohen, M. (1994) ‘Multiproduct integrated production-distribution systems’,
European Journal of Operational Research, Vol. 74, No. 1, pp.18–49.
Sarmiento, A.M. and Nagi, R. (1999) ‘A review of integrated analysis of production – distribution systems’, IIE Transactions, Vol. 31, No. 11, pp.1061–1074.
Tan, B. (1998) ‘Agile manufacturing and management of variability’, Int. Trans. Opl. Res., Vol. 5, No. 5, pp.375–388.
Vidal, C. and Goetschalckx, M. (1997) ‘Strategic production-distribution models: a critical review with emphasis on global supply chain models’, European Journal of Operations
Research, Vol. 98, No.1, pp.1–18.
Volker, H. and Wu, B. (2001) ‘Process improvement/reengineering integrated in an organisation’s management system’, Proceedings of the Twelfth Annual Conference of the Production and