DOI 10.1140/epjc/s10052-017-4943-1
Regular Article - Experimental Physics
Production of !(1385)
±
and "(1530)
0
in p–Pb collisions
at √s
NN
= 5.02 TeV
ALICE Collaboration⋆
CERN, 1211 Geneva 23, Switzerland
Received: 15 February 2017 / Accepted: 24 May 2017
© CERN for the benefit of the ALICE collaboration 2017. This article is an open access publication
Abstract The transverse momentum distributions of the
strange and double-strange hyperon resonances ("(1385)±,
#(1530)0) produced in p–Pb collisions at √s
NN = 5.02
TeV were measured in the rapidity range−0.5 < yCMS<0
for event classes corresponding to different charged-particle
multiplicity densities, ⟨dNch/dηlab⟩. The mean transverse
momentum values are presented as a function of⟨dNch/dηlab⟩,
as well as a function of the particle masses and compared with previous results on hyperon production. The integrated yield ratios of excited to ground-state hyperons are constant
as a function of⟨dNch/dηlab⟩. The equivalent ratios to pions
exhibit an increase with ⟨dNch/dηlab⟩, depending on their
strangeness content.
1 Introduction
Hadrons containing one or more strange quarks have been studied extensively over past decades in connection with the
study of quark-gluon plasma [1,2]. Enhanced hyperon yields
were observed in heavy-ion collisions with respect to those measured in proton-proton (pp) collisions at the same
centre-of-mass energy [3–6]. These enhancements were found to
be consistent with those expected from thermal statistical
model calculations using a grand canonical ensemble [7]. The
canonical [8,9] approach is suggested to explain the relatively
suppressed multi-strange baryon yields in smaller collision systems such as pp, proton-nucleus (p–Pb) and peripheral
heavy-ion collisions [10].
Short-lived resonances, such as K∗0and "(1385)±, can
be used in heavy-ion collisions to study the hadronic medium
between chemical and kinetic freeze-out [11]. Chemical and
kinetic freeze-out define the points in time, respectively, when hadron abundances and the momenta of particles stop changing. Decay products of resonances are subject to re-scattering processes and emerge after kinetic decoupling with little memory of the source. Regeneration processes,
con-versely, increase the resonance yield [12]. If re-scattering
⋆e-mail:[email protected]
processes are dominant over regeneration processes, the mea-sured yield of resonances is expected to be reduced. More-over, the longer the time between chemical and kinetic freeze-out, the greater the expected reduction.
Recently, the ALICE collaboration reported results on
K∗0, φ, #−and &−in pp and p–Pb collisions [10,13,14] in
addition to Pb–Pb data [6,15]. The evolution of the mean
transverse momenta (⟨pT⟩) of mesons and multi-strange
baryons were presented as a function of charged-particle multiplicity and particle mass. The observed decrease of the
resonance to ground-state ratio K∗0/K−has been suggested
as an indication of re-scattering processes in the hadronic
medium, as first observed in Pb–Pb collisions [15].
This paper reports on the hyperon resonances "(1385)±
(cτ = 5.48 fm, uus or dds [16]) and #(1530)0(cτ = 22 fm,
uss [16]), measured in p–Pb collisions at √sNN = 5.02
TeV. The corresponding results for pp collisions have been
previously published in [17]. The results presented in this
paper complement the p–Pb results given in [10,14]. The
measured pTspectra, yields and mean transverse momenta
are presented for different multiplicity classes. Yield ratios of excited to ground-state hyperons are studied as a func-tion of event multiplicity and compared with model
pre-dictions [7,18–20]. Considering the similar lifetimes of
"(1385)± and K∗0, a decrease of the "(1385)±/(ratio,
consistent with the decrease observed for the K∗0/K−ratio, is
expected for increasing system sizes. Hyperon to pion ratios are also presented and compared to the results for ground-state hyperons with the same strangeness contents.
In this paper, the short notations "∗±and #∗0are adopted
for "(1385)±and #(1530)0. Moreover, the notations "∗±
and #∗0 include the respective anti-particles, namely "∗±
includes "∗+, "∗−, and their anti-particles, while #∗0means
#∗0and #∗0, unless otherwise indicated.
2 Experimental setup and event selection
A description of the ALICE detector and of its performance
Table 1 Mean charged-particle multiplicity densities (⟨dNch/dηlab⟩) measured at midrapidity (|ηlab| < 0.5) [23], corresponding to the mul-tiplicity classes defined using the V0A detector [25] in p–Pb collisions at √sNN= 5.02 TeV
V0A percentile (%) ⟨dNch/dηlab⟩
0–20 35.6± 0.8 20–40 23.2± 0.5 20–60 19.7± 0.5 40–60 16.1± 0.4 60–100 7.1± 0.2 0–100 17.4± 0.7
22]. The data sample analysed in this paper was recorded
during the LHC p–Pb run at √sNN = 5.02 TeV in 2013.
Due to the asymmetric energies of the proton (4 TeV) and lead ion (1.57 A TeV) beams, the centre-of-mass system in
the nucleon-nucleon frame is shifted in rapidity by )yNN=
0.465 towards the direction of the proton beam with respect
to the laboratory frame of the ALICE detector [14]. For the
analysed p–Pb data set, the direction of the proton beam was towards the ALICE muon spectrometer, the so-called “C” side, standing for negative rapidities; conversely, the Pb beam circulated towards positive rapidities, labelled as “A” side in the following. The analysis in this paper was carried out at
midrapidity, in the rapidity window−0.5 < yCMS<0.
The minimum-bias trigger during the p–Pb run was con-figured to select events by requiring a logical OR of signals
in V0A and V0C [22], two arrays of 32 scintillator
detec-tors covering the full azimuthal angle in the pseudorapidity
regions 2.8 < ηlab<5.1 and−3.7 < ηlab<−1.7,
respec-tively [23]. In the data analysis it was required to have a
coincidence of signals in both V0A and V0C in order to reduce the contamination from single-diffractive and elec-tromagnetic interactions. This left only non-single diffrac-tive (NSD) events, which amount for a total of 100 million events, in the minimum-bias (MB) sample corresponding to
an integrated luminosity of about 50 µb−1.
The combined V0A and V0C information discriminates beam-beam interactions from background collisions in the interaction region. Further background suppression was applied in the offline analysis using time information from
two neutron zero degree calorimeters (ZDC) [22], as in
pre-vious p–Pb analyses [24]. Pile-up events due to more than
one collision in the region of beam interaction were excluded by using the silicon pixel detector (SPD) in the inner tracking
system (ITS) [22]. The primary vertex (PV) is determined by
tracks reconstructed in the ITS and time projection chamber
(TPC), and track segments in the SPD [22,23]. MB events
are selected when the PV is positioned along the beam axis
within±10 cm from the centre of the ALICE detector.
The MB events were divided into several multiplicity classes according to the accumulated charge in the forward
V0A detector [25]. The "∗±resonances are reconstructed in
the multiplicity classes 0–20, 20–60, and 60–100%, whereas
the #∗0analysis is carried out in four classes, namely 0–20,
20–40, 40–60 and 60–100%. To each multiplicity class
corre-sponds a mean charged-particle multiplicity (⟨dNch/dηlab⟩),
measured at midrapidity (|ηlab| < 0.5), as shown in Table1.
3 Data analysis
3.1 Track and topological selections
Table 2 summarizes the relevant information on the
mea-sured hyperon resonances, namely the decay modes used in
this analysis and their branching ratios. In the case of "∗±,
all states "∗+, "∗−, "∗− and "∗+ were separately
anal-ysed, while the #∗0 analysis always includes the
charge-conjugated anti-particle, #∗0due to the limited statistics of
the dataset.
In comparison with the "∗±and #∗0analysis carried out
in pp collisions at √s = 7 TeV [17], track and topological
selections were revised and adapted to the p–Pb dataset; this
is notably the case for #∗0. Pions from strong decays of both
"∗±and #∗0were selected according to the criteria for
pri-mary tracks. As summarized in Table3, all charged tracks
were selected with pT>0.15 GeV/c and|ηlab| < 0.8, as
described in Ref. [22]. The primary tracks were chosen with
the distance of closest approach (DCA) to PV of less than 2
cm along the longitudinal direction (DCAz) and lower than
7σr in the transverse plane (DCAr), where σr is the
resolu-tion of DCAr. The σr is strongly pT-dependent and lower
than 100 µm for pT >0.5 GeV/c [22]. To ensure a good
track reconstruction quality, candidate tracks were required to have at least one hit in one of the two innermost layers
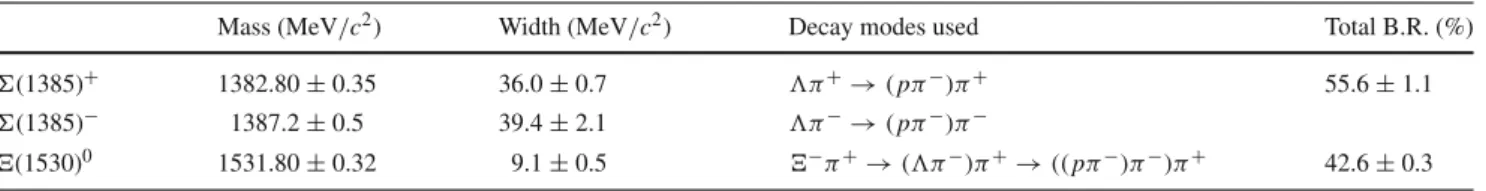
Table 2 Properties of the measured resonances and decay modes used in this analysis with total branching ratios [16], obtained as the products of respective branching ratios of daughter particles
Mass (MeV/c2) Width (MeV/c2) Decay modes used Total B.R. (%)
"(1385)+ 1382.80± 0.35 36.0± 0.7 (π+→ (pπ−)π+ 55.6± 1.1
"(1385)− 1387.2± 0.5 39.4± 2.1 (π−→ (pπ−)π−
Table 3 Track selections
common to all decay daughters and primary track selections applied to the charged pions from decays of "∗±and #∗0
Common track selections |ηlab| <0.8
pT >0.15 GeV/c
PID|(dE/dx)−(dE/dx)exp| <3 σTPC
Primary track selections DCAzto PV <2 cm
DCArto PV <7 σr( pT)
number of SPD points ≥1
number of TPC points >70
Table 4 Topological and track
selection criteria "∗± #∗0
DCArof ( decay products to PV >0.05 cm >0.06 cm DCA between ( decay products <1.6 cm <1.4 cm
DCA of ( to PV <0.3 cm >0.015 cm
cosθ( >0.99 >0.875
r(() 1.4 < r(() < 100 cm 0.2 < r(() < 100 cm
|Mpπ− m(| <10 MeV/c2 <7 MeV/c2
DCArof pion (from #−) to PV >0.015 cm
DCA between #−decay products <1.9 cm
cosθ# >0.981
r(#−) 0.2 < r(#−) <100 cm
|M(π− m#| <7 MeV/c2
(SPD) of the ITS and to have at least 70 reconstructed points in the TPC, out of a maximum of 159. The particle identifi-cation (PID) criteria for all decay daughters are based on the requirement that the specific energy loss (dE/dx) is measured
in the TPC within three standard deviations (σTPC) from the
expected value (dE/dxexp), computed using a Bethe–Bloch
parametrization [22].
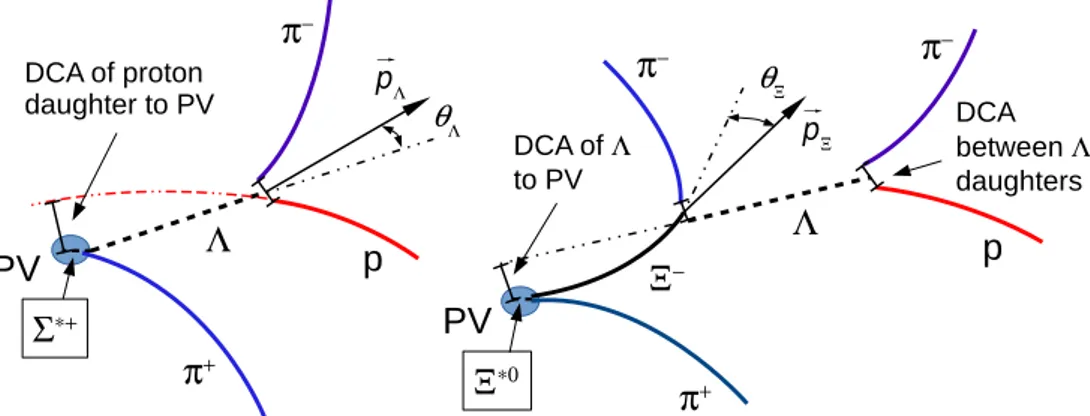
Since pions and protons from weak decay of ( (cτ= 7.89
cm [16]) and pions from weak decay of #− (cτ = 4.91
cm [16]) are produced away from the PV, specific topological
and track selection criteria, as summarized in Table4, were
applied [10,17,26].
In the analysis of "∗±, secondary π and p from (
decays were selected with a DCA between the two tracks
of less than 1.6 cm and with a DCAr to the PV greater
than 0.05 cm, to remove most primary tracks. For "∗−
and "∗+, the DCA of ( to the PV must be smaller than
0.3 cm in order to remove most of the primary
weakly-decaying #(1321)− and #(1321)+, which share the same
decay channel. The ( invariant mass (Mpπ) was selected
within± 10 MeV/c2of the particle data group (PDG) value
(m( = 1115.683 ± 0.006 MeV/c2) [16], the cosine of the
pointing angle θ( (the angle between the sum of daughter
momenta and the line that connects the PV and the decay
vertex, as shown in Fig.1) was requested to be greater than
0.99, and the radius of the fiducial volume r(() (the distance between the PV and the decay vertex) was requested to be between 1.4 and 100 cm.
) 2 c (GeV/ + π Λ M 1.2 1.3 1.4 1.5 1.6 1.7 1.8 1.9 2 ) 2c Counts/(8 MeV/ 0 10 20 30 3 10 × Same-event pairs Mixed-event background = 5.02 TeV (20-60%) NN s ALICE, p-Pb, + π Λ → *+ Σ c < 2.5 GeV/ T p < 0, 2.0 < CMS y -0.5 < ) 2 c (GeV/ + π Λ M 1.2 1.3 1.4 1.5 1.6 1.7 1.8 1.9 2 ) 2c Counts/(8 MeV/ 0 1 2 3 4×10³ Mixed-event subtracted Residual background Combined fit = 5.02 TeV (20-60%) NN s ALICE, p-Pb, + π Λ → *+ Σ c < 2.5 GeV/ T p < 0, 2.0 < CMS y -0.5 <
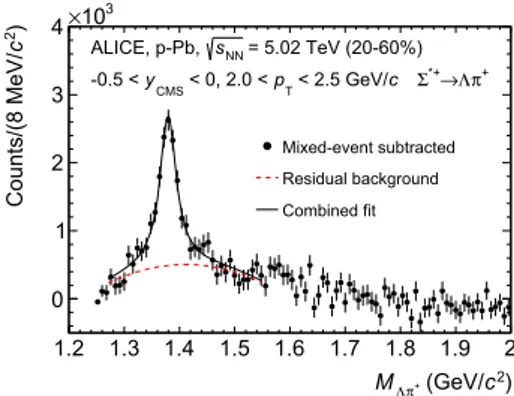
Fig. 2 (Left) the (π+invariant mass distribution (same-event pairs) in 2.0 < pT<2.5 GeV/c and for the multiplicity class 20–60%. The background shape, using pairs from different events (mixed-event back-ground), is normalised to the counts in 1.9 < M(π <2.0 GeV/c2.
(Right) the invariant mass distribution after subtraction of the mixed-event background. The solid curve represents the combined fit, while the dashed line describes the residual background
) 2 c (GeV/ π Ξ M 1.48 1.5 1.52 1.54 1.56 1.58 1.6 ) 2c Counts/(2 MeV/ 0.5 0.6 0.7 0.8 0.9 1 1.1 1.2 1.3×103 = 5.02 TeV (20-40%) NN s ALICE, p-Pb, c < 2.2 GeV/ T p < 0, 1.8 < CMS y -0.5 < ) -π + Ξ ( + π -Ξ → ) 0 * Ξ ( 0 * Ξ Same-event pairs Mixed-event background 63.05 / 55 p0 7.756 0.407 ± 1.533 p2 0.002405 0.000882 p4 119.6−± 201.6 p5 67.34 130.91± ) 2 c (GeV/ π Ξ M 1.48 1.5 1.52 1.54 1.56 1.58 1.6 ) 2c Counts/(2 MeV/ 0 0.1 0.2 0.3 0.4 0.5×10³ / ndf 2χ 53.2 / 55 p0 5.11 0.29± p1 1.532 ± 0.000 p2 0.0026 0.0013± p4 129.2 ± 159.5 p5 −92.38 103.61± = 5.02 TeV (20-40%) NN s ALICE, p-Pb, c < 2.2 GeV/ T p < 0, 1.8 < CMS y -0.5 < ) -π + Ξ ( + π -Ξ → ) 0 * Ξ ( 0 * Ξ Mixed-event subtracted Residual background Combined fit
Fig. 3 (Left) the #∓π± invariant mass distribution (same-event pairs) in 1.8 < pT < 2.2 GeV/c and for the multiplicity class 20–40%. The background shape, using pairs from different events (mixed-event background), is normalised to the counts in
1.49 < M#π < 1.51 GeV/c2and 1.56 < M#π < 1.58 GeV/c2. (Right) the invariant mass distribution after subtraction of the mixed-event background. The solid curve represents the combined fit, while the dashed line describes the residual background
In the analysis of #∗0, ( and π from #−were selected
with a DCA of less than 1.9 cm and with a DCAr to the PV
greater than 0.015 cm. The ( daughter particles (π and p)
were required to have a DCAr to the PV greater than 0.06
cm, while the DCA between the two particles was required to be less than 1.4 cm. Cuts on the invariant mass, the cosine
of the pointing angle (θ(, θ#) and the radius of the
fidu-cial volume (r((), r(#)) in Table4 were applied to
opti-mize the balance of purity and efficiency of each particle sample.
3.2 Signal extraction
The "∗±and #∗0signals were reconstructed by
invariant-mass analysis of candidates for the decay products in each transverse momentum interval of the resonance particle, and for each multiplicity class. Examples of invariant-mass
dis-tributions are presented in the left panels of Figs.2and3
for "∗+→ (π+and #∗0(#∗0)→ #−π+(#+π−),
respec-tively.1
Since the resonance decay products originate from a posi-tion which is indistinguishable from the PV, a significant combinatorial background is present. These background dis-tributions were determined by means of a mixed-event tech-nique, by combining uncorrelated decay products from 5 and
20 different events in the "∗±and #∗0analyses, respectively.
In order to minimise distortions due to different acceptances and to ensure a similar event structure, only tracks from
events with similar vertex positions z (|)z| < 1 cm) and
track multiplicities n (|)n| < 10) were taken.
For "∗±, the mixed-event background distributions were
normalised to a pT-dependent invariant mass region where
the mixed-event background and the invariant mass
dis-1 Similarly to what has been observed in the pp analysis [17], the dis-tributions of "∗−("∗+), not shown in this paper, have an additional peak at∼1.321 GeV/c2, as narrow as∼3 MeV/c2, due to the resid-ual #(1321)−(#(1321)+), escaping the filter on the DCA of ( to PV mentioned above.
tribution have similar slopes, as shown in Fig. 2 (left).
These pT-dependent invariant mass regions range from
1.5 < M(π < 2.0 GeV/c2, for the lowest pT bin, to
1.95 < M(π < 2.0 GeV/c2, for the highest pT bin.
More details on the normalisation procedure are provided
in Ref. [17]. The contribution of the normalisation to the
systematic uncertainty was estimated by selecting different normalisation regions and accounts for less than 1%.
For #∗0, the mixed-event background distributions were
normalised to two fixed regions, 1.49 < M#π<1.51 GeV/c2
and 1.56< M#π<1.58 GeV/c2, around the #∗0mass peak
(Fig.3(left)). These regions were used for all pT intervals
and multiplicity classes, because the background shape is rea-sonably well reproduced in these regions and the invariant-mass resolution of the reconstructed peaks appears stable,
independently of pT. The uncertainty on the normalisation
was estimated by varying the normalisation regions and is included in the quoted systematic uncertainty for the signal
extraction (Table5).
For "∗±, a combined fit of a second-order
polyno-mial for the residual background description and a Breit–
Wigner function with a width fixed to the PDG values [16]
for the signal were used in the invariant-mass range of
1.28 < M(π < 1.55 GeV/c2. The detector resolution
(∼1 MeV/c2) is much lower than the "∗±width and was
therefore neglected. In the right panel of Fig.2, the solid
and dashed lines show the result of the combined fit and the residual background, respectively. Alternative fit ranges were taken into account in the estimation of the systematic uncer-tainty. A linear and a cubic parametrization for the residual background were used to study the systematic uncertainty related to the signal extraction.
For #∗0, a combined fit of a first-order polynomial for the
residual background and a Voigtian function (a convolution of a Breit–Wigner and a Gaussian function accounting for the detector resolution) for the signal was used, as described
in Ref. [17].
The raw yields NRAW were obtained by integrating the
signal function from the combined fit. For "∗±, the
inte-gration of the Breit–Wigner function was carried out in the
invariant mass range between 1.28 and 1.56 GeV/c2. For
#∗0, the integration of the Voigtian function was done in the
mass region between 1.48 and 1.59 GeV/c2. In both cases,
corrections for the tails outside the integration region were applied. The statistical uncertainties on the raw yields range
between 5 and 15% for "∗±and 2–6% for #∗0, respectively.
3.3 Corrections and normalisation
The raw yields were corrected for the geometrical
accep-tance and the reconstruction efficiency (A× ε) of the
detec-tor (Fig.4) and by branching ratios (total B.R. in Table 2).
By using the DPMJET 3.05 event generator [19] and the
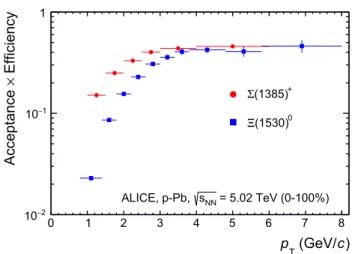
) c (GeV/ T p 0 1 2 3 4 5 6 7 8 Efficiency× Acceptance 2 − 10 1 − 10 1 + (1385) Σ 0 (1530) Ξ = 5.02 TeV (0-100%) NN s ALICE, p-Pb,
Fig. 4 The geometrical acceptance and the reconstruction efficiency
(A× ε) for "∗+and #∗0in−0.5 < yCMSMC <0 for minimum-bias events, obtained with DPMJET 3.05 [19] and GEANT 3.1 [27]. Only statistical uncertainties are shown
GEANT 3.21 package [27], a sample of about 100 million
p–Pb events was simulated and reconstructed in order to
com-pute the corrections. The distributions of A×ε were obtained
from the ratio between the number of reconstructed
hyper-ons ("∗±or #∗0) and the number of generated hyperons in
the same pT and rapidity interval. Inefficiencies in the
ver-tex reconstruction have a negligible effect for all multiplicity classes except 60–100%, where a correction factor of 1.03 has to be applied to the raw yields.
The product A×ϵ for MB events is shown in Fig.4for "∗+
and #∗0. Since the correction factors for different multiplicity
classes are in agreement with those from MB events within statistical uncertainty, the latter were used for all multiplicity
classes. For "∗+and "∗−, the correction factors were the
same. In the case of "∗+and "∗−, correction factors were
around 10% higher at low pT, as expected due to the different
interaction cross sections of proton and antiprotons in the
detector’s material [28].
Finally, the yields were normalised to the number of events
analysed in each multiplicity class, as defined in Table 1.
The MB spectra were instead normalised to the number of NSD events after applying the correction factors for trigger efficiency and event selection, primary vertex reconstruction
and selection, resulting in a total scaling factor of 0.964 [14].
3.4 Systematic uncertainties
Systematic effects due to the global tracking efficiency, track and topological selection cuts, PID, mass window selection
(#±), vertex selection, signal extraction and uncertainties on
the knowledge of the material budget and branching ratio
were studied for each pT interval and multiplicity class by
comparing different choices of selection criteria. The results
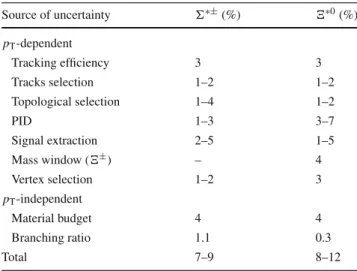
Table 5 Summary of the systematic uncertainties on the differential
yield, d2N/(d pTdy). Minimum and maximum values in all pTintervals and multiplicity classes are shown for each source
Source of uncertainty "∗±(%) #∗0(%) pT-dependent Tracking efficiency 3 3 Tracks selection 1–2 1–2 Topological selection 1–4 1–2 PID 1–3 3–7 Signal extraction 2–5 1–5 Mass window (#±) – 4 Vertex selection 1–2 3 pT-independent Material budget 4 4 Branching ratio 1.1 0.3 Total 7–9 8–12
Each source of systematic effects was first requested to pass a consistency check, testing whether a change in selec-tion criteria prevents statistically significant differences in
the reconstructed yields [29]. If the source failed the
consis-tency check, the deviation between the default yield and the alternative one obtained by varying the selection was taken as systematic uncertainty. Sources which did not provide
statis-tically significant differences are not listed in Table5(e.g. (
invariant mass window). The uncertainty for the "∗±yield
is taken as the average of the uncertainties for "∗+, "∗−,
"∗−, and "∗+.
For "∗±, the main contribution to the total systematic
uncertainty originates from the signal extraction, while for
#∗0 the main contribution is from the PID. The signal
extraction includes variations of the background
normali-sation region, choice of the integration interval of the raw
yield determination and, in the case of "∗±, order of the
polynomial for describing the residual background. Also, an alternative method, which integrates the signal distri-bution by summing the bin contents, provides negligible differences.
Table5 reports the minimum and maximum of the
sys-tematic uncertainty from each source. The syssys-tematic
uncer-tainty in each pT interval is obtained as the quadratic sum
of all contributions, except the pT-independent
uncertain-ties, which affect only the normalisation (see Sect. 4.1).
The uncertainties which are dependent on multiplicity and uncorrelated across different multiplicity bins were treated separately. Topological selections, signal extraction and PID give the dominant contributions to the uncertainties uncor-related across multiplicity. These uncertainties were esti-mated to be within 3% (5%), which represents a frac-tion of 35% (50%) of the total systematic uncertainty for
"∗±(#∗0).
4 Results and discussion
4.1 Transverse momentum spectra
The transverse momentum spectra of "∗+ and #∗0 in
the rapidity range −0.5 < yCMS < 0 are shown in
Fig.5for different multiplicity classes and for NSD events.
They cover the ranges 1 < pT < 6 GeV/c for "∗+ and
0.8 < pT < 8 GeV/c for #∗0. The spectra obtained for
"∗−, "∗− and "∗+ are consistent with the spectrum of
"∗+.
The spectra are fitted with a Lévy–Tsallis function [30],
) c (GeV/ T p 0 1 2 3 4 5 6 ] -1 )c ) [(GeV/y d T p /(d N 2 d evt N 1/ 7 − 10 6 − 10 5 − 10 4 − 10 3 − 10 2 − 10 1 − 10 1 NSD (x8) 0-20% (x1) 20-60% (x1/2) 60-100% (x1/4) vy-Tsallis fit e L + (1385) Σ ALICE, p-Pb, sNN = 5.02 TeV < 0 CMS y -0.5 < ) c (GeV/ T p 0 1 2 3 4 5 6 7 8 ] -1 )c ) [(GeV/ T pd y /(d N 2 d evt N 1/ 8 − 10 7 − 10 6 − 10 5 − 10 4 − 10 3 − 10 2 − 10 1 − 10 1 / ndf 2χ 6.298 / 7 p0 0.02669 0.00065± p1 0.6189 0.0088± p2 ± 1000 936.1 = 5.02 TeV NN s ALICE, p-Pb, < 0 CMS y -0.5 < ) 0 (1530) Ξ + 0 (1530) Ξ ( 2 1 NSD (x8) 0-20% (x1) 20-40% (x1/2) 40-60% (x1/4) 60-100% (x1/8) vy-Tsallis fit e L
Fig. 5 Transverse momentum spectra of "∗+(left) and #∗0(right) in different multiplicity classes in the rapidity range−0.5 < yCMS <0. For #∗0, both particles and antiparticles are analysed together.
Statisti-cal (bars) and systematic (boxes) uncertainties are included. The dashed
Table 6 Integrated yields
(dN /dy) and mean transverse momenta (⟨pT⟩). The values for "∗±are obtained by averaging the values for "∗+, "∗−, "∗− and "∗+. Statistical (first one) and total systematic (second one) uncertainties including the extrapolation from the various fit functions are quoted
Baryon Multiplicity class dN /dy(×10−3) ⟨pT⟩ (GeV/c)
"∗± NSD 49.0± 0.6 ± 6.5 1.367± 0.009 ± 0.061 0–20% 90.3± 1.4 ± 7.9 1.495± 0.012 ± 0.046 20–60% 52.2± 0.8 ± 6.0 1.342± 0.010 ± 0.055 60–100% 15.2± 0.4 ± 2.4 1.173± 0.015 ± 0.067 1/2(#∗0+ #0) NSD 12.5± 0.3 ± 1.1 1.540± 0.016 ± 0.071 0–20% 27.3± 0.6 ± 2.8 1.626± 0.016 ± 0.068 20–40% 17.7± 0.5 ± 2.4 1.482± 0.020 ± 0.100 40–60% 10.7± 0.3 ± 1.6 1.459± 0.025 ± 0.114 60–100% 3.6± 0.1 ± 0.5 1.377± 0.023 ± 0.089 1 Nevt d2N d pTdy = pT dN dy (n− 1)(n − 2) nC[nC + m0(n− 2)] × ⎡ ⎣1 + # p2 T+ m20− m0 nC ⎤ ⎦ −n , (1)
where Nevt is the number of events, m0 is the mass of the
particle, and n, C and the integrated yield dN /dy are free parameters for the fit. This function was successfully used to describe most of the identified particle spectra in pp
colli-sions [14,17,26].
The values of dN /dy and ⟨pT⟩ shown in Table 6 were
calculated by using the experimental spectrum in the
mea-sured pT-range and the Lévy–Tsallis fit function outside of
the measured pT-range. The contribution from the low- pT
extrapolation to the total dN /dy is 36–47% (20–29%) for
"∗+(#∗0) moving from low to high multiplicity, while the
one from the high- pTextrapolation is negligible. The
system-atic uncertainties on dN /dy and ⟨pT⟩ presented in Table6
were estimated by repeating the Lévy–Tsallis fit moving ran-domly (with a Gaussian distribution) the measured points
within their pT-dependent systematic uncertainties. The pT
-independent uncertainties were further added in quadrature to the systematic uncertainties on dN /dy. Alternative
func-tional forms, such as Boltzmann–Gibbs Blast-Wave [31,32],
mT-exponential [32,33], Boltzmann and Bose–Einstein fit
functions were used for both particles to evaluate the
sys-tematic uncertainties on the low- pTextrapolation. The
maxi-mum difference between the results obtained with the various fit functions was taken as the uncertainty. These systematic uncertainties, which vary between 5 and 10%, were added in quadrature to the uncertainties for the Lévy–Tsallis fit.
The values for "∗±in Table6were obtained by averaging
those for "∗+, "∗−, "∗−and "∗+to reduce the statistical
uncertainties.
4.2 Mean transverse momenta
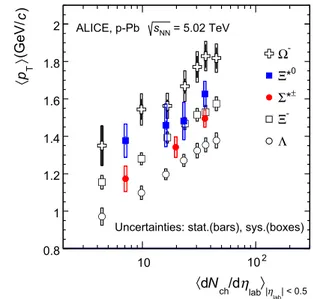
Figure 6 shows the mean transverse momentum ⟨pT⟩ as
a function of mean charged-particle multiplicity density
⟨dNch/dηlab⟩ at midrapidity. The results for "∗±and #∗0are
compared with those for other hyperons observed in p–Pb
collisions at √sNN = 5.02 TeV [10,24].
Increasing trends from low to high multiplicities are
observed for all hyperons. For both "∗±and #∗0, the mean
transverse momenta increase by 20% as the mean charged-particle multiplicity increases from 7.1 to 35.6. This result is similar to the one obtained for the other hyperons.
Further-more, a similar increase has been observed also for K±, K0
S,
K∗(892)0and φ [14], whereas protons are subject to a larger
(∼33%) increase in the given multiplicity range, as discussed
also in Ref. [24].
In all multiplicity classes, the ⟨pT⟩ follows an
approx-imate mass ordering: ⟨pT⟩( < ⟨pT⟩#− ≃ ⟨pT⟩"∗± <
⟨pT⟩#∗0 < ⟨pT⟩&−. The ⟨pT⟩ of "∗± looks
systemati-| < 0.5 lab η | lab η /d ch N d 10 102 )c (GeV/ T p 0.8 1 1.2 1.4 1.6 1.8 2 -Ω 0 * Ξ ± * Σ -Ξ Λ = 5.02 TeV NN s ALICE, p-Pb
Uncertainties: stat.(bars), sys.(boxes)
Fig. 6 Mean transverse momenta ⟨pT⟩ of (, #−, "∗±, #∗0and &− in p–Pb collisions at √sNN= 5.02 TeV as a function of mean charged-particle multiplicity density⟨dNch/dηlab⟩, measured in the pseudora-pidity range| ηlab |< 0.5. The results for (, #−and &−are taken from [10,14,24]. Statistical and systematic uncertainties are represented as bars and boxes, respectively. The &−and #−points in the 3rd and 4th lowest multiplicity bins are slightly displaced along the abscissa to avoid superposition with the #∗0points
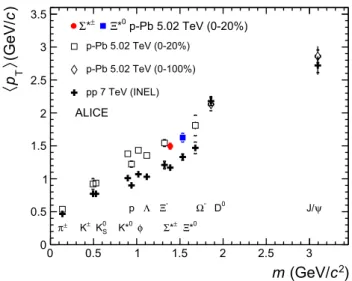
) 2 c (GeV/ m 0 0.5 1 1.5 2 2.5 3 )c (GeV/ T p 0 0.5 1 1.5 2 2.5 3 3.5 p-Pb 5.02 TeV (0-20%) p-Pb 5.02 TeV (0-100%) pp 7 TeV (INEL) ± π K± S 0 K K*0 p Λ φ -Ξ ± * Σ Ξ*0 -Ω D0 J/ψ ALICE p-Pb 5.02 TeV (0-20%) 0 * Ξ ± * Σ
Fig. 7 Mass dependence of the mean transverse momenta of
iden-tified particles for the 0–20% V0A multiplicity class and with −0.5 < yCMS < 0 in p–Pb collisions at √sNN = 5.02 TeV [10, 24], and in minimum-bias pp collisions at √s = 7 TeV [17] with |yCMS| < 0.5. Additionally, D0 and J /ψ results are plot-ted. The D0 and J /ψ were measured in different rapidity ranges: |yCMS| < 0.5 [34] (|yCMS| < 0.9 [35]) for D0 (J /ψ) in pp and −0.96 < yCMS < 0.04 [34] (−1.37 < yCMS < 0.43 [36]) for D0 (J /ψ) in p–Pb. Note also that the results for D0and J /ψ in p–Pb col-lisions are for the 0–100% multiplicity class
cally lower than the ⟨pT⟩ of #−, despite the larger mass
of "∗±. The uncertainties, however, are too large to draw
any conclusion on possible hints of violation of the mass hierarchy. This hierarchy of mass-ordering, also including
D0and J /ψ in the comparison, is displayed in Fig.7. Note,
however, that the D0 and J /ψ were measured in different
rapidity ranges: |yCMS| < 0.5 [34] (|yCMS| < 0.9 [35])
for D0 (J /ψ) in pp and −0.96 < yCMS < 0.04 [34]
(−1.37 < yCMS < 0.43 [36]) for D0(J / ψ) in p–Pb, and
the results for D0and J /ψ in p-Pb collisions are for the 0–
100% multiplicity class. This mass dependence is observed in both p–Pb and pp collisions. It was observed also by the
STAR collaboration [37] in MB pp, MB d–Au and central
Au–Au collisions.
Furthermore, for the light-flavour hadrons, the mean trans-verse momenta in p–Pb collisions are observed to be consis-tently higher than those in pp collisions at 7 TeV. The
situa-tion for the charm hadrons is different, where ⟨pT⟩ appears
compatible between both colliding systems. The discrepancy is likely due to different production mechanisms for heavy and light flavours and to a harder fragmentation of charm
quarks. Specifically, the fact that⟨pT⟩ remains similar in pp
and in p–Pb is consistent with (i) the fact that p–Pb colli-sions can be considered as a superposition of independent nucleon-nucleon collisions for what concerns D-meson
pro-duction, as described in [34], and/or (ii) with the effects of
shadowing in p–Pb which reduces the production at low pT
and thus increasing the overall ⟨pT⟩ for J/ψ [36]; the small
pThardening expected in pp when going from 5.02 to 7 TeV
is apparently not enough to counter-balance the situation.
Because of small decrease of the ⟨pT⟩ for proton and
(relative to those for K∗0 and φ, two different trends for
mesons and baryons have been suggested [38]. Even
includ-ing D0 and J /ψ, as shown in Fig. 7, a different trend for
mesons and baryons cannot be convincingly established. 4.3 Integrated particle ratios
The integrated yield ratios of excited to ground-state
hyper-ons [10,17,24,32,37,39] with the same strangeness
con-tent, for different collision systems and energies, are shown
in Fig. 8 as a function of⟨dNch/dηlab⟩. In both cases, the
variation of the integrated yield ratio with mean multiplicity is within experimental uncertainties. In fact, the similar flat
behaviour of "∗±/(and #∗0/#−is remarkable, when
con-sidering their different lifetimes and other properties such as spin and mass.
The results are compared with model predictions,
PYTHIA8 for pp at 7 TeV [20] and DPMJET for p–Pb at 5.02
TeV [19] collisions. The "∗±/( ratios are consistent with
the values predicted by PYTHIA8 in pp collisions, whereas the DPMJET prediction for p–Pb collisions is lower than
the experimental data. The measured #∗0/#−ratios appear
higher than the corresponding predictions for both systems.
Note that the PYTHIA8 [20] and DPMJET [19] values in
Figs. 8and9 were obtained respectively for INEL pp and
NSD p–Pb events, which have corresponding mean
charged-particle multiplicities of⟨dNch/dηlab⟩INEL= 4.60+0.34−0.17 [40]
and⟨dNch/dηlab⟩NSD= 17.4± 0.7 [23]. These predictions
are indicated as dotted and dashed lines with arbitrary lengths
in the pertinent multiplicity regions in Figs.8and9. Fig.9
will be discussed later.
The results are also compared to thermal model
predic-tions [7,18]. For small systems a canonical treatment is a
priori required to take into account exact strangeness
conser-vation [18]. This approach leads to a dependence on system
size as can be seen in p-Pb collisions studying multi-strange
hadrons [10]. For the chosen ratios, however, the
canoni-cal corrections are identicanoni-cal for numerator and denominator (same strangeness quantum number). Therefore, the grand
canonical values are used in Fig.8 for two models [7,18],
which are marked at the asymptotic limit, corresponding to
the mean charged-particle multiplicity in Pb–Pb [43].
The constant behaviour of the yield ratios of excited to ground-state hyperons with same strangeness content indi-cates that neither regeneration nor re-scattering dominates
with increasing collision system size, even for "∗±, which
has a shorter lifetime than #∗0by a factor of 4. It is especially
interesting to consider the constant behaviour of "∗±/( ratio
in contrast to the apparent decrease observed for K∗0/K−
sim-| < 0.5 lab η | lab η /d ch N d 0 10 20 30 40 )] Λ+ Λ )/[2( ± * Σ+ ±* Σ( 0.05 0.1 0.15 0.2 0.25 0.3 Tch=156 MeV GSI-Heidelberg model =158 MeV ch T THERMUS p-Pb, DPMJET pp, Pythia8 = 5.02 TeV NN s ALICE, p-Pb, = 7 TeV (INEL) s ALICE, pp, = 200 GeV NN s STAR, d-Au, = 200 GeV s STAR, pp, 3 10 | < 0.5 lab η | lab η /d ch N d 0 10 20 30 40 ) + Ξ+ -Ξ )/( *0 Ξ+ *0 Ξ( 0.1 0.2 0.3 0.4 0.5 0.6 Tch=156 MeV GSI-Heidelberg model =158 MeV ch T THERMUS p-Pb, DPMJET pp, Pythia8 = 5.02 TeV NN s ALICE, p-Pb, = 7 TeV (INEL) s ALICE, pp, 3 10
Fig. 8 (Left) ratio of "∗±to ( and (Right) ratio of #∗0to #− mea-sured in pp [17,32,37,39], d–Au [32,37] and p–Pb [10,24] collisions, as a function of⟨dNch/dηlab⟩ measured at midrapidity. Statistical uncer-tainties (bars) are shown as well as total systematic unceruncer-tainties
(hol-low boxes) and systematic uncertainties uncorrelated across multiplicity (shaded boxes). A few model predictions are also shown as lines at their appropriate abscissa | < 0.5 lab η | lab η /d ch N d 0 10 20 30 40 )] -π+ +π )/[2( ± * Σ+ ±* Σ( 0 2 4 6 8 10 3 − 10 × = 156 MeV ch T GSI-Heidelberg model p-Pb, DPMJET pp, Pythia8 = 5.02 TeV NN s ALICE, p-Pb, = 7 TeV (INEL) s ALICE, pp, = 200 GeV NN s STAR, d-Au, = 200 GeV s STAR, pp, 3 10 | < 0.5 lab η | lab η /d ch N d 10 20 30 40 ) -π+ +π )/( *0 Ξ+ *0 Ξ( 0 0.5 1 1.5 2 2.5 3 − 10 × =156 MeV ch T GSI-Heidelberg model p-Pb, DPMJET pp, Pythia8 = 5.02 TeV NN s ALICE, p-Pb, = 7 TeV (INEL) s ALICE, pp, 3 10
Fig. 9 (Left) ratio of "∗±to π±and (Right) ratio of #∗0to π±, mea-sured in pp [17,32,41,42], d–Au [32,37] and p–Pb [24] collisions, as a function of the average charged particle density (⟨dNch/dηlab⟩) mea-sured at midrapidity. Statistical uncertainties (bars) are shown as well
as total systematic uncertainties (hollow boxes) and systematic uncer-tainties uncorrelated across multiplicity (shaded boxes). A few model predictions are also shown as lines at their appropriate abscissa
ilarly short lifetimes of "∗± and K∗0. In Pb–Pb collisions,
both behaviours are predicted by the EPOS3 model [44,45],
which employs the UrQMD model [46] for the description
of the hadronic phase. In addition, the "∗±/( ratios at LHC
energies turn out to be comparable with the results obtained
at lower energies by the STAR collaboration [32,37].
The integrated yield ratios of excited hyperons to pions are
shown in Fig.9to study the evolution of relative strangeness
production yields with increasing collision system size. Con-sidering the relatively small systematic uncertainties uncor-related across multiplicity (shaded boxes), one observes increasing patterns by 40–60% relative to results in pp
col-lisions at the same √sNN, depending on the strangeness
contents. These results are consistent with previous obser-vations of ground-state hyperons to pion ratios measured
at ALICE [10]. The constant behavior of the "∗±/( and
#∗0/#− ratios indicates that the strangeness enhancement
observed in p-Pb collisions depends predominantly on the strangeness content, rather than on the hyperon mass. Results
from low-energy collisions [32,37,42] show a similar pattern
in spite of the narrower range accessible for mean charged-particle multiplicity. In both cases, QCD-inspired predictions
like PYTHIA for pp [20] and DPMJET for p–Pb [19] clearly
one seems to be comparable with results from high multi-plicity events.
5 Conclusions
Transverse momentum spectra of "∗±and #∗0produced in
p–Pb collisions at √sNN= 5.02 TeV have been measured, and
the yields and mean pTvalues have been extracted with the
help of Lévy–Tsallis fits. The mean pTof these hyperon
res-onances exhibit a similarly increasing pattern as other
hyper-ons ((, #−, &−), depending on mean multiplicity and
fol-lowing the approximate mass ordering observed for other particles despite of relatively large uncertainties. The inte-grated yield ratios of excited to ground-state hyperons, with the same strangeness content, show a flat behaviour over the
whole mean multiplicity range. The "∗±/( ratio does not
show a variation with collision energy, nor with increasing
system size. The #∗0/#−ratios are higher than predicted by
event generators. Both ratios agree with thermal model val-ues. The yield ratios relative to pions show a gradual increase
with⟨dNch/dηlab⟩. This rise is consistent with the results of
ground-state hyperons produced in the same collision sys-tem, i.e. they show a gradual evolution with the system size depending only on the strangeness content.
The current measurement represents a relevant baseline for further investigation in Pb–Pb collisions. It will be
espe-cially valuable to compare the "∗±/( ratio with K∗0/K−,
since "∗±and K∗0have similar lifetimes. A complete set of
such measurements for many resonances (ρ, K∗0, φ, "∗±,
(∗, #∗0) with different lifetimes will allow the properties of
the hadronic phase to be studied in more detail.
Acknowledgements The ALICE Collaboration would like to thank
all its engineers and technicians for their invaluable contributions to the construction of the experiment and the CERN accelerator teams for the outstanding performance of the LHC complex. The ALICE Collaboration gratefully acknowledges the resources and support pro-vided by all Grid centres and the Worldwide LHC Computing Grid (WLCG) collaboration. The ALICE Collaboration acknowledges the following funding agencies for their support in building and running the ALICE detector: A. I. Alikhanyan National Science Laboratory (Yerevan Physics Institute) Foundation (ANSL), State Committee of Science and World Federation of Scientists (WFS), Armenia; Austrian Academy of Sciences and Nationalstiftung für Forschung, Technolo-gie und Entwicklung, Austria; Ministry of Communications and High Technologies, National Nuclear Research Center, Azerbaijan; Con-selho Nacional de Desenvolvimento Científico e Tecnológico (CNPq), Universidade Federal do Rio Grande do Sul (UFRGS), Financiadora de Estudos e Projetos (Finep) and Fundação de Amparo à Pesquisa do Estado de São Paulo (FAPESP), Brazil; Ministry of Science & Technology of China (MSTC), National Natural Science Foundation of China (NSFC) and Ministry of Education of China (MOEC) , China; Ministry of Science, Education and Sport and Croatian Sci-ence Foundation, Croatia; Ministry of Education, Youth and Sports of the Czech Republic, Czech Republic; The Danish Council for Indepen-dent Research | Natural Sciences, the Carlsberg Foundation and Danish National Research Foundation (DNRF), Denmark; Helsinki Institute of
Physics (HIP), Finland; Commissariat à l’Energie Atomique (CEA) and Institut National de Physique Nucléaire et de Physique des Particules (IN2P3) and Centre National de la Recherche Scientifique (CNRS), France; Bundesministerium für Bildung, Wissenschaft, Forschung und Technologie (BMBF) and GSI Helmholtzzentrum für Schwerionen-forschung GmbH, Germany; Ministry of Education, Research and Reli-gious Affairs, Greece; National Research, Development and Innovation Office, Hungary; Department of Atomic Energy Government of India (DAE) and Council of Scientific and Industrial Research (CSIR), New Delhi, India; Indonesian Institute of Science, Indonesia; Centro Fermi - Museo Storico della Fisica e Centro Studi e Ricerche Enrico Fermi and Istituto Nazionale di Fisica Nucleare (INFN), Italy; Institute for Innovative Science and Technology , Nagasaki Institute of Applied Sci-ence (IIST), Japan Society for the Promotion of SciSci-ence (JSPS) KAK-ENHI and Japanese Ministry of Education, Culture, Sports, Science and Technology (MEXT), Japan; Consejo Nacional de Ciencia (CONA-CYT) y Tecnología, through Fondo de Cooperación Internacional en Ciencia y Tecnología (FONCICYT) and Dirección General de Asuntos del Personal Academico (DGAPA), Mexico; Nationaal instituut voor subatomaire fysica (Nikhef), Netherlands; The Research Council of Norway, Norway; Commission on Science and Technology for Sus-tainable Development in the South (COMSATS), Pakistan; Pontificia Universidad Católica del Perú, Peru; Ministry of Science and Higher Education and National Science Centre, Poland; Korea Institute of Sci-ence and Technology Information and National Research Foundation of Korea (NRF), Republic of Korea; Ministry of Education and Sci-entific Research, Institute of Atomic Physics and Romanian National Agency for Science, Technology and Innovation, Romania; Joint Insti-tute for Nuclear Research (JINR), Ministry of Education and Science of the Russian Federation and National Research Centre Kurchatov Insti-tute, Russia; Ministry of Education, Science, Research and Sport of the Slovak Republic, Slovakia; National Research Foundation of South Africa, South Africa; Centro de Aplicaciones Tecnológicas y Desar-rollo Nuclear (CEADEN), Cubaenergía, Cuba, Ministerio de Ciencia e Innovacion and Centro de Investigaciones Energéticas, Medioambi-entales y Tecnológicas (CIEMAT), Spain; Swedish Research Council (VR) and Knut & Alice Wallenberg Foundation (KAW), Sweden; Euro-pean Organization for Nuclear Research, Switzerland; National Science and Technology Development Agency (NSDTA), Suranaree University of Technology (SUT) and Office of the Higher Education Commis-sion under NRU project of Thailand, Thailand; Turkish Atomic Energy Agency (TAEK), Turkey; National Academy of Sciences of Ukraine, Ukraine; Science and Technology Facilities Council (STFC), United Kingdom; National Science Foundation of the United States of Amer-ica (NSF) and United States Department of Energy, Office of Nuclear Physics (DOE NP), United States of America.
Open Access This article is distributed under the terms of the Creative
Commons Attribution 4.0 International License (http://creativecomm ons.org/licenses/by/4.0/), which permits unrestricted use, distribution, and reproduction in any medium, provided you give appropriate credit to the original author(s) and the source, provide a link to the Creative Commons license, and indicate if changes were made.
Funded by SCOAP3.
References
1. J. Rafelski, B. Muller, Strangeness production in the quark-gluon plasma. Phys. Rev. Lett. 48, 1066–1069 (1982). doi:10.1103/ PhysRevLett.48.1066
2. C. Blume, C. Markert, Strange hadron production in heavy ion collisions from SPS to RHIC. Prog. Part. Nucl. Phys. 66, 834–879 (2011). doi:10.1016/j.ppnp.2011.05.001.arXiv:1105.2798 [nucl-ex]
3. WA97 Collaboration, E. Andersen et al., Strangeness enhancement at mid-rapidity in Pb-Pb collisions at 158 A GeV/ c. Phys. Lett. B
449, 401–406 (1999). doi:10.1016/S0370-2693(99)00140-9 4. NA49 Collaboration, S. Afanasiev et al., #−and #+production
in central Pb-Pb collisions at 158 GeV/ c per nucleon. Phys. Lett. B 538, 275–281 (2002). doi:10.1016/S0370-2693(02)01970-6 5. S.T.A.R. Collaboration, J. Adams et al., Multistrange baryon
pro-duction in Au-Au collisions at √sNN= 130 GeV. Phys. Rev. Lett.
92, 182301 (2004). doi:10.1103/PhysRevLett.92.182301 6. ALICE Collaboration, B. Abelev et al., Multi-strange baryon
pro-duction at mid-rapidity in Pb–Pb collisions at √sNN= 2.76 TeV. Phys. Lett. B 728, 216–227 (2014). doi10.1016/j.physletb.2013. 11.048.arXiv:1307.5543[nucl-ex]
7. A. Andronic, P. Braun-Munzinger, J. Stachel, Thermal hadron production in relativistic nuclear collisions: The hadron mass spectrum, the horn, and the QCD phase transition. Phys. Lett. B 673, 142–145 (2009). doi10.1016/j.physletb.2009.02.014. arXiv:0812.1186[nucl-th]
8. K. Redlich, A. Tounsi, Strangeness enhancement and energy depen-dence in heavy ion collisions. Eur. Phys. J. C 24, 589–594 (2002). doi:10.1007/s10052-002-0983-1
9. I. Kraus, J. Cleymans, H. Oeschler, K. Redlich, Particle production in pp collisions and predictions for √s = 14 TeV at the CERN Large Hadron Collider (LHC). Phys. Rev. C 79, 014901 (2009). doi:10. 1103/PhysRevC.79.014901
10. ALICE Collaboration, J. Adam et al., Multi-strange baryon production in p–Pb collisions at √sNN=5.02 TeV. Phys. Lett. B 758, 389–401 (2016). doi:10.1016/j.physletb.2016.05.027. arXiv:1512.07227[nucl-ex]
11. G. Torrieri, J. Rafelski, Strange hadron resonances as a signature of freeze-out dynamics. Phys. Lett. B 509, 239–245 (2001). doi:10. 1016/S0370-2693(01)00492-0.arXiv:hep-ph/0103149
12. M. Bleicher, J. Aichelin, Strange resonance production: prob-ing chemical and thermal freezeout in relativistic heavy ion collisions. Phys. Lett. B. 530, 81–87 (2002). doi:10.1016/ S0370-2693(02)01334-5.arXiv:hep-ph/0201123
13. ALICE Collaboration, B. Abelev et al., Production of K∗(892)0and φ(1020) in pp collisions at √sNN= 7 TeV. Eur. Phys. J. C 72, 2183 (2012). doi:10.1140/epjc/s10052-012-2183-y. arXiv:1208.5717 [nucl-ex]
14. ALICE Collaboration, J. Adam et al., Production of K∗(892)0 and φ(1020) in p–Pb collisions at √sNN = 5.02 TeV. Eur. Phys. J. C 76, 245 (2016). doi:10.1140/epjc/s10052-016-4088-7. arXiv:1601.7868[nucl-ex]
15. ALICE Collaboration, B. Abelev et al., K∗(892)0 and φ(1020) production in Pb–Pb collisions at √sNN = 2.76 TeV. Phys. Rev. C 91, 024609 (2015). doi:10.1103/PhysRevC.91.024609. arXiv:1404.0495[nucl-ex]
16. Particle Data Group Collaboration, K. Olive et al., Review of Particle Physics. Chin. Phys. C 38, 090001 (2014). doi:10.1088/ 1674-1137/38/9/090001
17. ALICE Collaboration, B. Abelev et al., Production of "(1385)± and #(1530)0 in proton-proton collisions at √s = 7 TeV. Eur. Phys. J. C 75, 1 (2015). doi10.1140/epjc/s10052-014-3191-x. arXiv:1406.3206[nucl-ex]
18. S. Wheaton, J. Cleymans, M. Hauer, THERMUS—a thermal model package for ROOT. Comput. Phys. Commun. 180, 84–106 (2009). doi:10.1016/j.cpc.2008.08.001
19. S. Roesler, R. Engel, J. Ranft, The Monte Carlo event generator DPMJET-III, advanced Monte Carlo for radiation physics, particle transport simulation and applications. in Conference Proceedings,
MC2000, Lisbon, Portugal, October 23–26, pp. 1033–1038 (2000). doi:10.1007/978-3-642-18211-2_166.arXiv:hep-ph/0012252
20. T. Sjöstrand, S. Mrenna, P. Skands, A brief introduction to PYTHIA 8.1. Comput. Phys. Commun. 178, 852–867 (2008). doi:10.1016/ j.cpc.2008.01.036.arXiv:0710.3820[hep-ph]
21. ALICE Collaboration, K. Aamodt et al., The ALICE experi-ment at the CERN LHC. JINST 3, S08002 (2008). doi:10.1088/ 1748-0221/3/08/S08002
22. ALICE Collaboration, B. Abelev et al., Performance of the ALICE Experiment at the CERN LHC. Int. J. Mod. Phys. A 29, 1430044 (2014). doi:10.1142/S0217751X14300440. arXiv:1402.4476[nucl-ex]
23. ALICE Collaboration, B. Abelev et al., Pseudorapidity density of charged particles in p–Pb collisions at √sNN= 5.02 TeV. Phys. Rev. Lett. 110, 032301 (2013). doi:10.1103/PhysRevLett.110.032301. arXiv:1210.3615[nucl-ex]
24. ALICE Collaboration, J. Adam et al., Multiplicity dependence of pion, kaon, proton and lambda production in p–Pb collisions at √s
NN= 5.02 TeV. Phys. Lett. B 728, 25–38 (2014). doi:10.1016/ j.physletb.2013.11.020.arXiv:1307.6796[nucl-ex]
25. ALICE Collaboration, J. Adam et al., Centrality dependence of particle production in p–Pb collisions at √sNN= 5.02 TeV. Phys. Rev. C 91, 064905 (2015). doi:10.1103/PhysRevC.91.064905. arXiv:1412.6828[nucl-ex]
26. ALICE Collaboration, K. Aamodt et al., Strange particle produc-tion in proton-proton collisions at √s = 0.9 TeV with ALICE at the LHC. Eur. Phys. J. C71, 1594 (2011). doi:10.1140/epjc/ s10052-011-1594-5.arXiv:1012.3257[nucl-ex]
27. R. Brun, F. Carminati, S. Giani, GEANT detector description and simulation tool. CERN-W5013 (1994)
28. ALICE Collaboration, K. Aamodt et al., Midrapidity antiproton-to-proton ratio in pp collisions at √s = 0.9 and 7 TeV measured by the ALICE experiment. Phys. Rev. Lett. 105, 072002 (2010). doi:10.1103/PhysRevLett.105.072002.arXiv:1006.5432[hep-ex] 29. R. Barlow, Systematic errors: facts and fictions. Presented at Advanced Statistical Techniques in HEP, Durham, March 2002, p. 333 (2002).arXiv:hep-ex/0207026v1
30. C. Tsallis, Possible generalization of Boltzmann-Gibbs statistics. J. Stat. Phys. 52, 479–487 (1988). doi:10.1007/BF01016429 31. E. Schnedermann, J. Sollfrank, U. Heinz, Thermal
phe-nomenology of hadrons from 200A GeV S+S collisions. Phys. Rev. C 48, 2462–2475 (1993). doi:10.1103/PhysRevC.48.2462. arXiv:nucl-th/9307020
32. STAR Collaboration, B.I. Abelev et al., Systematic measurements of identified particle spectra in pp, d-Au, and Au-Au collisions at the STAR detector. Phys. Rev. C 79, 034909 (2009). doi:10.1103/ PhysRevC.79.034909
33. STAR Collaboration, J. Adams et al., K(892)∗ resonance pro-duction in Au-Au and pp collisions at √sNN = 200 GeV. Phys. Rev. C 71, 064902 (2005). doi:10.1103/PhysRevC.71.064902. arXiv:nucl-ex/0412019v2
34. ALICE Collaboration, J. Adam et al., D-meson production in p– Pb collisions at √sNN= 5.02 TeV and in pp collisions at √s = 7 TeV. Phys. Rev. C94, 054908 (2016). doi:10.1103/PhysRevC.94. 054908.arXiv:1605.07569[nucl-ex]
35. ALICE Collaboration, B. Abelev et al., Inclusive J/ψ production in pp collisions at √s = 2.76 TeV. Phys. Lett. B 718, 295–306 (2012). doi:10.1016/j.physletb.2012.10.078.arXiv:1203.3641[hep-ex] 36. ALICE Collaboration, J. Adam et al., Rapidity and
transverse-momentum dependence of the inclusive J/ψ nuclear modification factor in p–Pb collisions at √sNN= 5.02 TeV. JHEP06, 55 (2015). doi:10.1007/JHEP06(2015)055.arXiv:1503.07179[nucl-ex] 37. STAR Collaboration, B.I. Abelev et al., Hadronic resonance
pro-duction in d-Au collisions at √sNN= 200 GeV measured at the BNL Relativistic Heavy-Ion Collider. Phys. Rev. C 78, 044906 (2008). doi:10.1103/PhysRevC.78.044906.arXiv:0801.0450[nucl-ex]
38. A. Velásquez, Mean pTscaling with m/nqat the LHC: Absence of (hydro) flow in small systems? Nucl. Phys. A 943, 9–17 (2015). doi:10.1016/j.nuclphysa.2015.08.003.arXiv:1506.00584[hep-ph] 39. ALICE Collaboration, B. Abelev et al., Multi-strange baryon pro-duction in pp collisions at √s = 7 TeV with ALICE. Phys. Lett. B 712, 309 (2012). doi:10.1016/j.physletb.2012.05.011. arXiv:1204.0282[nucl-ex]
40. ALICE Collaboration, J. Adam et al., Charged-particle mul-tiplicities in proton-proton collisions at √s = 0.9 to 8 TeV. arXiv:1509.07541[nucl-ex]
41. ALICE Collaboration, J. Adam et al., Measurement of pion, kaon and proton production in proton-proton collisions at √s = 7 TeV. Eur. Phys. J. C 75, 226 (2015). doi:10.1140/epjc/ s10052-015-3422-9.arXiv:1504.00024[nucl-ex]
42. STAR Collaboration, B.I. Abelev et al., Strange baryon reso-nance production in √sNN= 200GeV p+p and Au+Au collisions. Phys. Rev. Lett. 97, 132301 (2006). doi:10.1103/PhysRevLett.97. 132301.arXiv:nucl-ex/0604019v2
43. ALICE Collaboration, J. Adam et al., Centrality Dependence of the Charged-Particle Multiplicity Density at Midrapidity in Pb–Pb Col-lisions at 5.02 TeV √sNN= 5.02 TeV. Phys. Rev. Lett. 116, 222302 (2010). doi:10.1103/PhysRevLett.116.222302.arXiv:1512.06104 [hep-ex]
44. K. Werner, B. Guiot, I. Karpenko, T. Pierog, Analyzing radial flow features in p-Pb and p- p collisions at several TeV by studying identified-particle production with the event generator EPOS3. Phys. Rev. C 89, 064903 (2014). doi:10.1103/PhysRevC. 89.064903
45. A. Knospe, C. Markert, K. Werner, J. Steinheimer, M. Bleicher, Hadronic resonance production and interaction in partonic and hadronic matter in the EPOS3 model with and without the hadronic afterburner UrQMD. Phys. Rev. C 93, 014911 (2016). doi:10.1103/ PhysRevC.93.014911
46. M. Bleicher et al., Relativistic hadron-hadron collisions in the ultra-relativistic quantum molecular dynamics model. J. Phys. G. 25, 1859 (1999). doi:10.1016/S0370-2693(02)01334-5
ALICE Collaboration
D. Adamová87, M. M. Aggarwal91, G. Aglieri Rinella34, M. Agnello30,113, N. Agrawal47, Z. Ahammed139, S. Ahmad17,
S. U. Ahn69, S. Aiola143, A. Akindinov54, S. N. Alam139, D. S. D. Albuquerque124, D. Aleksandrov83, B. Alessandro113,
D. Alexandre104, R. Alfaro Molina64, A. Alici12,107, A. Alkin3, J. Alme21,36, T. Alt41, S. Altinpinar21, I. Altsybeev138,
C. Alves Garcia Prado123, M. An7, C. Andrei80, H. A. Andrews104, A. Andronic100, V. Anguelov96, C. Anson90,
T. Antiˇci´c101, F. Antinori110, P. Antonioli107, R. Anwar126, L. Aphecetche116, H. Appelshäuser60, S. Arcelli26, R. Arnaldi113,
O. W. Arnold35,97, I. C. Arsene20, M. Arslandok60, B. Audurier116, A. Augustinus34, R. Averbeck100, M. D. Azmi17,
A. Badalà109, Y. W. Baek68, S. Bagnasco113, R. Bailhache60, R. Bala93, A. Baldisseri65, M. Ball44, R. C. Baral57,
A. M. Barbano25, R. Barbera27, F. Barile32, L. Barioglio25, G. G. Barnaföldi142, L. S. Barnby34,104, V. Barret71,
P. Bartalini7, K. Barth34, J. Bartke120,a, E. Bartsch60, M. Basile26, N. Bastid71, S. Basu139, B. Bathen61, G. Batigne116,
A. Batista Camejo71, B. Batyunya67, P. C. Batzing20, I. G. Bearden84, H. Beck96, C. Bedda30, N. K. Behera50,
I. Belikov135, F. Bellini26, H. Bello Martinez2, R. Bellwied126, L. G. E. Beltran122, V. Belyaev76, G. Bencedi142, S. Beole25,
A. Bercuci80, Y. Berdnikov89, D. Berenyi142, R. A. Bertens53,129, D. Berzano34, L. Betev34, A. Bhasin93, I. R. Bhat93,
A. K. Bhati91, B. Bhattacharjee43, J. Bhom120, L. Bianchi126, N. Bianchi73, C. Bianchin141, J. Bielˇcík38, J. Bielˇcíková87,
A. Bilandzic35,97, G. Biro142, R. Biswas4, S. Biswas4, J. T. Blair121, D. Blau83, C. Blume60, G. Boca136, F. Bock75,96,
A. Bogdanov76, L. Boldizsár142, M. Bombara39, G. Bonomi137, M. Bonora34, J. Book60, H. Borel65, A. Borissov99,
M. Borri128, E. Botta25, C. Bourjau84, P. Braun-Munzinger100, M. Bregant123, T. A. Broker60, T. A. Browning98,
M. Broz38, E. J. Brucken45, E. Bruna113, G. E. Bruno32, D. Budnikov102, H. Buesching60, S. Bufalino30,25, P. Buhler115,
S. A. I. Buitron62, P. Buncic34, O. Busch132, Z. Buthelezi66, J. B. Butt15, J. T. Buxton18, J. Cabala118, D. Caffarri34,
H. Caines143, A. Caliva53, E. Calvo Villar105, P. Camerini24, A. A. Capon115, F. Carena34, W. Carena34, F. Carnesecchi26,12,
J. Castillo Castellanos65, A. J. Castro129, E. A. R. Casula23,108, C. Ceballos Sanchez9, P. Cerello113, B. Chang127,
S. Chapeland34, M. Chartier128, J. L. Charvet65, S. Chattopadhyay139, S. Chattopadhyay103, A. Chauvin35,97,
M. Cherney90, C. Cheshkov134, B. Cheynis134, V. Chibante Barroso34, D. D. Chinellato124, S. Cho50, P. Chochula34,
K. Choi99, M. Chojnacki84, S. Choudhury139, P. Christakoglou85, C. H. Christensen84, P. Christiansen33, T. Chujo132,
S. U. Chung99, C. Cicalo108, L. Cifarelli12,26, F. Cindolo107, J. Cleymans92, F. Colamaria32, D. Colella34,55, A. Collu75,
M. Colocci26, G. Conesa Balbastre72, Z. Conesa del Valle51, M. E. Connors143,b, J. G. Contreras38, T. M. Cormier88,
Y. Corrales Morales113, I. Cortés Maldonado2, P. Cortese31, M. R. Cosentino125, F. Costa34, S. Costanza136, J. Crkovská51,
P. Crochet71, E. Cuautle62, L. Cunqueiro61, T. Dahms35,97, A. Dainese110, M. C. Danisch96, A. Danu58, D. Das103,
I. Das103, S. Das4, A. Dash81, S. Dash47, S. De48,123, A. De Caro29, G. de Cataldo106, C. de Conti123, J. de Cuveland41,
A. De Falco23, D. De Gruttola12,29, N. De Marco113, S. De Pasquale29, R. D. De Souza124, H. F. Degenhardt123,
A. Deisting96,100, A. Deloff79, C. Deplano85, P. Dhankher47, D. Di Bari32, A. Di Mauro34, P. Di Nezza73, B. Di Ruzza110,
M. A. Diaz Corchero10, T. Dietel92, P. Dillenseger60, R. Divià34, Ø. Djuvsland21, A. Dobrin34,58, D. Domenicis Gimenez123,
B. Dönigus60, O. Dordic20, T. Drozhzhova60, A. K. Dubey139, A. Dubla100, L. Ducroux134, A. K. Duggal91, P. Dupieux71,
R. J. Ehlers143, D. Elia106, E. Endress105, H. Engel59, E. Epple143, B. Erazmus116, F. Erhardt133, B. Espagnon51,
![Fig. 8 (Left) ratio of " ∗± to ( and (Right) ratio of # ∗0 to # − mea- mea-sured in pp [ 17 , 32 , 37 , 39 ], d–Au [ 32 , 37 ] and p–Pb [ 10 , 24 ] collisions, as a function of ⟨dN ch/dηlab ⟩ measured at midrapidity](https://thumb-eu.123doks.com/thumbv2/123dokorg/5561541.66288/9.892.464.717.86.359/left-ratio-right-collisions-function-dηlab-measured-midrapidity.webp)
