DOI 10.1007/s11760-008-0071-6 O R I G I NA L PA P E R
Interactive visualization of video content and associated
description for semantic annotation
Marco Campanella · Riccardo Leonardi · Pierangelo Migliorati
Received: 20 February 2008 / Revised: 31 July 2008 / Accepted: 31 July 2008 / Published online: 30 August 2008 © The Author(s) 2008. This article is published with open access at Springerlink.com
Abstract In this paper, we present an intuitive graphic fra-mework introduced for the effective visualization of video content and associated audio-visual description, with the aim to facilitate a quick understanding and annotation of the semantic content of a video sequence. The basic idea consists in the visualization of a 2D feature space in which the shots of the considered video sequence are located. Moreover, the temporal position and the specific content of each shot can be displayed and analysed in more detail. The selected fea-tures are decided by the user, and can be updated during the navigation session. In the main window, shots of the consi-dered video sequence are displayed in a Cartesian plane, and the proposed environment offers various functionalities for automatically and semi-automatically finding and annotating the shot clusters in such feature space. With this tool the user can therefore explore graphically how the basic segments of a video sequence are distributed in the feature space, and can recognize and annotate the significant clusters and their structure. The experimental results show that browsing and annotating documents with the aid of the proposed visuali-zation paradigms is easy and quick, since the user has a fast and intuitive access to the audio-video content, even if he or she has not seen the document yet.
M. Campanella· R. Leonardi · P. Migliorati (
B
)DEA, University of Brescia, Via Branze, 38, 25123 Brescia, Italy e-mail: [email protected]
R. Leonardi
e-mail: [email protected] Present Address:
M. Campanella
Philips Research, Eindhoven, The Netherlands e-mail: [email protected]
Keywords Semantic video annotation· Visualization · Content organization· Content description · Browsing · Low-level features
1 Introduction
The extraction and exploitation of the relevant low-level fea-tures has been a point of crucial interest in several recent research works. Low-level features are in fact widely used for browsing, indexing and retrieval of text-based and mul-timedia documents [1], and for many other applications (see [2,3] for an overview of the subject).
The MPEG-7 standard has been therefore introduced to define what these features represent, and how they should be described and organized [4]. With the extraction from each multimedia document of these features we obtain a large amount of information, sometimes difficult to be effi-ciently used. What appears quite attractive is the use of these low-level descriptors to obtain quick representations and summaries of the content and structure of the considered audio-visual program (see [5–8] for an idea of the recent trends in video summarization and skimming).
In [9], we have shown that, by adequate presentation, low-level features carry instantly semantic information about the program content, given a certain program category, which may thus help the viewer to use such low-level information for navigation or retrieval of relevant events. This may be an attractive procedure with respect to using sophisticated search or navigation engines, especially if the program cate-gory is not adequately recognized. Following this idea, in [10–12] we have studied the problem of efficient visualiza-tion of low-level audio-visual features.
In this paper, we present the Future-Viewer framework that allows for an efficient visualization of audio-visual features
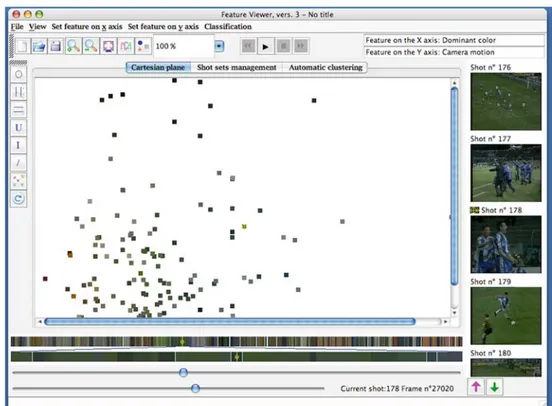
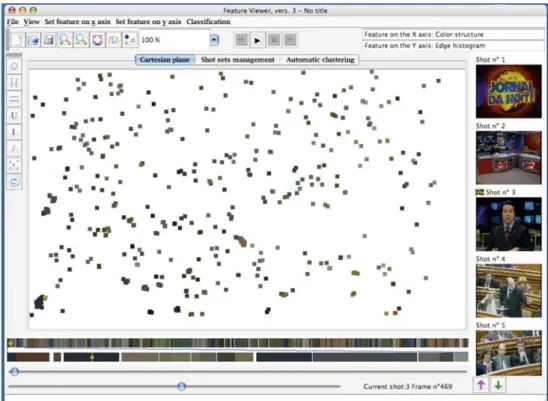
Fig. 1 A screen-shot of the proposed application
with different paradigms. In more detail, audio-visual docu-ments are presented as sequences of shots, and for each shot some MPEG-7 features are extracted and properly displayed. In this way, a shot becomes a point in the feature space, and the associated features represent its coordinates. These fea-tures are displayed in a 2D Cartesian plane, in which each of the two axes corresponds to a specific feature type (selected by the user), and the shots are positioned in this plane accor-ding to their associated feature values. A second window in which the shots are drawn in a temporal bar provides the user the information about the time dimension that lacks in the Cartesian plane. In a third window the key-frames asso-ciated to the current shots are displayed. A screen-shot of the proposed application is given in Fig.1.
Navigating jointly across these windows improves the accessibility of the documents, and speeds up the unders-tanding of its semantics. Moreover, video shots with similar content will sometimes appear clustered in the same regions of the feature plane. The system can automatically identify these clusters for subsequent annotation, producing an XML file in MPEG-7 format as output. With this tool the user can explore graphically how the basic segments of a sequence are distributed in the feature space, and can recognize and anno-tate the significant clusters and their structure. The experi-mental results show that browsing and annotating documents with the aid of the proposed visualization paradigms is easy and quick, since the user has a fast and intuitive access to
the audio-video content, even if he or she has not seen the document yet.
The proposed visualization tool is innovative since it includes
– Information about the temporal occurrence of the various shots and a free selection of its associated features, so as to generate meaningful clusters;
– Some basic indication of the shot semantics through a contextual presentation of key-frames.
The inclusion of temporal information is very important and helps the user to understand how the low-level features tem-poral evolution may be translated into a semantic change of the content, as it is often the case, thus easing any desi-red navigation and/or annotation task. To better support the user tasks, a series of tools for automatic selection or semi-automatic basic set operations is also included.
This work is collocated across the domains of video pro-cessing and human–computer interaction. As already men-tioned, the novelties that the present work carries along relate to the possibility of navigating a video document at the same time in the temporal domain, in the domain of the low-level features and in the shot semantics (key-frames) domain. This mixed navigation, built with video processing and human– computer interaction clues, is helpful in data visualization, video annotation, shot and scene classification, video brow-sing and retrieval.
Regarding the potential users of the proposed system, we can consider (to give some examples) the following: – Annotator: a user who works with multimedia documents
and has to semantically annotate audio-visual documents. Annotations have to be textual and have to reflect the semantic content and structure of the document. – Summarizer: a user who wants to manually produce short
previews of movies, like trailers or summaries. He needs to quickly navigate through a video document and have a quick glance of the semantic structure in the time-image-features domains.
– Media aesthetics researcher: a user who is interested in understanding how some semantics are rendered in a pro-fessional movie, for example which shot cut rhythms or shot transitions are used for some atmospheres, or which colors, or which semantic structure is adopted to represent a certain plot.
– Content analysis researcher: a user who wants to unders-tand the relations between low-level features and high-level semantic concepts in video documents.
The paper is organized as follows. In Sect.2an overview of the related literature is considered. In Sect.3the proposed environment is presented in more detail. In particular the major visualization, clustering and annotation capabilities are described and discussed. Section4 is devoted to show some possible uses of the proposed framework, focusing on temporal segmentation and semantic annotation. Concluding remarks are shown in the final section.
2 Related works
The use of a multi-dimensional feature space to visualize the content of a multimedia document has been already proposed in some systems, typically related to text-based searching and browsing systems, multimedia analysis and retrieval applications.
In [13], visualization is used for a text document retrie-val system. The documents retrieved during a query are dis-played as points in a 2D space, keywords are disdis-played as points too. The closer a document is to a keyword, the higher is the relevance that the neighboring keyword has to that document. This visualization paradigm, quite famous, is cal-led VIBE (VIsualization By Example). It is effective in visua-lizing large document collections without overloading the user’s attention; also, text documents with similar keywords relevances are put near each other to form clusters, which are perceived by the user as groups of semantic-related documents.
In [14], the goal of representing efficiently large collec-tions of text documents is achieved with other visualization
paradigms. One of them consists in representing documents on a line trying to maintain the same distances that the docu-ments have in the feature space. With this technique only little distances between documents are preserved, so this scheme is mainly useful to represent clusters of similar documents. According to another visualization scheme, text documents are represented in a 3D Cartesian space, where each of the three axes represent a keyword or a set of keywords. Again, the coordinate that a document has over one axis is calculated according to the relevance the corresponding keyword has to the whole document.
In [15], further solutions to the same problem are pro-posed. The text documents are automatically clustered according to the resemblance in their main keywords, and visualization paradigms are exploited in order to show the distribution of the clusters. This provides an overall perspec-tive to the results of a query, while the details of each cluster can be shown on demand.
Low-level features visualization has also been applied in image and video retrieval systems. In [16], a content-based image retrieval system is described in which the user can perform a query for an image, and visualize the set of results in a 2D projection of the feature space instead of a 1D list of images ordered by similarity. This helps the user to unders-tand the semantic relationships between the images better than merely looking to an ordered list of results. The mapping from the high-dimensional feature space to the plane is per-formed using the Principal Component Analysis (PCA).This technique achieves the best preservation of the inter-image distances in the 2D space.
In [17], another image retrieval system exploits the image projection on a 2D or on a 3D space. This system uses the relevance feedback, so the inter-image distances that the user sees in the projection represent no more the inter-image dis-tances in the feature space, but the resemblance between the images according to what is relevant for the user and his query.
All these systems use low-level features visualization to provide a feedback of the content and structure of a multime-dia document. This kind of exploitation of the low-level fea-tures comes from the idea that a graphical view of the content of a multimedia document can give a much clearer and intui-tive information about the contents than a list of numbers or a series of text captions or images. Moreover, our previous research work [9] showed that the configuration of low-level features in an audio-visual document often reflects the type of video program: news, action movies, sport or music pro-grams have different structure in their low-level features. In this sense, the adequate presentation of appropriate low-level features can greatly help the user to recognize the type and the structure of a program’s content.
Visualization can be also used and has been used for more general purposes too. The application proposed here is
quite general: it has been developed to study several possible applications of visualization. In this paper, we have mainly evaluated the usefulness of visualization for semi-automatic annotation and content browsing of multimedia documents. Other examples of annotation tools can be found in [18–20]. Considering for example the SVAT system (Semantic Video Annotation Tool, [20]), this is designed primarily for video annotation and includes mechanisms for spatial and temporal objects’ annotation. However the SVAT system sup-ports only manual annotation of shot clusters or of scenes. Our tool, on the other hand, is mainly targeted at suppor-ting semi-automatic annotation of shot clusters and scenes. Our tool automatically organizes the shots into clusters, and afterwards the user refines this structure.
Visualization tools can also be successfully used to help semantic video search (see for example the MediaMill seman-tic video search engine, [21,22]).
3 The proposed framework
In this section the main functionalities of the proposed sys-tem, named Future-Viewer, are described in some detail. As previously mentioned, the elementary data unit is the video shot; each audio-visual feature is therefore referred to a single shot of an audio-video sequence. Each shot is associated to a vector of feature values, one for each feature type that has been extracted. So, for example, in a video sequence each shot has its own value of spatial coherency, dominant color, intensity of motion, edge histogram, audio spectrum spread, audio spectrum centroid, and so on [4]. These feature values represent the coordinates that position the shot in the feature space, and each axis of this feature space is associated to a specific feature type.
The present section is structured as follows. In Sect.3.1, we explain the way videos are processed to be visualized in Future-Viewer. In Sect.3.2, we show the main visualization and navigation functions, whereas in Sect.3.3, we discuss the clustering and annotation functionalities of Future-Viewer. 3.1 Video analysis
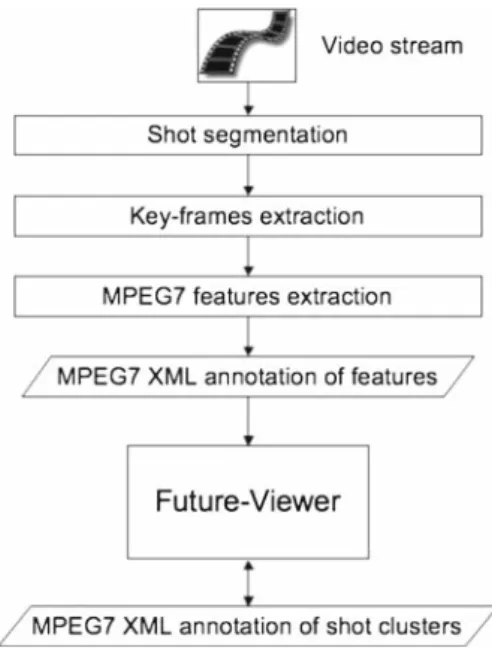
Figure2 shows a flow-chart of the analysis performed on audio-video documents before visualization in Future-Viewer. Initially, the video stream is segmented into the shots. Subsequently, a key-frame is extracted from each one of the shots, choosing the middle frame of each shot. Later on, from each shot a set of MPEG-7 features are extracted. Currently we extract the MPEG-7 color, texture, audio and motion fea-tures using XM, a demonstration program provided with the MPEG-7 standard. However, it is possible to extract any other feature a user may be interested in: Future-Viewer is designed to visualize a potentially unlimited set of features. The output
Fig. 2 Flow-chart of the video analysis process
of the features extraction phase is an XML file with the features described according to the MPEG-7 standard. This file is taken as input by Future-Viewer; subsequently the user can start the visualization of the video content and of the rela-ted features.
In the next subsections the visualization and annotation functionalities of our system will be explained in detail. In the bottom of Fig.2, we finally note that Future-Viewer can save and load XML MPEG-7 files with shot annotations. 3.2 The main visualization functions
In Fig.1the Graphic User Interface (GUI) of the proposed visual environment is shown. This is divided into three main regions, namely the Cartesian feature plane, the window with temporal information, and the key-frame window.
3.2.1 The Cartesian feature plane
The most important is the central region, in which a Cartesian plane is displayed. The two axes of the Cartesian plane correspond to the two feature types selected by the user. The user can select the feature type that is associated to each of the two axes; for example, the dominant color can be selected and associated with the x-axis (colors are ordered by the hue in the red-violet chromatic scale), while the intensity of camera motion can be associated with the y-axis.
The application draws the shots in the Cartesian plane as little squares, filled with the dominant color of the shot; so, in our example, the user will see the shots with hue tending to red and little camera motion near the origin of the axes,
whereas shots with high motion and violet hue will be placed in the upper right corner of the Cartesian plane. Zoom in and zoom out functions are also implemented to allow unders-tanding the little portions of the Cartesian plane.
It is also possible to choose the number of shots to be simultaneously shown in the Cartesian plane: these can be all the shots in the video or only a given number of shots contiguous in the time domain.
By observing the shot distribution in the feature space, the user can improve the understanding of their relationships, and can determine where the most significant shot clusters of a video program are. In fact, shots with similar low-level features will be drawn next to each other in the Cartesian plane; the user can then identify some of the meaningful pat-terns in a movie by looking at groups of shots close to or overlapping each other. Moreover, by associating different feature types to the Cartesian plane axes, it is possible to observe how the inter distances between the shots change. By selecting color or texture features, the user can, for example, observe if some shots have similar texture patterns, but dif-ferent colors, etc.
Instead of associating only two mono-dimensional fea-tures to the axes, an n-dimensional feature space can be defined with many features (whose MPEG-7 descriptors can consist of many coefficients). The n-dimensional space can be displayed in the Cartesian plane by reducing its dimen-sion to two. This dimendimen-sion scaling is currently performed by using the PCA [23]. This technique tries to solve the pro-blem of dimensionality reduction by finding the globally opti-mal solution, where “optiopti-mal” means that the mean square error between the inter-shots distances in the n-dimensional space, and the distances in the two-dimensional space are minimized. Other dimension reduction techniques could be employed instead of PCA, for features in which it is not advi-sable to minimize the mean square error to reduce dimen-sions.
Regarding the low-level features, the system is very flexible since it may use any type of real valued low-level fea-ture. In addition, the displayed features are normally selected dynamically by the user. The main focus however is not in the selection of the features, rather on whether those displayed can (in particular in terms of their temporal evolution) be used to capture any high-level or mid-level semantics of the program content, as will be described in more detail in the following sections.
3.2.2 The window with temporal information
In the bottom region of the GUI a color-bar is drawn. This is a bar representing the video in the temporal domain, where the leftmost regions of this bar represent earlier shots in the video, while the rightmost ones represent later shots. In this bar each portion corresponds to a shot and is drawn as a
color stripe with width proportional to the temporal dura-tion of the corresponding shot. These stripes are filled with the dominant color of the corresponding shot. So, in a sport video, soccer shots will be drawn as green stripes, whereas swimming shots will be drawn as blue stripes. The color-bar offers an intuitive view of the whole video sequence, and it is a powerful feature representation tool, as discussed in [24]. By clicking on a shot of the color-bar, a pointer appears in the Cartesian plane indicating the characteristic features of the selected shot. Looking at the bottom region of the GUI, we note that below the main color-bar (representing the whole movie), a second color-bar is displayed, which is a zoomed version of the main one. Below the color-bars two sliders are placed. The first can be used to browse the time position in the movie, the second controls the level of zoom the second color-bar has with respect to the first one.
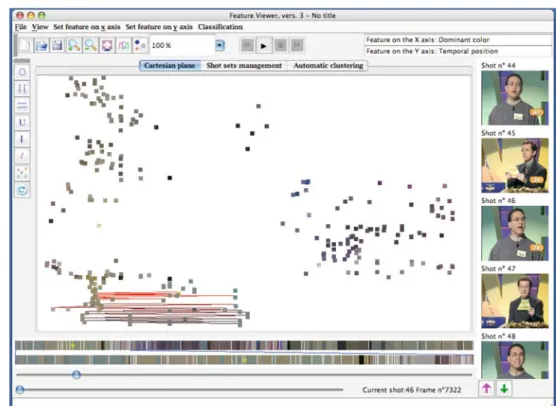
Moreover, considering the temporal information, there is the possibility of displaying the trajectory related to the tem-poral evolution of the document in the Cartesian plane, using the play button available in the user interface (see Fig.3). In this way, a trajectory that connects the various shots is dis-played in the Cartesian plane. Sometimes it is in fact quite informative to see how the data points jump around in the feature space as the video unfolds.
For example, in Fig.3it is clear that the zig-zag evolution is related to a dialogue in the considered video.
3.2.3 The key-frame window
In the right region of the GUI, key-frames related to the current shots are represented. The user can scroll these key-frames in temporal order or play every single shot. The Cartesian plane, the color-bar and the key-frame panel rep-resent the same semantic units, the shots, with three different visualization paradigms. Their behaviour associated to the user’s actions (e.g., mouse clicks) is designed to support a mixed navigation, accessing the same audio-visual document from different points of view. In fact, if the user clicks on a shot in one of the three windows (a little square in the Cartesian plane, a color stripe in the color-bar, a key-frame in the key-frame panel) a pointer will appear and will indicate where the shot is in the other two windows. It is possible therefore to identify the temporal position on the color-bar of a given square representing a shot on the Cartesian plane, or which key-frame is related to in the key-frame panel; or, vice versa, given a position in the color-bar, it is possible to find the corresponding shot in the feature plane.
The principal aim of these funcionalities is to increase the accessibility of the user to the document and help in unders-tanding its semantic structure, by displaying at the same time the inter-shot relationships in the time domain and in the fea-ture space domain.
Fig. 3 Temporal evolution displayed in the Cartesian plane
3.3 Clustering and annotation capabilities
3.3.1 Semi-automatic identification of shot collections While browsing the shots in the Cartesian plane, one consi-deration is of particular interest: in most cases shots form some clusters in the Cartesian plane, in the sense that, accor-ding to the selected features, similar shots appear near each other in the plane. The identification of meaningful shot clus-ters is a very important intermediate task in the process of segmentation and annotation of video sequences. The appli-cation implements two functions to identify meaningful shot clusters.
The first function consists of the following: by right-clicking on a little square in the Cartesian plane a menu pops up so that the user can choose to see the shots nearest in the plane to the clicked shot within a relative distance. These shots are displayed by showing their frames in the key-frames panel, ordered by distance. So the user can see if a cluster in the Cartesian plane contains semantically similar shots.
The same aim can be achieved with the second function: the user can draw with a drag of the mouse a circle on the Cartesian plane and see the shots that fall into it. The expe-rience has shown that searching for shots clusters in such a way gives good results: it is very frequent to find shots with the same semantic content type even if the user has not seen the video yet.
The application supports also the possibility to save and manage these highlighted similarities. Whenever the user finds a group of shots that have semantic similarities, he/she can decide to save them as a collector with a specific name, a description, and a creation date. In a tabbed panel put in the central region of the GUI (which is shown in Fig. 4) the user can see and modify all the shot collections that have been saved. In this way, it is possible, for example, to remove some shots in the cluster that are not semantically related to the others, or add other shots, or reduce the number of shots removing shots very similar, and so on. These shot collec-tions are then stored by the application in an XML file in MPEG7 format, in which all the shots belonging to a given set receive the same annotation.
In addition, the usual set operations like union, intersec-tion and difference between shot sets are supported. In this way it is easy to know, given an already indexed video docu-ment, which shots contain John and the sunset but do not contain a cat, belong to the second half of the film and have a tree or a flamingo, etc. Shot collections can also be visualized in the application.
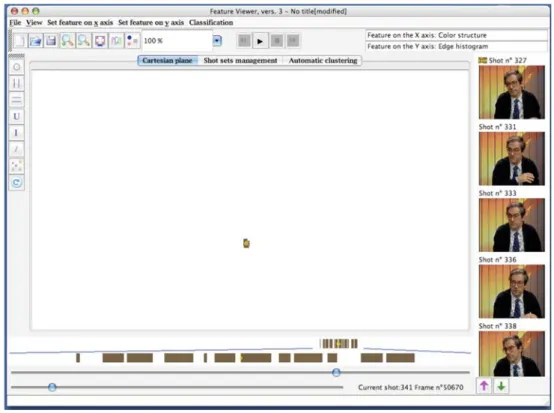
If a user wants to visualize a collection, its shots are shown in the Cartesian plane according to their position in the feature space, its key-frames are showed in the right panel, and the color-bar shows only the shots belonging to the current shot collection, leaving in white all the others. Watching the color-bar the user gets also an idea of where the shots are positioned in the time domain. The mixed navigation is permitted also
Fig. 4 Tabbed panel for shot sets managing
while viewing a single shot collection. If a shot is clicked in each of the three windows, the colored pointers indicate its position in all the windows. Figure5shows an example of visualization of a single shot collection.
3.3.2 Automatic identification of shot collections
To speed up the shot clustering and annotation process, the application is equipped with the possibility to automatically find clusters of shots in the feature space. The clustering process consists in the following steps:
1. The user selects a feature space in which shots are going to be clustered. This feature space is composed of as many MPEG-7 low-level features as desired. The shots’ temporal position too (measured in frames) can be consi-dered as a feature and included in the feature space. In this case shots will be clustered accordingly to their tem-poral distance too.
2. Shots are clustered in this feature space with the ISO-DATA algorithm [25]. This algorithm permits two approaches to the clustering problem: the user can give as a starting parameter the desired number of clusters and ask the algorithm to find the better clustering (as the k-means does), or the user can give the maximum stan-dard deviation that a cluster can have, and ask the algo-rithm to find the number of clusters that satisfy this
constraint. ISO-DATA finds the optimal number of clusters using heuristics to split clusters too large and lump clusters too close. By choosing the maximum stan-dard deviation that a cluster can have the user puts a threshold on the similarity that shots belonging to the same cluster have. This maximum standard deviation can be set with two parameters: the first (δd) indicates
the maximum standard deviation in the feature distances, the second (δt) indicates the maximum standard
devia-tion in the temporal posidevia-tion. The ISO-DATA algorithm has been chosen for the shot clustering problem because it does not require the number of clusters as a starting parameter. Instead, the algorithm assumes the maximum dimension of a cluster as initial parameter and then looks at the distribution of the shots in the feature space to iden-tify groups of shot sufficiently close to fall in a single cluster. In this way, the algorithm searches for the par-ticular structure of a given video, without assuming the number of clusters in this structure but making assump-tions only on the shape of these clusters.
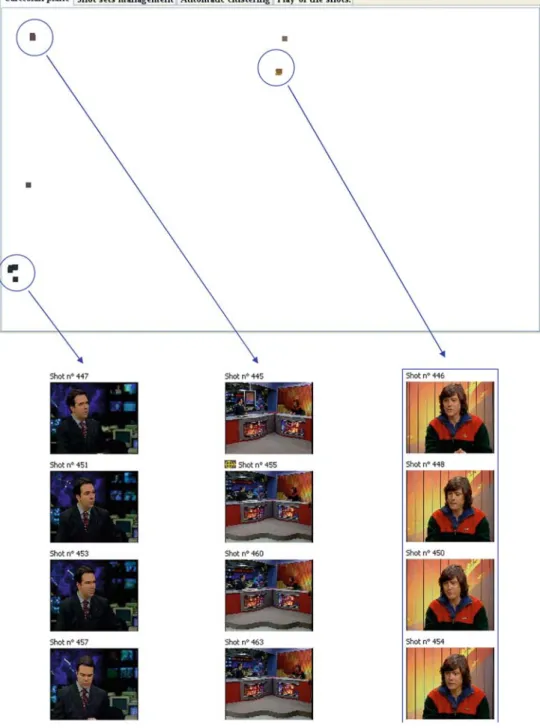
3. The obtained clusters are visualized mapping their cen-troids from the n-dimensional space to a 2D plane with the PCA. The clusters are represented as circles filled with the average dominant color of the shots in the clus-ter, and the cluster radius is proportional to the number of shots included. An example of clusters visualization is shown in Fig.6.
Fig. 5 Only one shot set visualized
Fig. 6 Cluster visualization with PCA
The visualization of the various clusters is another way to provide the user with useful information about the semantic structure of the considered multimedia document. Looking
for example at Fig.6, we can see that the clusters are mainly organized along an horizontal axis. Looking inside the clus-ters, it is possible to see that this axis coincides with the
temporal dimension, while the distribution that the clusters have around this axis is caused by the inter-cluster distances in the audio-visual feature domain. Watching at this repre-sentation, the user gets a rapid idea of the main clusters in a sequence and of their relative position in the time domain.
Moreover, we let the user specify which features should be taken into account in the clustering procedure. Instead of using a predefined set of features for clustering and hope for it to give good classifications for the most of movies and users, we propose an alternative approach: in our framework many classifications based upon different feature schemes can be quickly produced, navigated and compared, and the user can choose which best approximates his or her concept of seman-tic structure or the parseman-ticular application’s requirements.
4 Examples of use of the proposed framework
The proposed framework has been evaluated considering several audio-video sequences from the MPEG-7 test set. We tried to analyse and annotate these programs in order to understand the semantic structure of the document. To give some examples of possible uses, in this section we have considered the problems of temporal segmentation of a video sequence in terms of Logical Story Units (LSU), and the seg-mentation and annotation of a news program.
4.1 Temporal segmentation of the sequence
In order to assure a quick understanding and annotation, it is important to have good performance of the automatic cluste-ring process. A clustecluste-ring is useful if the clusters reflect the semantic and the logical structure of the original sequence. Through an attentive interaction with the system, it was pos-sible to judge that temporal position was one reference fea-ture which, when combined to others lead to relevant capfea-ture of the semantics. To support this an objective comparison has been performed to measure the correspondence of auto-matically generated LSUs from the resulting shot clustering with respect to a manually defined ground-truth. More spe-cifically, we have considered the automatic clustering obtai-ned by using as one of the features that define the Cartesian plane the temporal position of the shot. In this way we obtain and interesting and quick method for the temporal segmen-tation of a video sequence. In order to quantify the goodness of the automatic clustering, we segmented by hand the test sequences in LSU, and calculated to what extent the automa-tic clustering are consistent with this manual segmentation.
As defined in [26], a Logical Story Unit is “a series of contiguous shots that communicate a unified action with a common locale and time”. In [27], an algorithm for the auto-matic extraction of the LSU from a sequence of labelled
shots, once the shots have been clustered according to their similarity, is presented.
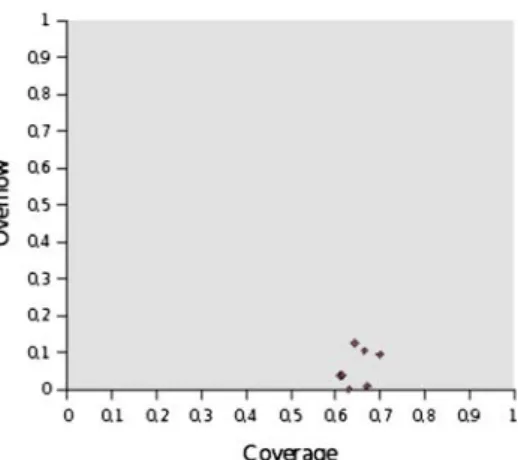
In order to evaluate the goodness of a clustering we extract from it the LSU structure using the method proposed in [27], and then compare this with the ground-truth LSUs. To perform this comparison we have used a standard method proposed in [26]. This method consists in calculating two parameters, coverage and overflow. Coverage reflects to what extent similar shots belong to the same automatically genera-ted LSU. To be more precise, coverage is the largest fraction of shots of a ground-truth’s LSU belonging to the same auto-matically generated LSU. Overflow measures to what extent shots belonging to the same automatically generated LSU are shared between more ground-truth LSUs. So, the optimum clustering is identified by coverage equal to 1 and overflow equal to 0.
Figure7a–c show the simulation results obtained consi-dering the sequences “Saber y ganar, Musica Si, Pepe y Pepa”. Each point in the graph represents a shot cluster. The results reported in Fig.7a were obtained from automatic clustering in the feature space formed by the temporal posi-tion of the shot and the color histogram (represented by the MPEG-7 descriptor “Scalable Color”). For the experimen-tal results shown in Fig. 7b the feature space was formed by the temporal position and the color distribution (speci-fied by the MPEG-7 descriptor “Color Structure”). In Fig.7c the clustering was performed on the feature space formed by the temporal position and the MPEG-7 descriptor “Edge Histogram”.
The results shown in this figure are consistent with the state of the art, in particular with the results described in [26]. So, we can obtain an intuitive visualization of the clusters of a video document and we know that this visualization reflects to a good extent the logical structure of the considered sequence.
As previously mentioned, our clustering procedure pro-duces results that are comparable with the state of the art in scene segmentation [26]. Anyway, the novelty of our approach does not lie in the performance of the automatic shot clustering, but in providing to the user an interface for semi-automatically determine and annotate a hierarchical structure for a sequence, as we show in the experimental section.
Annotating an audio-visual sequence with the aid of the automatic clustering and visualization facilities is therefore far easier and faster than using a by-hand annotation app-roach. In addition, as we have already pointed out, the pro-posed application gives the possibility to easily change the selected features and therefore guarantee the opportunity to evaluate quickly the effectiveness of a particular feature in the description of the considered document. This is particu-larly important when there are a lot of different features that describe the same document. As an example of this possibi-lity, it was possible to judge that temporal position was one
Fig. 7 Clustering results in terms of LSU: Coverage and Overflow (Sequence: “Saber y ganar, Musica Si, Pepe y Pepa”)
reference feature which, when combined to others, lead to relevant capture of the semantics. This semi-automatic fea-ture selection mechanism through relevance of its discrimi-native performance in terms of being able to capture changes in the semantics can be considered one of the key points of the proposed approach.
4.2 Segmentation and annotation of a news program In this section, we give a further example of the capabili-ties of the Future-Viewer framework. We describe how to use it in order to recognize the temporal structure of a news program. Figure8shows our tool visualizing this program. From this figure, we can see that a yellow pointer indicates the central image of the key-frames panel, the image with the anchorman. In the south-west part of the Cartesian plane
the same pointer illuminates a shot among a thick group of blue squares. We can suppose that all these shots contain the anchorman. By selecting with a circle this group of shots, we can see that this is true; the result of this selection is shown in Fig.9.
In this figure, the windows of the visualizer show only the shots belonging to the selected set. Watching at the color-bar, we understand that the anchorman’s shots are positioned with regularity along all the program. Thus we can suppose that segments containing the anchorman separate different news of the program, as usually happens in a news program. By selecting on the color-bar in each of the shots with the anchorman, we see the temporal neighbourhood of that shot. So, we can understand if diverse news are separated by the anchorman. Clearly, by using the various functionalities of Future-Viewer we can refine this draft segmentation without spending a lot of time, and with the accuracy we consider
Fig. 8 A screenshot of a news program
Fig. 9 Clustering results as displayed in the GUI
appropriate. At this point we have enough information for selecting and annotating the parts of the news program in an MPEG-7 file.
Once the various parts of the sequence have been anno-tated as shot collections, it is possible to classify and des-cribe the structure of the document at an higher level of
Fig. 10 Clusters annotation with the circle (Interview)
detail: the user can annotate the single shot clusters inside the collection. To do that, the user can first visualize the col-lection’s shots in the Cartesian plane. Here, similar shots fall near each other, so the user can see if the shots of a collec-tion are grouped in some sub-clusters. By drawing a circle on the Cartesian plane, the user can easily select and anno-tate these sub-clusters. Figures10and11show an example of this procedure. The considered parts of the original sequence contains an interview between the anchorman and a singer-songwriter, and some scenes from a soccer game.
5 Conclusions
In this paper, we have presented an intuitive graphic framework that allow a quick browsing and annotation of an audio-video sequence by means of an effective visualization of low-level audio-visual features, in a static and a dynamic dimension. The basic idea consists in visualising a 2D fea-ture space (customized by the user) in which the shots of the considered audio-video sequence are located. In this window, shots of the considered sequence are displayed in a Cartesian
Fig. 11 Clusters annotation with the circle (Soccer game)
plane, and the proposed system offers various functionalities for automatically and semi-automatically finding and anno-tating the shot clusters in such feature space. In addition, in a second window, the video shots are drawn in a temporal bar that provides the user with the information about the time dimension that lacks in the Cartesian plane. In a third window, the key-frames associated to the current shot and to some neighbouring shots are displayed, and the user can browse between them or play every single shot. With this tool the user can therefore explore graphically how the basic segments of an audio-visual sequence are distributed in the feature space,
and can easily recognize and annotate the significant clusters and their structure. Annotating documents with the aid of the proposed visualization paradigms is easy and quick, since the user has a fast and intuitive access to the audio-video content, even if he or she has not seen the document yet. To show some of the possible uses of the proposed framework, we have considered the problems of temporal segmentation of a video sequence in terms of Logical Story Units, and the segmentation and annotation of a news program. A running demonstrator of the system is available at the web address: http://www.ing.unibs.it/tlc/02_research/downloads.
Open Access This article is distributed under the terms of the Creative Commons Attribution Noncommercial License which permits any noncommercial use, distribution, and reproduction in any medium, provided the original author(s) and source are credited.
References
1. Chang, S.-F., Ma, W.-Y., Smeulders, A.: Recent advances and challenges of semantic image/video Search. In: Proceedings of ICASSP-2007. Hawaii, USA (2007)
2. Wang, Y., Liu, Z., Huang, J.-C.: Multimedia content analysis using both audio and visual clues. IEEE Signal Process. Mag. 17(11), 12– 36 (2000)
3. Izquierdo, E., et al.: State of the art in content-based analy-sis, indexing and retrieval. IST-2001-32795 SCHEMA Del. 2.1, Feb. 2005.http://www.iti.gr/SCHEMA
4. Manjunath, B.S., Salembier, P., Sikora, T.: Introduction to MPEG-7: Multimedia Content Description Language. Wiley, London (2002)
5. Ngo, C.-W., Ma, Y.-F., Zhang, H.-J.: Video summarization and scene detection by graph modeling. IEEE Trans. Circuits Syst. Video Technol. 15(2), 296–305 (2005)
6. Takahashi, Y., Nitta, N., Babaguchi, N.: Video summarization for large sports video archives. In: Proceeding of ICME-2005. Amster-dam, The Netherlands (2005)
7. Li, Y., Lee, S.-H., Yeh, C.-H., Jay Kuo, C.-C.: Techniques for movie content analysis and skimming. IEEE Signal Process. Mag. 23(2), 79–89 (2006)
8. Wang, T., Mei, T., Hua, X.-S., Liu, X.-L., Zhou, H.-Q.: Video col-lage: a novel presentation of video sequence. In: Proceedings of ICME-2007. Beijing, China, pp. 1479–1482 (2007)
9. Leonardi, R., Migliorati, P.: Semantic indexing of multimedia documents. IEEE Multimedia 9(2), 44–51 (2002)
10. Campanella, M., Leonardi, R., Migliorati, P.: Future-Viewer: an efficient framework for navigating and classifying audio-visual documents. In: Proceedings of WIAMIS-2005. Montreaux, Switzerland (2005)
11. Campanella, M., Leonardi R., Migliorati, P.: An intuitive gra-phic environment for navigation and classification of multi-media documents. In: Proceedings of ICME-2005. Amsterdam, The Netherlands (2005)
12. Campanella, M., Leonardi, R., Migliorati, P.: The future-viewer visual environment for semantic characterization of video sequences. In: Proceedings of ICIP-2005. Genoa, Italy (2005)
13. Olsen, K.A., Korfhage, R.R., Sochats, K.M., Spring, M.B., Williams, J.G.: Visualization of a document collection: the VIBE system (1992). http://Itl13.exp.sis.pitt.edu/Website/Webresume/ VIBEPaper/VIBE.htm
14. Cugini, J., Piatko, C., Laskowsky, S.: Interactive 3D visualiza-tion for document retrieval. In: Proceedings of ACM CIKM-1996. Rockville, USA (1996)
15. Carey, M., Heesch, D.C., Ruger, S.M.: Info navigator: a visualiza-tion tool for document searching and browsing. In: Proceedings of DMS-2003. Miami, USA (2003)
16. Moghaddam, B., Tian Q., Huang, T.S.: Spatial visualization for content-based image retrieval. In: Proceedings of ICME-2001. Tokyo, Japan (2001)
17. Meiers, T., Keller, S., Sikora, T.: Hierarchical image browsing system with embedded relevence feedback. In: Proceedings of WIAMIS-2003. London, UK (2003)
18. Lin, C.-Y., Tseng, B.L., Smith, J.R.: VideoAnnEx: IBM MPEG7 annotation tool for multimedia indexing and concept learning. In: Proceedings of CME-2003. Baltimore, USA (2003)
19. Djordjevic, D., Izquierdo, E.: An object- and user-driven system for semantic-based image annotation and retrieval. IEEE Trans. Circuits Syst. Video Technol. 17(3), 313–323 (2007)
20. Rehatschek, H., Bailer, W., Neuschmied, H., Ober, S., Bischof, H.: A tool supporting annotation and analysis of video. Booktitle: Reconfigurations. Interdisciplinary Perspectives on Religion in a Post-Secular Society, Vienna, pp. 253–268 (2007)
21. Worring, M., Snoek, C.G.M., de Rooij, O., Nguyen, G.P., Smeulders, A.W.M.: The mediamill semantic video search engine. In: Proceedings of ICASSP-2007. Hawaii, USA (2007)
22. Snoek, C.G.M., Worring, M., de Rooij, O., van de Sande, K.E.A., Rong, Y., Hauptman, A.G.: VideOlympics: real-time evalua-tion of multimedia retrieval systems. IEEE Multimedia 15(1), 86–91 (2008)
23. Jackson, J.E.: A User’s Guide to Principal Components. Wiley, London (1991)
24. Barbieri, M., Mekenkamp, G., Ceccarelli, M., Nesvadba, J.: The color browser: a content driven linear video browsing tool. In: Proceedings of ICME-2001. Tokyo, Japan (2001)
25. Tou, J.T., Gonzalez, R.C.: Pattern Recognition Principles. Addison-Wesley, Reading (1974)
26. Vendrig, J., Worring, M.: Systematic evaluation of logical story unit segmentation. IEEE Trans. Multimedia. 4(4), 492–499 (2002) 27. Yeung, M.M., Yeo, B.-L.: Video visualization for compact presen-tation and fast browsing of pictorial content. IEEE Trans. Circuits Syst. Video Technol. 7(5), 771–785 (1997)