HE-FUS3
Experimental Campaign for the Assessment
of
Thermal-Hydraulic
Codes: Pre-Test Analysis and Test Specifications.
Descrittori
Tipologia del documento: Rapporto Tecnico
Collocazione contrattuale: Accordo di Programma ENENMSE Argomenti trattati: Generation IVreactors
Reattori nucleari a gas Sicurezza nucleare Analisi incidentale Sommario
This report deals with the design 01an experimentalcampaignto be conducted in the HE-FUS3loop (GR BRASIMONE)in order to providean experimentaldata base lor the assessment 01thermal-hydrauliccodes usedlor HTRand VHTRdesignand salety analysis.
In orderto supportthe delinition01the test matrixapre-test activityhas beencarriedout with the T/H system code RELAP5.To this aim a RELAP5mode!01the loop (the relatedinput deck is providedin attachmentA 01this report) has been developed taking advantage01the results 01previous assessmentactivities and aiready available experimental data. The pre-test activity has allowed delining a seI 01 transients representative01 operationaland accidentconditionsthat ara 01particularmeaninglor the assessmentof T/H codes: the pianI start-up by steps. 2 Loss 01Flow Accidentswith a different dynamic 01the accidental evento2 Loss01GoolantAccidents at differentloop pressure.
On the basis 01the calculationresults reported in the chapter 4 it has been possibleto draw up the test specilicationsin
attachment B takingintoaccountthe requirementlor the operation01the HE-FUS3joop and
the actualconditions01the instrumentationimplementedin the lacility.Note:
Copia n. In carico a: 2 NOME FIRMA 1 NOME FIRMAO EMISSIONE 1&12/2008 NOME M. Polidori P. Meloni R. Tinti
FIRMA ,/'"-A'
Q\
-
.:.Kt:
ATable of Contents
Table of Contents
1. Introduction
2. Description of HE-FUS3 Facility
2.1 General Layout
2.2 Major components
2.3 Instrumentations
3. Numerical Model
3.1 RELAP5 Computer Code3
3.2 Nodalization Scheme
3.3 Modeling Assumptions
3.3.1 Economizer
3.3.2 Compressor
3.3.3 Air Cooler
3.3.4 Electrical Heaters
3.3.5 7-pin Test Section
3.3.6 Regulation Valves
3.3.7 Control System
3.3.8 Heat Losses
3.3.9 Helium Leakage
3.4 Modeling Assumptions
3.4.1 Recalculation of the 40%ST19-02-99 steady state
3.4.2 Recalculation of the 30%ST19-02-99 steady state
4. Pre-test Calculations
4.1 Start-up by Steps
4.2 LOFA through By-pass Valve Opening
4.3 LOFA through Compressor Speed Reduction
4.4 LOCA at 35 bar Pressure
5. References
Appendix A: HE-FUS3 Loop Input Deck for RELAP5 Code
Appendix B: Test Specifications
1.
Introduction
HE-FUS 3 is a helium facility that was designed and constructed at ENEA CR Brasimone in mid
90’s for the thermal-mechanical testing of prototypical module assemblies of the DEMO reactor.
Within the frame of the SP Safety (WP1) of the RAPHAEL Integrated Project, ENEA has offered
the experimental data coming from a testing program carried out at the end of the nineties, for a
benchmark exercise aimed at the validation of the system transient analysis codes for Very High
Temperature Reactors (VHTR).
This benchmark exercise presently in progress has revealed, in agreement with previous
assessment activity conducted on the same data, the large uncertainty that affect the data
themselves. For this reason a new experimental campaign in the HE-FUS3 facility has been
proposed within the framework of the ENEA-MSE research program with the objective to
provide a reliable experimental data base for the assessment of thermal-hydraulic codes used for
HTR and VHTR design and safety analysis. This new campaign will be also addressed to a
complete characterization of the loop.
In order to support the definition of the test matrix a pre-test activity has been carried out with the
T/H system code RELAP5. To this aim a RELAP5 model of the loop (the related input deck is
provided in attachment A of this report) has been developed taking advantage of the results of
previous assessment activities and already available experimental data. The pre-test activity has
allowed defining a set of transients representative of operational and accident conditions that are
of particular meaning for the assessment of T/H codes: the plant start-up by steps, 2 Loss of Flow
Accidents with a different dynamic of the accidental event, 2 Loss of Coolant Accidents at
different loop pressure.
On the basis of the calculation results reported in the chapter 4 it has been possible to draw up the
test specifications in attachment B taking into account the requirement for the operation of the
HE-FUS3 loop and the actual conditions of the instrumentation implemented in the facility.
2.
Description of the HE-FUS3 facility
2.1 General Layout
Within the frame of the European Fusion Technology Program, ENEA in 1993 obtained an
economic support from EU for the construction of a helium facility, called HE-FUS3 [1]. The
facility, which had been planned for the thermal mechanical testing of prototypical module
assemblies for the DEMO reactor, was chosen for the selected European Helium Cooled Pebble
Bed (HCPB) Blanket design to be tested on ITER reactor. The facility, also defined as the
European Helium Cooled Blanket Test Facility, is located at the ENEA Brasimone Laboratories
in Italy.
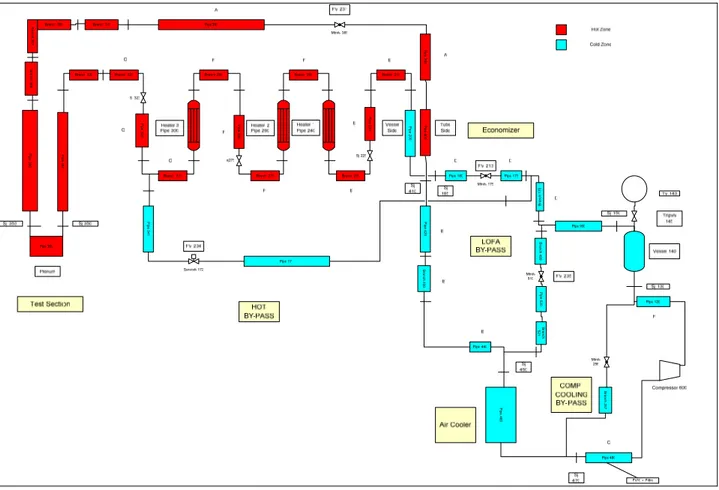
Its eight loop configuration [2], shown in Fig. 2.1, supplies the helium flowrate to an
experimental Test Section, where the mock-up of the HCPB Blanket can be tested. The purpose
of the eight-shaped closed loop arrangement is to separate two zones at different temperatures,
the cold one including the compressor and the hot one the Test Section. An economizer, placed at
the crossover point, recovers the gas enthalpy before recirculating the helium through the
compressor. Thereby it has been possible to reduce both the need for external power to get the
required temperature at the Test Section inlet and the cooler size to reduce the compressor inlet
temperature to the level of its maximum continuative operating temperature. The main
performances expected for the facility are reported in Tab. 2.1.
The piping overall length is about 80 m, with an integral volume of 4m3 including 3m3 of the
expansion tank and a weight of about 15 ton. The diameters of the main pipes were preliminary
fixed at 4” (sch. 80) for the cold zone et 5” (sch.80) for the hot zone in order to limit at 20 m/s the
helium velocity in the loop. The piping material is stainless steel AISI 316. Contact temperatures
are reduced below 50 °C by means of heat insulator with special asbestos-free material, 60 to 160
mm in thickness.
Parameter Design Value
Max Pressure MPa 10.5
Max Temperature °C 530
Inlet Compressor Max Temperature °C 100
Compressor Helium Flow Rate kg/s 0.5-0.35
Max Compressor Speed rpm 18000
Max Compressor Head MPa 0.5
Compressor Electrical Power kVA 136
Heaters Electrical Power kW 210
Economizer Thermal Power kW 564
Air-Cooler Thermal Power kW 280
Helium Tank Capacity m3 3
Test Section Electrical Power kW 350
Helium Leak mbar l/s 2 10-3
Fig. 2.1 – HE-FUS3 P&I
VACUUM
HOT TEST SECTION
PURIFICATION IN
GAS ANL VACUUM
FV 231 HV 252 HV 250 FV 213 FV 235 HV 243 PSV 208 FV 249 FV 9 FV6 FV 247 FV 5 FV 4 HV 300 PRV 244 HV 2 HV 289 FV 8 FV 10 PSV PSV E219/1 HEATER COLD TEST SECTION
HELIUM DISCHARGE SYS
HE-BOTTLES
HELIUM FILLING SYS MIXER E219/2 E219/3 FT 22 E 240 COOLER V 205 TANK E214 ECONOMIZER FT 212 PCV 248 S 260 FILTER K200 PC 24 FV 230 MIXER HV 251 FV 234 COMPRESSOR
2.2 Major
Components
The main features of the loop components relevant for the code modeling (Fig. 2.2) are
described in Tabs. 2.2 to 2.9, they are the following:
•
A prototypical compressor (K200) with pneumostatic helium shaft supporting system
developed by RTM company that has the electrical motor completely immersed in the
helium flow. The electrical motor is provided with an inverter driving system capable of
controlling the frequency in the range 5-300 Hz, driving the rotor speed at 300-18000
rpm.
•
Three modules of a flanged immersion rod bundle electrical heater (E219-1/2/3) that
can supply 70 kW of nominal power each (210 kW in total). The electrical supply,
control and monitoring is independent for each module.
•
A high efficiency (>79%), helium-helium economizer (E214) that has a tube shell
geometry with vertical axis. The hot helium coming from the Test Section flows
through a bundle of straight tubes that are welded between two tube plates and
immersed in a cylindrical pressure vessel. The cold helium counter-flows in the shell
zone where a series of diaphragm sheets allow improving the global thermal exchange.
•
A counter flow helium-air heat exchanger that is located at the compressor inlet in order
to reduce the corresponding helium temperature below the maximum design value
(100°C). The helium flows inside the tube bundle whilst the air flows outside the
external surface of the tubes. A helicoidal stainless steel sheet is welded on the outside
surface of the tube to increase the overall thermal conductance.
•
An expansion vessel that is located at the compressor outlet, in order to dump pressure
and flow fluctuations during loop operation. The vessel is an 8 m high vertical cylinder
with a volumetric capacity of 3 m
3.
•
Two mixers that are used in the loop for the temperature mixing between different main
and by-pass flow rates.
•
Four globe valves (FV 213, FV 234, FV 235 and FV 10) that are used for the loop
regulation.
•
A 7-pin bundle electrically heated Test Section with 50 kW of nominal power each. The
heated pins are made of Ni-Cr spiral wires insulated by MgO powders with a Ni-Fe-Cr
alloy cladding. The helium enters in the annular space between the tubular pressure
vessel of the dummy mock-up and the Test Section pipe, flows down to the TS inlet
then flow up within the pipe around the pins. The bundle is appropriately equipped with
thermocouples in order to monitor the transient temperature field during the accident
simulations planned in the facility.
Operation and control of the system are guaranteed through several auxiliary systems which
are not relevant for the modeling: passive safety system, filling and pressure control system,
vacuum preservation system, gas analysis and facility control system. The loop is also
provided with 5 on/off valves for the safety control.
Fig. 2.2 – HE-FUS3 Vertical View
Economizer ON/OFF Valve Heater 1 Heater 2 Heater 3 Tank Compressor He-Air Exchanger Economizer ON/OFF Valve Heater 1 Heater 2 Heater 3 Tank Compressor He-Air Exchanger Heater 3 ON/OFF Valve He-Air Exchanger Economizer Heater 3 ON/OFF Valve He-Air Exchanger EconomizerMaximum Design Helium Temperature °C 160
Maximum Design Helium Pressure MPa 10.5
Design Flowrate kg/s 0.05 -0.35
Vessel Inside Diameter mm 350
Vessel Sheet Thickness mm 45
Vessel Total High mm 700
Inlet Design Pressure MPa 6.0
Outlet Design Pressure MPa 6.5
Maximum Design Flowrate kg/s 0,35
Maximum Design Inlet Temperature °C 100
Mechanical Power kW 90
Electrical Motor Power kVA 110
Maximum Inverter Current A 210
Maximum Inverter Frequency Hz 400
Impeller Maximum Speed rpm 18000
Impeller Diameter mm 230
Motor Shaft Diameter mm 65
Rotor Diameter mm 130
Diametrical rotor Clearances mm 1
Bearing clearances µm 40
Tab. 2.2 – Compressor Main Design Parameters
Parameter Design Value
Nominal Helium Inlet Temperature °C 420
Nominal Helium Outlet Temperature °C 525
Design Helium Temperature °C 530
Design Cladding Temperature °C 560
Design Helium Pressure MPa 10.5
Design Helium Flowrate kg/s 0.35
Electrical Power kW 70
Overall Heat Transfer Surface m2 5.09
Overall Thermal Conductance W/m2K 809
Design Pressure Drop Pa 1011
Rod Diameter mm 15
Nr U-bent Rods 30
Rod Heated Length mm 1800
Rod Cold Leg Length mm 300
Nr of Diaphragm Plates 12
Diaphragm Pitch mm 145
Vessel Internal Diameter mm 270
Diaphragm Diameter mm 268
Diaphragm Thickness mm 3
Parameter Design Value
Cold Helium Inlet Temperature °C 130
Cold Helium Outlet Temperature °C 440
Hot Helium Inlet Temperature °C 530
Hot Helium Outlet Temperature °C 220
Maximum Design Pressure MPa 10,5
Cold Side Pressure Drop Pa 1660
Hot Side Pressure Drop Pa 212
Overall Heat Transfer Surface m2 27.0
Overall Thermal Conductance W/m2K 258
½” Tube Multiplicity 73
½” Tube Outside Diameter mm 21.3
½” Tube Thickness mm 1.65
3/8” Tube Multiplicity 12
3/8” Tube Outside Diameter mm 17.2
3/8” Tube Thickness mm 1.65
Vessel Active Length mm 4920
Diaphragm multiplicity 18
Diaphragm Thickness mm 3
Diaphragm Diameter mm 266
Tubes Support Plate Thickness mm 23
Tab. 2.4 – Economizer Main Design Parameters
Parameter Design Value
Nominal Helium Inlet Temperature °C 240
Nominal Helium Outlet Temperature °C 100
Design Helium Temperature °C 240
Design Helium Pressure MPa 10.5
Design Helium flow rate kg/s 0.35
Design Helium Pressure Drop Pa 4000
Nominal Air Inlet Temperature °C 30
Nominal Air Outlet Temperature °C 70
Design Air pressure MPa 1
Design Air Flowrate kg/s 6.1
Design Air Pressure Drop Pa 1200
Nominal Thermal Power kW 280
Overall Heat Transfer Surface m2 165
Overall Thermal Conductance W/m2 K 400
Nr of ½” Finned Tubes 22
Finned Tube Outside Diameter mm 21.3
Fin thickness mm 0.4
Fin pitch mm 3.4
Fan Electrical Power kW 15
Fan Speed rpm 50-3000
Max Design Pressure MPa 10.5
Max Design Temperature °C 160
Maximum Design Flowrate kg/s 0.35
Vessel Capacity m3 3
Vessel Outside Diameter mm 890
Vessel Inside Diameter mm 800
Vessel Total Height mm 6638.2
Tab.2.6 – Expansion Vessel Main Design Parameters
Parameter Design Value
Cold Mixer
Nominal Cold Helium Temperature °C 130
Nominal Hot Helium Temperature °C 220
Design Helium Pressure MPa 10.5
Design Helium Flowrate kg/s 0.35
Hot Mixer
Nominal Cold Helium Temperature °C 130
Nominal Hot Helium Temperature °C 530
Design Helium Pressure MPa 10.5
Design Helium Flowrate kg/s 0.35
Tab. 2.7 – Mixers Main Design Parameters
Nr Valve Builder LINE Ø operation
FV 213 NUOVO PIGNONE D 1 ½” Regulated
FV 234 “ I 1 ½” “
FV 235 “ H 1 ½” “
FV 10 “ C 1 ½” “
Tab. 2.8 –Main Valves Data Sheet
Parameter Design Value
Nominal Helium Inlet Temperature °C 420
Nominal Helium Outlet Temperature °C 525
Design Pressure MPa 20
Effective Power per Rod kW 40
Max Cladding Temperature °C 950
Max Heat Flux W/cm2 110.6
Heated Length mm 2000
Rod Diameter mm 9.5
Clad thickness mm 1
TS Pipe 1 ½” (sch.10)
Mock-up Tubular Vessel 3” (sch. 80)
2.3 Instrumentations
The instrumentation map of the facility is shown in Fig. 2.3 [3]. In the following is given a brief
description of the instrumentation installed in the main loop:
•
Flow measurements - The volumetric flow is measured with Vortex flow meters of 2”. In
order to compute the mass flowrate, the signal is integrated with measurements of
temperature and pressure upstream of the flow meter location. The accuracy is better than
0.5% for a flowrate above 10% of the measuring range.
•
Temperature measurements - The temperature sensors are thermocouples ANSI K
(NiCr/NiAl) for temperature values higher than 200 °C and Platinum Thermoresistances
ANSI PT 100 for lower temperature values. The accuracy is better than 0.5% on the
measuring point.
•
Pressure measurements - The pressure measurements are based on diaphragm cell
transmitters. Only one manometer, mounted on the expansion tank, is a Bourdon type
without signal transmission. The accuracy of the gauges is better than 0.5% on the
measuring point.
•
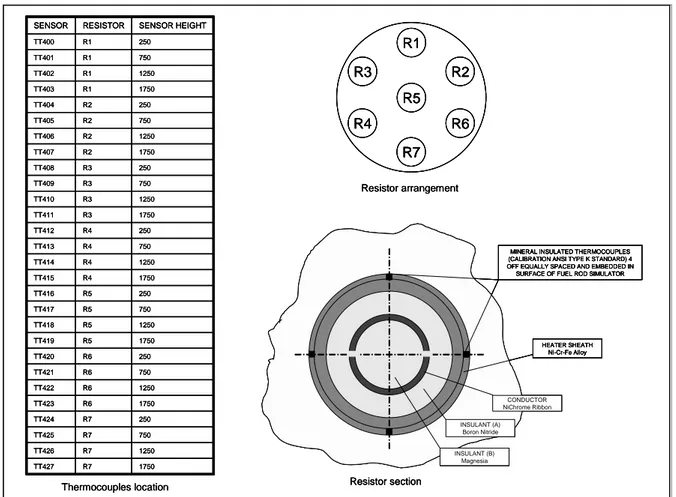
7-pin bundle thermocouples. – 28 thermocouples are inserted in the cladding of the heating
pins at different elevations and positions in the bundle (Fig. 2.4). In previous test 7 signals
were related to these thermocouples (TT400, TT403, TT407, TT411, TT415, TT419,
TT427).
1250 R5 TT418 1750 R5 TT419 250 R6 TT420 750 R6 TT421 1250 R6 TT422 1750 R7 TT427 1250 R7 TT426 750 R7 TT425 250 R7 TT424 1750 R6 TT423 750 R5 TT417 250 R5 TT416 1750 R4 TT415 1250 R4 TT414 750 R4 TT413 250 R4 TT412 1750 R3 TT411 1250 R3 TT410 750 R3 TT409 250 R3 TT408 1750 R2 TT407 1250 R2 TT406 750 R2 TT405 250 R2 TT404 1750 R1 TT403 1250 R1 TT402 750 R1 TT401 250 R1 TT400 SENSOR HEIGHT RESISTOR SENSOR R5 R7 R1 R3 R2 R4 R6 Resistor arrangement
Thermocouples location Resistor section
MINERAL INSULATED THERMOCOUPLES (CALIBRATION ANSI TYPE K STANDARD) 4 OFF EQUALLY SPACED AND EMBEDDED IN SURFACE OF FUEL ROD SIMULATOR
HEATER SHEATH Ni-Cr-Fe Alloy CONDUCTOR NiChrome Ribbon INSULANT (A) Boron Nitride INSULANT (B) Magnesia 1250 R5 TT418 1750 R5 TT419 250 R6 TT420 750 R6 TT421 1250 R6 TT422 1750 R7 TT427 1250 R7 TT426 750 R7 TT425 250 R7 TT424 1750 R6 TT423 750 R5 TT417 250 R5 TT416 1750 R4 TT415 1250 R4 TT414 750 R4 TT413 250 R4 TT412 1750 R3 TT411 1250 R3 TT410 750 R3 TT409 250 R3 TT408 1750 R2 TT407 1250 R2 TT406 750 R2 TT405 250 R2 TT404 1750 R1 TT403 1250 R1 TT402 750 R1 TT401 250 R1 TT400 SENSOR HEIGHT RESISTOR SENSOR R5 R7 R1 R3 R2 R4 R6 Resistor arrangement
Thermocouples location Resistor section
MINERAL INSULATED THERMOCOUPLES (CALIBRATION ANSI TYPE K STANDARD) 4 OFF EQUALLY SPACED AND EMBEDDED IN SURFACE OF FUEL ROD SIMULATOR
HEATER SHEATH Ni-Cr-Fe Alloy CONDUCTOR NiChrome Ribbon INSULANT (A) Boron Nitride INSULANT (B) Magnesia 1250 R5 TT418 1750 R5 TT419 250 R6 TT420 750 R6 TT421 1250 R6 TT422 1750 R7 TT427 1250 R7 TT426 750 R7 TT425 250 R7 TT424 1750 R6 TT423 750 R5 TT417 250 R5 TT416 1750 R4 TT415 1250 R4 TT414 750 R4 TT413 250 R4 TT412 1750 R3 TT411 1250 R3 TT410 750 R3 TT409 250 R3 TT408 1750 R2 TT407 1250 R2 TT406 750 R2 TT405 250 R2 TT404 1750 R1 TT403 1250 R1 TT402 750 R1 TT401 250 R1 TT400 SENSOR HEIGHT RESISTOR SENSOR R5 R7 R1 R3 R2 R4 R6 R5 R7 R1 R3 R2 R4 R6 Resistor arrangement
Thermocouples location Resistor section
MINERAL INSULATED THERMOCOUPLES (CALIBRATION ANSI TYPE K STANDARD) 4 OFF EQUALLY SPACED AND EMBEDDED IN SURFACE OF FUEL ROD SIMULATOR
HEATER SHEATH Ni-Cr-Fe Alloy CONDUCTOR NiChrome Ribbon INSULANT (A) Boron Nitride INSULANT (B) Magnesia
MINERAL INSULATED THERMOCOUPLES (CALIBRATION ANSI TYPE K STANDARD) 4 OFF EQUALLY SPACED AND EMBEDDED IN SURFACE OF FUEL ROD SIMULATOR
HEATER SHEATH Ni-Cr-Fe Alloy CONDUCTOR NiChrome Ribbon INSULANT (A) Boron Nitride INSULANT (B) Magnesia
3. Numerical
Model
3.1 RELAP5 Computer Code
RELAP5 [4] is a thermal-hydraulic system code originally developed at the Idaho National
Engineering Laboratory (INEL) for the US Nuclear Regulatory Commission (NRC) and
extensively validated for Light Water Reactors, which potentially has a large flexibility to treat
different fluids. ENEA is already using this peculiarity for the study of Accelerator Driven
System cooled with heavy liquid metals (Lead and LBE).
The Relap5 program is based on a non-homogeneous and non-equilibrium model for the
two-phase system that is solved by a fast, partially implicit numerical scheme to permit economical
calculation of system transients. The objective of the Relap5 development effort from the outset
was to produce a code that included important first-order effects necessary for accurate prediction
of system transients but that was sufficiently simple and cost effective so that parametric or
sensitivity studies were possible. The code includes many generic component models from which
general systems can be simulated. The component models include pumps, valves, pipes, heat
releasing or absorbing structures, reactor point kinetics, electric heaters, jet pumps, turbines,
separators, accumulators, and control system components. In addition, special process models are
included for effects such as form loss, flow at an abrupt area change, branching, choked flow,
boron tracking, and non condensable gas transport.
The system mathematical models are coupled into an efficient code structure. The code includes
extensive input checking capability to help the user discover input errors and inconsistencies.
Also included are free-format input, restart, re-nodalization, and variable output edit features.
These user conveniences were developed in recognition that generally the major cost associated
with the use of a system transient code is in the engineering labor and time involved in
accumulating system data and developing system models, while the computer cost associated
with generation of the final result is usually small. The development of the models and code
versions that constitute Relap5 has spanned approximately 17 years from the early stages of
Relap5 numerical scheme development to the present.
Relap5 represents the aggregate accumulation of experience in modeling reactor core behavior
during accidents, two-phase flow processes, and LWR systems. The development of the last
version Relap5/MOD3.3 for LWRs systems ha benefited from extensive application and
comparison to experimental data in the LOFT, PBF, Semiscale, ACRR, NRU, and other
experimental programs.
An extension of the RELAP5/Mod3.1 version, called ATHENA/Mod16, was developed at INEL
for thermal-hydraulic analyses of the ITER Tokamak cooling systems. The main peculiarity of
ATHENA was the capability to represent a wide variety of working fluids by means of a
generalized equation of state. For instance, in ATHENA were implemented properties for water,
helium, hydrogen, nitrogen, ammonia, potassium, sodium and lithium. The development of
ATHENA was not continued with the following RELAP5 versions such as Mod3.2 and MOD3.3,
however also the standard RELAP5 allows treating helium as a coolant by describing it as a
pure incondensable gas.
Taking advantage of the characterization testing of the facility, in the late Nineties, ENEA began
assessing the ATHENA/Mod1 capability to simulate helium cooled systems [5] and then the
activity was continued with the most recent versions of RELAP5 [6]. This activity allowed
developing and upgrading a RELAP5/MOD3.3 model of HE-FUS3 that is now used for the
pre-test calculations of the new pre-test campaign.
3.2
Nodalization Scheme
A RELAP5 model of the facility that includes all the main parts of the loop (piping, heat
exchangers, heaters, Test Section, valves, compressor, etc) described in the previous chapter has
been developed by means of the generic RELAP5 modules (pipes, branches, pumps). The
nodalization scheme is shown in Fig. 3.1. It consists of 211 thermal-hydraulic nodes, 215
junctions, and 46 heat structures with a total number of mesh points of about 1400.
The nodalization has been developed according to the rules and the advice contained in the
RELAP5/Mod3.2 user’s documentation [4]:
•
the volume flow lengths have been imposed generally between 0.5 m and 1 m, in order to
reach a compromise between a reasonable calculation time, limiting the control volume
number, and a good simulation of the peculiar features of the system (geometry, materials
etc.)
•
the mesh thickness for the conduction heat transfer calculation has been selected generally
less than 10 mm
•
non-equilibrium and smooth area change option have been used in the junctions, choking
and stratification models have generally been applied.
B ranc h 170 Pi p e 2 0 0 P ipe 400 P ipe 22 0 P ipe 280 P ipe 320 P ipe 340 P ipe 36 0 B ranch 365 B ranc h 367 Pi p e 3 9 0 P ipe 420 B ranch 430 P ipe 460 Br a n c h 4 9 9 P ipe 520 B ranch 521 B ranch 257 P ipe 341
3.3
Modeling Assumptions
3.3.1 Economizer
The Economizer is simulated by means of the 2 pipes 200 and 400, respectively representing the
shell side and the tube side, and thermally coupled through the pipe wall heat structure. A tuning
has been performed to obtain design performance in term of heat transfer capability and pressure
drop.
Due to its great importance for the temperature distribution in the hot part of the loop, the
simulation of heat exchanger performance has represented a particular challenge to model. The
heat transfer coefficient for convection in single phase gas, calculated by RELAP5 with the
standard Dittus-Boelter correlation, is inadequate for the shell side, where the presence of
diaphragms causes helium cross-flow and thermal exchange improvement. In order to increase
the heat transfer coefficient, a common place approach has been applied to the shell side by
reducing appropriately the heating diameter. Some available steady state tests have allowed
tuning the heating diameter value in order to obtain temperature distributions in good agreement
with the experimental data [5]. The value introduced in the model (1.63 10
-3m against 1.82 10
-2m) has been selected as a compromise between different conditions.
Stand alone model of the shell side/tube side of the Economizer has been built to tune the energy
loss coefficients. In order to match the design pressure drops at design flow conditions (i.e. mass
flow, temperature, etc) it has been found the value of a dimensionless concentrated pressure drop
coefficient to assume on the 18 junctions representing the diaphragms of the shell side (k=8
referred to the relative cross section area).
3.3.2 Compressor
Because a specific module for this component is not available in RELAP5 the rotating pump
component is used for the simulation of the compressor (component 600).
In this case, the interaction of the pump and the fluid should be described by means of the
empirically developed curves relating pump head (H), and torque (τ) to the volumetric flow (Q)
and pump angular velocity (ω) (pump characteristic curves). These curves, frequently referred to
as four-quadrant curves, for use in Relap5, must be converted to a more condensed form, called
homologous curves, which uses dimensionless quantities, involving the head ratio (H/H
r), torque
ratio ( τ/ τ
r), volumetric flow ratio (Q/Q
r) and angular velocity ratio (ω/ω
r). These ratios are
actual values divided by rated values that are the design point or point of maximum efficiency for
the pump [4].
The homologous curves in the model was originally provided on the basis of characterisation
tests both for head and torque (this latter has been deduced from helium heating) performed on
1998 [7]. As in 1999 a new rotor was mounted in the facility the characterization tests were
repeated [8] and the related data (Tab. 3.1), that refers to the compressor sketch in Fig. 3.2 has
been used to construct a new set of homologous curves for the present simulation of the
compressor behaviour (Figs. 3.3 and 3.4).
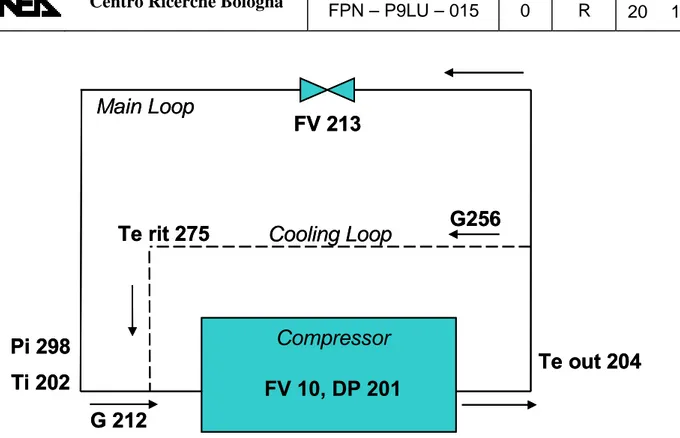
flow rate, properly cooled to simulate the heat removed by a two stage water heat exchanger. This
helium auxiliary flow is derived from the compressor outlet and then reintroduced at the
compressor inlet. On the basis of compressor performance tests the by-pass mass flowrate and the
recycling temperature are described as a function of the actual pump head by means of RELAP5
control components.
Compressor Characterization Tests 19/02/99
FV10 FV 213 G 212 DP 201 Ti 202 Pi 298 Te out 204 Tcusc 276 Te rit 275 G 256
rpm % kg/s bar °C bar ass °C °C °C kg/s
10000 (55.5%) 100 0,068 0,57 71,8 23,1 81,8 43,2 0,018 80 0,066 0,59 71,8 23,1 82,1 43 0,019 70 0,062 0,61 71,8 23 82,3 42,9 0,019 60 0,055 0,65 71,6 23 82,6 42,9 0,020 50 0,046 0,7 71,6 22,9 83,5 42,9 0,020 40 0,036 0,75 71,4 22,9 84,8 43 0,021 30 0,024 0,83 71,2 22,8 86,4 43,4 0,022 12000 (66.6%) 100 0,081 0,79 71,8 22,9 88,9 46,9 0,023 80 0,078 0,81 71,6 22,9 89,4 47,1 0,023 70 0,073 0,85 71,8 22,8 90,1 47,2 0,023 60 0,065 0,9 71,5 22,8 91,3 47,3 0,024 50 0,055 0,95 71,5 22,7 93,5 47,7 0,025 40 0,043 1,04 71,4 22,6 97 48,4 0,026 30 0,029 1,11 71,2 22,5 101,2 49,1 0,027 13000 (72.2%) 100 0,087 0,92 72,1 22,8 93,3 49,8 0,024 80 0,084 0,94 71,8 22,8 93,6 49,8 0,025 70 0,079 0,97 71,8 22,8 95,1 50,3 0,025 60 0,071 1,03 71,5 22,7 96,5 50,6 0,026 50 0,059 1,1 71,5 22,7 99,6 51,2 0,027 40 0,046 1,18 71,5 22,6 103,7 52 0,028 30 0,031 1,3 71,1 22,5 110 53,2 0,029 14000 (77.7 %) 100 0,094 1,05 71,9 22,8 98 52,9 0,026 80 0,091 1,07 71,6 22,8 98,6 53,3 0,026 70 0,085 1,11 72,2 22,9 102,7 55,4 0,027 60 0,076 1,18 72,1 22,8 112,5 56 0,028 50 0,063 1,26 73,1 22,7 109,2 56,8 0,029 40 0,05 1,37 70,5 22,6 113 56,9 0,030 15000 (83.3%) 100 0,101 1,2 71,8 22,9 103,6 56,8 0,028 80 0,098 1,22 71,8 22,9 104,5 56,9 0,028 70 0,091 1,27 71,6 22,8 105,9 57,3 0,029 60 0,081 1,35 71,5 22,7 108,6 57,8 0,030 50 0,067 1,45 71,2 22,6 113,5 58,8 0,031 16000 (88.8%) 100 0,107 1,34 72,8 22,9 108,9 58,8 0,030 80 0,104 1,38 71,5 22,8 109,2 59,1 0,031 70 0,101 1,43 71,4 22,8 111 59,5 0,031 60 0,087 1,51 71,5 22,7 114 60,2 0,032
G 212
G256
Te rit 275
Pi 298
Ti 202
Te out 204
FV 213
Compressor
Main Loop
Cooling Loop
FV 10, DP 201
G 212
G256
Te rit 275
Pi 298
Ti 202
Te out 204
FV 213
Compressor
Main Loop
Cooling Loop
FV 10, DP 201
Fig. 3.2 – Scheme of the Compressor Cooling System
Homologous Head Curve
0 0,5 1 1,5 2 2,5 0 0,2 0,4 0,6 0,8 1 1,2 v/a or a/v h/a² h/v²
Homologous Torque Curve 0 0,2 0,4 0,6 0,8 1 1,2 1,4 1,6 1,8 0 0,2 0,4 0,6 0,8 1 1,2 v/a, a/v b/a² b/v²
Fig. 3.4 – RELAP Homologous Torque Curve
3.3.3 Air Cooler
The Air Cooler model contains a detailed primary side (helium) model while the secondary side
(air) with its regulation system has been modelled in a simplified way.
The Air Cooler primary side model (pipe 460) has been set up in order to tune the dimensionless
pressure loss coefficients on the basis of the design data of the heat exchanger. It reproduce the
coil configuration, made of straight parts and curves, with 11 junctions that represent the pipe
bends where a dimensionless concentrate pressure drop coefficient equal to 0.8 has been set in
order to reproduce design pressure drop.
The secondary side (air) of the air cooler with its regulation system is not modelled. The
temperature at the compressor inlet is kept lower than the maximum continuative operating
temperature through a heat sink thermally coupled with the air cooler tubes.
3.3.4 ElectricalHeaters
Each Electrical Heater has been modelled in the same way, as follows:
• Pipes 240 – 260 – 300 represent the Electrical Heaters, A stand alone model of a single
Electrical Heater module has been built in order to tune the energy loss coefficients. In
order to match the design pressure drops at design flow conditions (i.e. mass flow,
temperature, etc) it has been found the value of a dimensionless concentrated pressure drop
coefficient to assume on the 12 junctions representing the heater diaphragm plates.
• Branches 210 - 230 – 250 – 270 – 290 – 310 and pipes 220 – 280 represent Electrical
Heaters inlet, outlet and connection: it has been associated to these components the typical
inlet, outlet and 90° curve energy loss coefficients.
• Single junctions 225 – 275 represent the manual valves HV 250 HV 252 at with are
associated pertinent dimensionless concentrate pressure drops.
Each bundle of heating rods, which are made of Ni – Cr spiral wires insulated by MgO powders,
is modelled through a Relap5 cylindrical heat structure component which preserves design
geometrical parameters (i.e. pin radius, thickness, total external surface). Electrical power supply
is independent for each bundle. The heat transfer coefficient at the boundary of the structure in
contact with the coolant is computed by the code with the “Dittus Boelter” correlation.
3.3.5 Test Section
The hydraulic path of the test section has been accurately modelled with pipe (340 and 360) and
branch (330-352-365-367-370) with suitable energy loss coefficient for bends and flow section
variations. A Test Section stand alone model has been used to tune pressure drop coefficient. In
order to match the design pressure drop at different flow conditions some assumptions have been
made on distributed friction losses:
• In pipe 340 that represents the annular downward pipe the model that specifies that wall
friction effects are to be computed have been activated and the roughness of the wall has
been set equal to 0, moreover the energy loss coefficient of the grids (two) is set to a low
value (k=0.1)
• In pipe 360 that represents the upward pipe the model that specifies that wall friction effects
are to be computed have been activated and the roughness of the wall has been set equal to
0, moreover the energy loss coefficient of the grids (two) is set to a low value (k=0.1)
The seven electrically heated pins are modelled through a Relap5 cylindrical heat structure
component which preserves design geometrical parameters (i.e. pin radius, thickness, total
external surface) and provides the required power. Table of thermo-physical properties are
provided in the model for the three material layers that compose the heat structure (i.e. Ni-Cr
spiral wires, MgO insulator material and Ni – Fe – Cr alloy cladding). The heat transfer
coefficient at the boundary of the structure in contact with the coolant is computed by the code
with the “Dittus Boelter” correlation.
Downward and upward pipes are thermally coupled by means of a cylindrical heat structure
representing the pipe walls and the stagnant helium gap between them that has a fundamental role
in reducing the effect of this coupling.
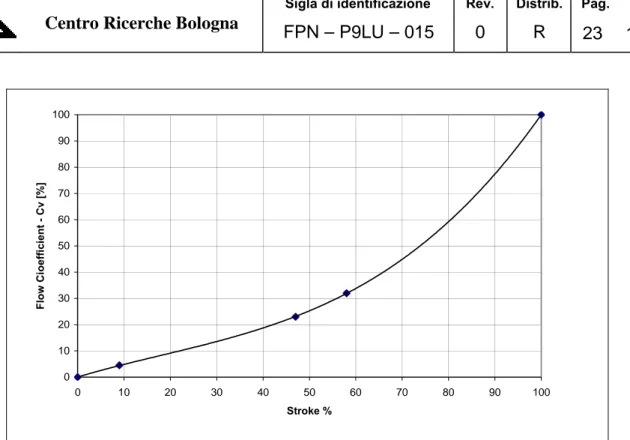
3.3.6 Regulation Valves
The flow control valves (FV213, FV235, FV234) have been modelled by using Relap5 motor
valve (FV213, FV235) and servo valve components (FV234). For these components a suitable
Flow Coefficient (Cv) vs. percent Stroke curve has been provided starting from the Cv data
supplied by the manufacturer (Fig. 3.5 ). On the contrary, regulation valve FV10 (equal to the
previously cited three) has been modelled as a junction with an appropriate concentrated pressure
drop coefficient derived from the flow coefficient data.
0 10 20 30 40 50 60 70 80 90 100 0 10 20 30 40 50 60 70 80 90 100 Stroke % Flow C ioeff ic ient - Cv [%]
Fig. 3.5 – Characteristic of the Regulation Valves
3.3.6 Control System
Loop pressure and mass flowrate are controlled in the numerical model respectively by means of
a boundary condition imposing the pressure in the expansion tank, and through the pump rotation
speed.
The valve FV234, which is modelled by means of the Relap5 servo valve component 172,
regulates the hot by-pass flow (i.e. a cold temperature helium flow rate taken upstream of the
Economizer cold side inlet) in order to avoid high temperature at the Test Section inlet. To do
this the opening of the valve is driven by a proportional-integral controller that causes a specific
valve position consequent to a specific deviation of the regulated parameter (inlet temperature at
TS).
3.3.7 Heat Losses
All the hydraulics components of the loop are thermally coupled with the environment in order to
simulate the actual thermal energy losses. The external loop walls have been described as a
multi-layers material (stainless steel, mineral fibre wool) and thermally coupled with the environment.
The external heat transfer coefficient has been calculated with a correlation of natural convection
in turbulent regime.
However, direct observations made on the facility during the past experiments reports that there
are zones of the loop in which the thermal losses are significant (e.g. Economizer – Heaters) [8].
The observed “thermal bridges” have been simulated through a high fictitious thermal
conductivity of the rock wool (see Table 3.2) imposed in the hot loop portion. These values have
been calibrated on the basis of an evaluation of the real heat losses obtained through thermal
balance on the loop hot zones and on the single components. For all the other heat structures
simulating the external heat losses, the heat conductivity of the rock wool set is in the range of
nominal values for the loop working temperatures.
Part of the Loop Temperature (°C) λ (w/m°C) Cold zone 0 200. 350. 500. 650. 0.035 0,.05 0.075 0.10 0.125
Electrical Heaters and Economizer 0. – 650, 0.35
Test Section 0. – 650. 0.25
Table 3.2 – Insulator Material Thermal Conductivity
3.3.8 Helium Leakage
According to the design performance of the facility the helium leakage is very low and should not
have valuable effects on loop conditions (Table 2.1), therefore it has not been simulated in the
numerical model.
The RELAP5 described above has been assessed against available HE-FUS3 experimental data,
before performing the pre-test analysis to support the design of the experimental program to
conduct in the HE-FUS3 facility within the ENEA/MSE framework program.
The experimental data already available for the facility are described in Ref. [8]. Most part of
these data, which are currently being used for the RAPHAEL benchmark exercise, are related to
the operation of the facility with the original rotor of the compressor. As the characteristics of the
compressor with the new rotor mounted at the beginning of 1999 are quite different respect to the
original ones, the only experimental data we can rely to assess the RELAP model of the present
loop configuration change are the two steady state recorded on February 1999.
The previous re-interpretation activities of the HE-FUS3 old data [5], [6] have highlighted the
large uncertainty on the experimental parameters that has allowed assessing the numerical results
from a qualitative point of view a rather than a quantitative one. The main source of uncertainty
is the actual amount of the heat losses in the loop that joined to the lack of a precise measurement
of the TS electrical power has a relevant effect on the loop temperature distribution. As the
maximum temperature of the helium is the most important parameter to be considered in the
pre-test calculations in order to guarantee the loop integrity, the two available steady state have been
used, to estimate, in particular the calculation accuracy of this parameters.
To this aim the simulation of the first steady state at 95 Kw electrical power in TS has carried out
for the RELAP5 model set-up in order to obtain calculation results in good agreement with the
experimental data. The simulation of the second steady state at 70 kW electrical power in TS has
been performed with the same model in order to evaluate the accuracy of the calculation results
we can expect in the pre-test activity.
3.3.1 Re-calculation of the 40%ST19-02-99 Steady State
The relevant boundary conditions introduced in the RELAP model for the recalculation of the
HE-FUS3 steady state are reported in Table 3.3 . The final results of the simulation obtained by
means of an interative calculation process that has allowed the model tuning are compared with
the experimental data in Table 3.4.
In the following are listed and commented the changes made in the model to obtain the good
agreement between experiment and calculation showed in the Table 3.4:
• The Heat Losses in the loop have been re-calibrated in order to match the experimental
thermal balance in the hot part of the loop that has been calculated by means of measured
parameters.
• The heating diameter in the shell side of economizer heat structure has been re-calibrate in
order to obtain inlet and outlet temperature of the component in good agreement with the
experimental data.
• The heating diameter of the heat structure simulating the 7 pins of the TS has been doubled
respect to the theoretical value thus decreasing the heat transfer coefficient in order to
calculate a pin cladding temperature that is interpolated by the experimental results. A more
precise calibration is not possible due to the large spread of the measurements in the
different pins.
Controlled Parameter Experimental Value
Loop Pressure (bar) 23.
TS Electrical Power (kW) 95.
Heaters Electrical Power (kW) 0.
Loop Mass Flowrate (kg/s) 0.99
TS Helium Inlet Temperature 350.
Valve F213 % Opening 88
Tab.3.3 – 40%ST19-02-99 Steady State Relevant Boundary Conditions
Parameter HE-FUS3 Tag Experimental Value Reference RELAP Calculated Value
Total Pressure Drop (bar) PD201 1.12 cntrlvar 40 1.11
TS Pressure Drop (bar) PD229 0.466 cntrlvar 41 0.445
Compressor Speed (rad/s) ST270 1501. pmpvel 600 1548.
Valve F234 % Opening ZT234 47.7 vlvarea 172 51.0
E214 Inlet Cold Side Temperature (°C) TR215 90.0 cntrlvar 215 94.0
E214 Outlet Cold Side Temperature (°C) TR216 460. cntrlvar 216 460.
E219/3 Outlet Temperature (°C) TR220 448. cntrlvar 220 445.
E219/2 Outlet Temperature (°C) TR222-TR297 442. - 445. cntrlvar 222 438.
E219/1 Outlet Temperature (°C) TR223-TR236 433.- 434. cntrlvar 223 427.
E214 Inlet Hot Side Temperature (°C) TR217 521. cntrlvar 217 520.
E214 Outlet Hot Side Temperature (°C) TR218-TR239 230. – 234. cntrlvar 218 230.
Air Cooler Outlet Temperature (°C) TR242-TR202 75. – 74. cntrlvar 202 75.
Compressor Outlet Temperature (°C) TR204 99. cntrlvar 204 97.
Pin Temperature at 0.25 m High (°C)
TT400
556 cntrlvar 210 531.Pin Temperature at 1.25 m High (°C)
TT403, TT407, TT411, TT415,
TT419, TT427 688-774
cntrlvar 211 710.
Tab.3.4 – 40%ST19-02-99 Steady State Comparison of Experimental and Calculated Parameters
3.3.2 Re-calculation of the 30%ST19-02-99 Steady State
The relevant boundary conditions introduced in the RELAP model for the recalculation of the
HE-FUS3 steady state are reported in Table 3.5 . The final results of the simulation obtained with
the frozen model tuned in the previous calculation are compared with the experimental data in
Table 3.6.
The agreement between calculation results and experimental data remains quite good. The major
discrepancies appears in the temperatures of the heaters zone, thus confirming that the heat losses
in the loop deduced from the experiemntal data are affected by a very high uncertanty. One
reason for this could be that the data were acquired at not completely stabilized steady state
conditions, but we do not have any evidence to confirm this hypothesis.
In order to avoid an under-estimation of the maximum helium temperature as a consequence of
an over estimation of the heat losses in the hot part of the loop, on the basis of the results of the
nominal value for the heat conductivity of the insulant material (rock wool). That means not to
use a fictious value of the rock wool thermal conductivity for simulating “thermal bridges”
effects. This assumption is conservative for the calculation of the loop maximum temperatures
and makes us more confident that the maximum design temperature of the loop (530 °C) will not
be exceded during the experimental campaign, in particular in the tests simulating accident
transients .
Controlled Parameter Experimental Value
Loop Pressure (bar) 24.
TS Electrical Power (kW) 71.
Heater 2 Electrical Power (kW) 10.
Loop Mass Flowrate (kg/s) 0.99
TS Helium Inlet Temperature 350.
Valve F213 % Opening 88
Tab.3.5 – 30%ST19-02-99 Steady State Relevant Boundary Conditions
Parameter HE-FUS3 Tag Experimental Value Reference RELAP Calculated Value
Total Pressure Drop (bar) PD201 1.12 cntrlvar 40 1.11
TS Pressure Drop (bar) PD229 0.441 cntrlvar 41 0.410
Compressor Speed (rad/s) ST270 1484. pmpvel 600 1474.
Valve F234 % Opening ZT234 42.0 vlvarea 172 42.0
E214 Inlet Cold Side Temperature (°C) TR215 89.0 cntrlvar 215 92.0
E214 Outlet Cold Side Temperature (°C) TR216 408. cntrlvar 216 409.
E219/3 Outlet Temperature (°C) TR220 399. cntrlvar 220 397.5
E219/2 Outlet Temperature (°C) TR222-TR297 417. - 420. cntrlvar 222 407.
E219/1 Outlet Temperature (°C) TR223-TR236 420.- 421. cntrlvar 223 406.
E214 Inlet Hot Side Temperature (°C) TR217 467. cntrlvar 217 475.
E214 Outlet Hot Side Temperature (°C) TR218-TR239 204. – 208. cntrlvar 218 206.
Air Cooler Outlet Temperature (°C) TR242-TR202 75. – 74. cntrlvar 202 75.
Compressor Outlet Temperature (°C) TR204 98. cntrlvar 204 95.
4. Pre-test
Calculations
The HE-FUS3 experimental program has been proposed in order to provide an experimental data
base for the assessment of thermal-hydraulic codes used for HTR and VHTR design and safety
analysis. Moreover, the experimental program will be also addressed to a better characterization
of the facility, that is a fundamental thing in the development of the facility numerical model. In
fact, previous works [5], [6] concluded that the large uncertainty present in the old experimental
data makes very difficult the evaluation of the code results.
With these objectives in mind the pre-test activity has allowed defining a set of transients: plant
start-up step by step, 2 Loss of Flow Accidents with a different dynamic of the accidental event, 2
Loss of Coolant Accidents at different loop pressure that are described in the following
subsections.
A start-up procedure by steps has been investigated in the pre-test analysis in order to collect data
at different steady state conditions for the characterization of the heat losses in the hot zone of the
loop and of the thermal exchange performance in the economizer. In order to have more
flexibility on the heating up dynamics only TS electrical power been considered as heat source in
this transient.
In the Table 4.1
are reported the relevant boundary conditions for the start-up transient. A 3-step
increase of supplied power combined with a 3-step increase of compressor speed allow defining
5 different steady states characterized by different temperature distributions in the loop hot zone
and different mass flowrates in the economizer. Each step of power and compressor speed lasts
2000 seconds in order to have 1000 seconds for each steady state condition given by a
combination of the previous ones (Fig. 4.1). It is important to notice that stabilized conditions are
obtained after some hundred seconds of calculation because the thermal capacities of the loop
materials have been decreased by a factor 1000. This assumption has been made only in this
calculation where the interest is not to simulate the response of the system to accidental events as
in the following transient calculations, but just to reproduce the different steady state conditions
that will be recorded during the start-up.
The main loop parameters calculated are reported in Figs. 4.2 to 4.10. Fig. 4.1, in particular,
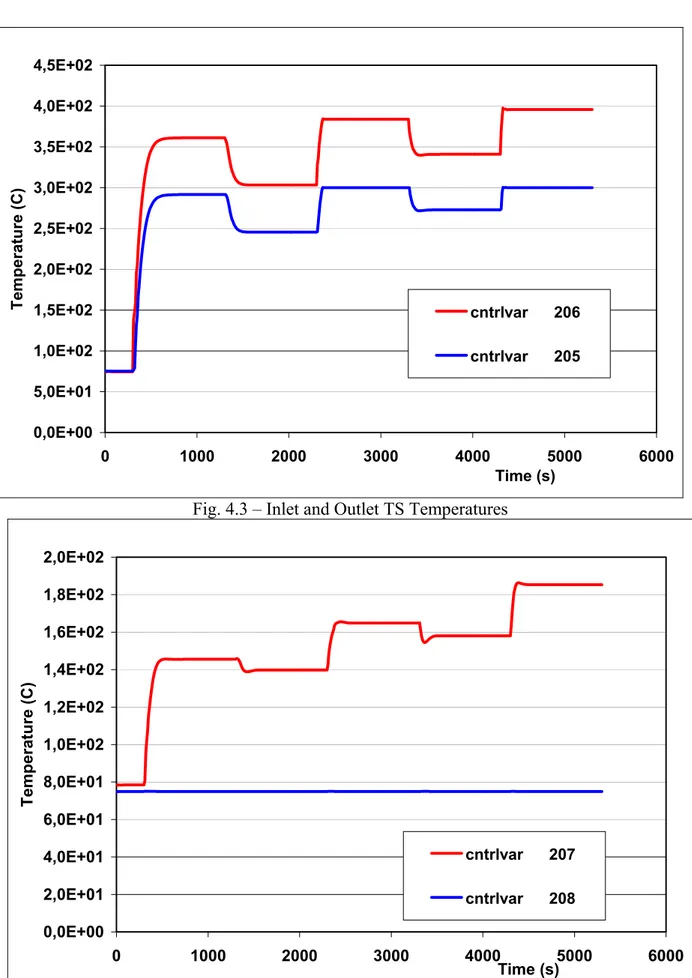
shows how the loop temperature stabilizes at 5 different levels during the start-up. In Fig.4.3 it
can been noticed that the temperature regulation at the inlet of the test section is active only in the
second part of the start-up when the by-pass valve opens (Fig. 4.9) to limit this temperature below
300 °C. Finally, the steps showed in Fig. 4.10 by the total pressure drop in the loop and in the
test section that follow both the mass flowrate and the temperature increase are a further
interesting information for the characterization of the loop.
In order to evaluate the time needed to achieve a sufficiently stabilized steady state in the loop
after having modified the boundary conditions, the first step of the start-up has been re-calculated
with actual thermal capacities. The hot loop temperature and the total heat loss reported in Figs.
4.11 and 4.12 show that after 50000 s the loop has achieved acceptable steady state conditions. In
fact, the temperature variations are less that 1 °C for hour and the total heat loss variation is lower
that 3%.
Initial and Boundary Conditions Value Time (s)
Initial Pressure (bar) 30. 0.
TS Electrical Power (kW) 0. 0.
Compressor Speed (rad/s) 1000. 0.
1st Step of Power (kW) 36. 300.
1st Step of compressor speed (rad/s) 1200. 1300.
2nd Step of Power (kW) 52.5 2300.
2nd Step of compressor speed (rad/s) 1480. 3300.
3rd Step of Power (kW) 75. 4300.
TS Helium Inlet Temperature (°C) 300. All transient
Air Cooler Helium Outlet Temperature (°C) 75 All transient
Valve F213 % Opening 100. All transient
0,0E+00 1,0E+04 2,0E+04 3,0E+04 4,0E+04 5,0E+04 6,0E+04 7,0E+04 8,0E+04 9,0E+04 0 1000 2000 3000 4000 5000 6000 Time (s) Pow er ( w ) 0,0E+00 2,0E+03 4,0E+03 6,0E+03 8,0E+03 1,0E+04 1,2E+04 1,4E+04 TS Power pmpvel 600 Com p re ss or Speed ( rpm )
Fig. 4.1 – Compressor Speed and TS Power
0,0E+00 5,0E+01 1,0E+02 1,5E+02 2,0E+02 2,5E+02 3,0E+02 3,5E+02 4,0E+02 0 1000 2000 3000 4000 5000 6000 Time (s) Tempera ture (C) cntrlvar 200 cntrlvar 201 cntrlvar 206 cntrlvar 207
0,0E+00 5,0E+01 1,0E+02 1,5E+02 2,0E+02 2,5E+02 3,0E+02 3,5E+02 4,0E+02 4,5E+02 0 1000 2000 3000 4000 5000 6000 Time (s) Temperature (C) cntrlvar 206 cntrlvar 205
Fig. 4.3 – Inlet and Outlet TS Temperatures
0,0E+00 2,0E+01 4,0E+01 6,0E+01 8,0E+01 1,0E+02 1,2E+02 1,4E+02 1,6E+02 1,8E+02 2,0E+02 0 1000 2000 3000 4000 5000 6000 Time (s) Tempera ture (C) cntrlvar 207 cntrlvar 208
0,0E+00 2,0E+01 4,0E+01 6,0E+01 8,0E+01 1,0E+02 1,2E+02 0 1000 2000 3000 4000 5000 6000 Time (s) Temperature (C) cntrlvar 208 cntrlvar 209
Fig. 4.5 – Inlet and Outlet Compressor Temperatures
0,0E+00 1,0E+02 2,0E+02 3,0E+02 4,0E+02 5,0E+02 6,0E+02 0 1000 2000 3000 4000 5000 6000 Time (s) Tem p er at ur e ( C ) cntrlvar 210 cntrlvar 211
3,00E+06 3,05E+06 3,10E+06 3,15E+06 3,20E+06 3,25E+06 3,30E+06 3,35E+06 3,40E+06 0 1000 2000 3000 4000 5000 6000 Time (s) Pressure (Pa) p 480090000 p 140040000 p 365010000
Fig. 4.7 – Loop Pressures
.
0,0E+00 4,0E-02 8,0E-02 1,2E-01 1,6E-01 2,0E-01 0 1000 2000 3000 4000 5000 6000 Time (s) Mass Fl orate (k g/ s) mflowj 385000000 mflowj 172000000 mflowj 1750000000,0E+00 2,0E-01 4,0E-01 6,0E-01 8,0E-01 1,0E+00 1,2E+00 0 1000 2000 3000 4000 5000 6000 Time (s) O p ening vlvarea 172 vlvarea 175
Fig.4.9 – Main and Bypass Valve Opening
0,0E+00 2,0E+04 4,0E+04 6,0E+04 8,0E+04 1,0E+05 1,2E+05 1,4E+05 1,6E+05 0 1000 2000 3000 4000 5000 6000 Time (s) Pressure (Pa) cntrlvar 40 cntrlvar 41
0,0E+00 5,0E+01 1,0E+02 1,5E+02 2,0E+02 2,5E+02 3,0E+02 3,5E+02 4,0E+02 0 10000 20000 30000Time (s)40000 50000 Te mperature (C) cntrlvar 200 cntrlvar 201 cntrlvar 206 cntrlvar 207
Fig. 4.11 – Inlet and Outlet Economizer Temperatures (actual thermal capacities)
0,0E+00 5,0E+03 1,0E+04 1,5E+04 2,0E+04 2,5E+04 3,0E+04 3,5E+04 4,0E+04 0 10000 20000 30000 40000 50000 Time (s) Heat Los ses (w ) cntrlvar 30
4.2 LOFA through bypass valve opening
A Loss of Flow Accident with a sharp reduction of the TS mass flow rate has been simulated with
a complete opening of the valve F235 that allows the helium to bypass the hot part of the loop.
This procedure to simulate a LOFA scenario was already applied with success [8] during the
characterization of the facility in 1998.
The main point investigated with the pre-test calculation has been the maximum helium and pin
cladding temperatures reached during the transient in order to verify that the design limits for the
loop and for the pin cladding are not attained. The results of the calculation reported in Figs. 4.13
to 4.23 show that the margin respect to these limits is sufficient also taking into account the
conservative assumptions made in the calculation model.
The LOFA scenario, which start from the steady state conditions attained at the conclusion of the
start-up transient, is simulated for 1000 s before retrieving the initial state of the loop as showed
by the boundary conditions reported in Table 4.2. The operation of the valve F235 is reported in
Fig. 4.13 together with valve FV213 and FV234, while the main valve FV213 remains stuck open
during the transient the bypass valve FV234 start opening following the helium temperature
increase in the heaters zone in order to guarantee 300 ° at the TS inlet. The mass flowrates in
Figs. 4.14 and 4.15 coherently follow the valve operations, in particular, the Test Section mass
flowrate is halved after the valve opening. Just before the closing of the bypass valve the
maximum helium temperature reaches 500 °C against a limit of 530° C (Fig. 4.19), the
temperature increase is very slow so the risk to exceed this value is practically null. Larger
margin is showed by the temperature of the TS pin cladding (Fig. 4.22) that reaches the peak
value of 712 °C (against a limit of 800 °C adopted for the 7-pin protection) after 600 s of
transient.
Initial and Boundary Conditions Value Time (s)
Initial Pressure (bar) 33.7 0.
TS Electrical Power (kW) 75. 0.
Compressor Speed (rad/s) 1480. 0.
Valve F235 beginning opening (%) 0. 300.
Valve F235 complete opening (%) 100. 304.
Valve F235 beginning closure (%) 100. 1300.
Valve F235 complete closure (%) 0. 1304.
TS Helium Inlet Temperature (°C) 300. All transient
Air Cooler Helium Outlet Temperature (°C) 75. All transient
Valve F213 % Opening 100. All transient
0,0E+00 2,0E-01 4,0E-01 6,0E-01 8,0E-01 1,0E+00 1,2E+00 0 400 800 1200 1600 2000 2400 Time (s) Opening vlvarea 172 vlvarea 510 vlvarea 175
Fig.4.13 – Main and Bypass Valves Opening
0,0E+00 4,0E-02 8,0E-02 1,2E-01 1,6E-01 2,0E-01 2,4E-01 0 400 800 1200 1600 2000 2400 Time (s) Mass Fl or ate (kg/ s) mflowj 385000000 mflowj 150000000 mflowj 510000000
0,0E+00 2,0E-02 4,0E-02 6,0E-02 8,0E-02 1,0E-01 1,2E-01 1,4E-01 1,6E-01 0 400 800 1200 1600 2000 2400 Time (s) M ass Fl orate (kg/ s) mflowj 385000000 mflowj 172000000 mflowj 175000000
.Fig. 4.15 –Test Section, Economizer and Hot-Bypass Mass Flows
0,0E+00 2,0E+04 4,0E+04 6,0E+04 8,0E+04 1,0E+05 1,2E+05 1,4E+05 1,6E+05 1,8E+05 0 400 800 1200 1600 2000 2400 Time (s) Pressure (Pa) cntrlvar 40 cntrlvar 41
0,0E+00 1,0E+02 2,0E+02 3,0E+02 4,0E+02 5,0E+02 6,0E+02 0 400 800 1200 1600 2000 2400 Time (s) Temperature (C) cntrlvar 200 cntrlvar 201 cntrlvar 206 cntrlvar 207
Fig. 4.17 – Inlet and Outlet Economizer Temperatures
3,20E+02 3,30E+02 3,40E+02 3,50E+02 3,60E+02 3,70E+02 3,80E+02 3,90E+02 4,00E+02 4,10E+02 4,20E+02 0 400 800 1200 1600 2000 2400 Time (s) Tempera ture (C) cntrlvar 201 cntrlvar 202 cntrlvar 203 cntrlvar 204
2,5E+02 3,0E+02 3,5E+02 4,0E+02 4,5E+02 5,0E+02 5,5E+02 0 400 800 1200 1600Time (s)2000 2400 Te mperature (C) cntrlvar 206 cntrlvar 205
Fig. 4.19 – Inlet and Outlet TS Temperatures
0,0E+00 5,0E+01 1,0E+02 1,5E+02 2,0E+02 2,5E+02 0 400 800 1200 1600 2000 2400 Time (s) Tem p er at ur e ( C ) cntrlvar 207 cntrlvar 208
7,0E+01 7,5E+01 8,0E+01 8,5E+01 9,0E+01 9,5E+01 1,0E+02 0 400 800 1200 1600 2000 2400 Time (s) Temperature (C) cntrlvar 208 cntrlvar 209
Fig. 4.21 – Inlet and Outlet Compressor Temperatures
4,2E+02 4,6E+02 5,0E+02 5,4E+02 5,8E+02 6,2E+02 6,6E+02 7,0E+02 7,4E+02 0 400 800 1200 1600 2000 2400 Time (s) Tempera ture (C) cntrlvar 210 cntrlvar 211
3,20E+06 3,25E+06 3,30E+06 3,35E+06 3,40E+06 3,45E+06 3,50E+06 0 400 800 1200 1600 2000 2400 Time (s) Pressure (Pa) p 480090000 p 140040000 p 365010000
A Loss of Flow Accident with a slower reduction of the TS mass flow rate that is a typical effect
of the compressor coastdown has been simulated with a reduction of the compressor speed. As in
the previous LOFA transient, the main point investigated with the pre-test calculation has been
the maximum helium and pin cladding temperatures reached during the transient. The results of
the calculation reported in Figs. 4.24 to 4.33 show that the margin respect to these limits is
sufficient also taking into account the conservative assumptions made in the calculation model.
The LOFA scenario, which start from the steady state conditions attained at the conclusion of the
start-up transient, has been simulated by means a reduction of the compressor speed in 50 s. After
1000 s the initial compressor speed has been restored in 50 s as well. The initial and boundary
conditions of the transient are reported in Table 4.3.
Figure 4.24 shows the reduction of the TS mass flowrate following the reduction of the
compressor speed, which results about halved at the lower speed. Due to the decease of mass
flowrate the temperatures increase in the hot part of the loop. Just before the restoring of the
initial pump speed the maximum helium temperature reaches 470 °C (Fig. 4.27 ) that is a relevant
margin respect to the limit of 530° C, and more relevant it is the margin of the pin cladding
temperature, 651 °C against the limit of 800 °C (Fig. 4.30). The behavior of the bypass valve
FV234 in Fig. 4.33 is similar to the previous LOFA transient.
Initial and Boundary Conditions Value Time (s)
Initial Pressure (bar) 33.7 0.
TS Electrical Power (kW) 75. 0.
Initial Compressor Speed (rad/s) 1480. 0.
Compressor speed start decreasing (rad/s) 1480. 300.
Compressor speed stop decreasing (rad/s) 800. 350..
Compressor speed start increasing (rad/s) 800. 1300.
Compressor speed stop increasing (rad/s) 0. 1350.
TS Helium Inlet Temperature (°C) 300. All transient
Air Cooler Helium Outlet Temperature (°C) 175. All transient
Valve F213 % Opening 100. All transient
6,0E+02 8,0E+02 1,0E+03 1,2E+03 1,4E+03 1,6E+03 0 400 800 1200 1600 2000 2400 Time (s) Com p ressor S p eed (rad/ s) 0,04 0,06 0,08 0,10 0,12 0,14 0,16 pmpvel 600 mflowj 385000000 M ass Fl orate (kg/ s)
Fig. 4.24 – Compressor Speed and TS Mass Flowrate
0,0E+00 1,0E+02 2,0E+02 3,0E+02 4,0E+02 5,0E+02 0 400 800 1200 1600 2000 2400 Time (s) Tempera ture (C) cntrlvar 200 cntrlvar 201 cntrlvar 206 cntrlvar 207
3,20E+02 3,30E+02 3,40E+02 3,50E+02 3,60E+02 3,70E+02 3,80E+02 3,90E+02 4,00E+02 0 400 800 1200 1600 2000 2400 Time (s) Temperature (C) cntrlvar 201 cntrlvar 202 cntrlvar 203 cntrlvar 204
Fig. 4.26 – Heaters Zone Temperatures
2,5E+02 3,0E+02 3,5E+02 4,0E+02 4,5E+02 5,0E+02 0 400 800 1200 1600 2000 2400 Time (s) Tempera ture (C) cntrlvar 206 cntrlvar 205
0,0E+00 5,0E+01 1,0E+02 1,5E+02 2,0E+02 2,5E+02 0 400 800 1200 1600 2000 2400 Time (s) Temperature (C) cntrlvar 207 cntrlvar 208
Fig. 4.28 – Inlet and Outlet Air Cooler Temperatures
7,0E+01 7,5E+01 8,0E+01 8,5E+01 9,0E+01 9,5E+01 1,0E+02 0 400 800 1200 1600 2000 2400 Time (s) Tempera ture (C) cntrlvar 208 cntrlvar 209
4,0E+02 4,5E+02 5,0E+02 5,5E+02 6,0E+02 6,5E+02 7,0E+02 0 400 800 1200 1600 2000Time (s) 2400 Temperature (C) cntrlvar 210 cntrlvar 211
Fig. 4.30 – Pin temperatures at 0.25 m and at 1,75 m
0,0E+00 2,0E-01 4,0E-01 6,0E-01 8,0E-01 1,0E+00 1,2E+00 0 400 800 1200 1600 2000 2400 Time (s) Open ing vlvarea 172 vlvarea 175
0,0E+00 3,0E+04 6,0E+04 9,0E+04 1,2E+05 1,5E+05 1,8E+05 0 400 800 1200 1600 2000 2400 Time (s) Pressure (Pa) cntrlvar 40 cntrlvar 41
Fig. 4.32 – Loop and TS pressure Drops
3,20E+06 3,25E+06 3,30E+06 3,35E+06 3,40E+06 3,45E+06 3,50E+06 0 400 800 1200 1600 2000 2400 Time (s) Pressure (Pa) p 480090000 p 140040000 p 365010000