See discussions, stats, and author profiles for this publication at: https://www.researchgate.net/publication/297677256
Non-Market Ecosystem Services of Agricultural
Land and Priorities Towards a More Sustainable
Agriculture in Italy
Article · March 2016 CITATION1
READS135
5 authors, including: Some of the authors of this publication are also working on these related projects: Environmental Science Research Network (ESRN)View project Urban metabolism accounts for building Waste management Innovative Networks and Strategies (Urban_Wins)
View project Vassilis George Aschonitis University of Ferrara 51 PUBLICATIONS 114 CITATIONS SEE PROFILE Elena Gissi Università Iuav di Venezia 21 PUBLICATIONS 11 CITATIONS SEE PROFILE Giuseppe Castaldelli University of Ferrara 80 PUBLICATIONS 780 CITATIONS SEE PROFILE E. A. Fano University of Ferrara 64 PUBLICATIONS 885 CITATIONS SEE PROFILE
All content following this page was uploaded by Vassilis George Aschonitis on 09 March 2016.
The user has requested enhancement of the downloaded file. All in-text references underlined in blue are added to the original document and are linked to publications on ResearchGate, letting you access and read them immediately.
© 2016 Revotech Press
Non-Market Ecosystem Services of Agricultural Land and Priorities
Towards a More Sustainable Agriculture in Italy
Mattias Gaglio
1, Vassilis Aschonitis
1,*, Elena Gissi
2, Giuseppe Castaldelli
1and
Elisa-Anna Fano
11Department of Life Sciences and Biotechnology, University of Ferrara, Ferrara, Italy and 2Universita IUAV di
Venezia, Department of Design and Planning in Complex Environments, Venice, Italy
Abstract: Ecosystems provide a range of services, commonly called Ecosystem Services (ESs), which are of funda- mental importance to human well-being, health, livelihoods, and survival. One of the largest and most productive ecosystems is agricultural land. Agro-Ecosystems provide a range of services directly linked to the market (e.g. food and raw materials production) but also many others of high ecological value, which have an indirect economical contribution in the GDP (non-market ESs). These non-market services are not usually taken into account in the development of agricultural management strategies while their contribution is reduced due to non-sustainable agricultural practices. The aim of the study is to assess the potential economic contribution of the non-market services at national, regional, and provincial level in Italy and to propose a simplified index-based method for setting priorities at different scales of administration units for the implementation of sustainable agricultural practices (SAPs). The results of the study showed that the potential non-market value of agro-ecosystem services (AESs) in Italy can reach ~46.2 billion USD$2007. This estimate shows that non-market AESs can play an important role in the national GDP if SAPs are followed. Finally, a priority ranking scheme for the implementation of SAPs was proposed at regional and provincial level which can be a valuable decision support tool for promoting sustainable agriculture policies.
Keywords: Ecosystem services, Agricultural land, Non-market services, Priority index. 1. INTRODUCTION
Ecosystems provide a range of services, which are offundamental importance to human well-being, health, livelihoods, and survival. The economical contribution of such services can be evaluated using valuation me- thods such as those provided by Costanza et al. [1,2] and de Groot et al. [3] etc., which are extremely useful tools in the development of landscape management plans [4]. These methods consider fourteen main types of ecosystems/biomes (such as marine, coral reefs, co- astal systems, coastal wetlands, inland wetlands, fresh- water river/lakes, tropical forests, temperate forests, woodlands, grasslands, deserts, polar regions, cultivat- ed lands and urban areas) and many other sub-bio- mes. For each biome, monetary values have been set based on the ecosystem services (ESs) they provide, which are divided in four main categories, such as pro- visioning, regulation, supporting and cultural services. One of the main problems is that the economical value of many services provided by the ES approach cannot be validated easily because it is not directly linked to the market (non-market services). For example, the effects of forests on erosion control, water supply etc., are representative cases of non-market ecosystem services.
*Address correspondence to this author at the Department of Life Sciences and Biotechnology, University of Ferrara, Ferrara, Italy; [email protected]
One of the largest and most productive ecosystems are agricultural lands, which are both providers and consumers of ecosystem services [5]. Agro-ecosystem services (AESs) can also provide a wide range of non-market services of high ecological value and indirect profit that are not usually taken into account in the development of agricultural management strategies. In long-term, such strategies lead to environmental quality degradation due to unsustainable agricultural practices that aim to increase the high direct profit [6,7].
The aim of the study is to assess the potential eco- nomic contribution of the non-market services at na- tional, regional, and provincial level in Italy and to pro- pose a simplified index-based method for setting prior- ities at different scales of administration units for the implementation of sustainable agricultural practices. The results of the study can be used as tools for deci- sion making towards a more sustainable agriculture.
2. AGRO-ECOSYSTEM SERVICES (AESs) 2.1. Provisioning Services
The contribution of agricultural ecosystems in the provisioning services is mainly associated to food production, production of raw materials (fiber and biomass for bioenergy), provision of genetic resources, and water supply. Farmers’ efforts are focused on provisioning services since they are strongly linked to
24 Journal of Agriculture Food and Development, 2016, Vol. 2 Gaglio et al.
the market that generates income. Especially food and raw materials production are fundamental since they areconsideredthemostimportantelementsofmanage- ment strategies to support the growth of local eco- nomies in developed countries through short produc- tion chains [8,9].
The role of agriculture in the production of raw materials dates thousands years back where plant fibers were used for clothing, artifacts manufacturing, building etc. (e.g. papyrus, ropes, baskets, straw bricks etc.). Fibers can be produced from seeds, leaves, bast fibres, barks, fruits and stalks (e.g. cotton, bamboo, jute, coir, bagasse, hemp, flax, kapok, sisal, jute, kenaf) [10,11]. The last decades, the production of raw mater- ials (biomass) has also been used for energy pro- duction since biomass can be converted into three main product types of bioenergy: electrical/heat energy, transport fuel and chemical feedstock [12,13].
As concerns the AES from genetic resources, agri- cultural lands host a vast variety of soil microorgan- isms/bacteria and invertebrates, plants, animals, in- sects, fungi, viruses etc., which are sources of unique biological material that can be used in medicine, pro- ducts for materials science, genes for genetic improve- ment etc. [14].
The contribution of agricultural land on water supply is mainly associated to the reduction of water losses by runoff and water evaporation from soil that contribute to higher water retention and groundwater recharge. The reduction of runoff is succeeded through typical land leveling, contour barriers and ditches, bench terraces, furrow channels and drainage canals [15.16] while evaporation losses can be reduced by the crop canopy or by synthetic geotextiles and organic mulching mater- ials (e.g. pine bark, vine pruning residues, straw etc.) deposited on the soil surface [17]. The aforementioned interventions in combination with best management tillage practices and cover or winter crops can signi- ficantly increase the specific AES [18,19].
2.2. Regulation Services
The most important regulation services provided by agro-ecosystems are climate regulation, erosion cont- rol, waste treatment, and biological control. Climate re- gulation considers the regulation of global temperature, precipitation, and other biologically mediated climatic processes at global or local levels [1]. The contribution of croplands in this AES type is associated to the regulation of green house gasses such as carbon
dioxide through carbon sequestration [20,21] and to the absorption of solar radiation for photosynthesis. Ero- sion control is associated with the same interventions for the AES of water supply (see previous section) that reduce runoff, particularly in steep slopes. In the case of waste treatment, the contribution of agricultural land is mainly associated to the use of wastes as fertilizers (e.g. manures), mineralization of organic matter, and nutrient absorption through microbial and aquatic flora processes in the field (e.g. rice fields) and in the drainage canals [22-25]. The AES of biological control concerns the control of pests and diseases based on natural enemies’ interactions [26,27].
2.3. Supporting Services
The supporting AESs include pollination and soil formation. Pollination provided by animals (mainly insects) significantly contributes in sustaining the thirty-five percent of global production from crops including at least 800 cultivated plants [28]. Pollination also de- pends on the presence of natural habitats surrounding the farm. Within the crop field, the conservation of crop genetic diversity by promoting differentiated cultural patterns has shown to be useful not only for pollination but also for pest and disease management [29]. The contribution of agricultural land to the AES of soil for- mation can be performed through the following pro- cesses: a) soil weathering by crops’ rooting systems and rhizosphere microflora [30-32], b) soil fragmenta- tion/aggregation by the combined effects of tillage, incorporation of residues and intense wetting-drying cy- cles due to irrigation especially during summer [33-35].
2.4. Cultural Services
Additional services provided by agricultural land- scapes include cultural benefits whose valuation can be especially difficult [36]. Cultural services are of significant importance for the role they can play in regional economies of local communities [37,38]. This AES is associated to tourism activities (e.g. agricultural museums and exhibition parks, traditional localities, agro-tourism etc.) related to cultural heritage, new technologies, recreation activities such as hunting, or other artistic activities related to agricultural landscape (e.g. professional photography, painting etc.).
2.5. Degradation of AESs
The aforementioned AESs are of significant ecolog- ical and economical value when agronomic practices are performed with respect to environmental quality.
Unfortunately, the intensification of agriculture during the last decades through monoculture systems, exten- sive use of agrochemicals and intensive tillage has led to extensive deterioration of environmental quality. These activities can succeed high direct economic profit through specific provisioning services (e.g. food production and raw materials) but at the same time are responsible for a) the loss of biodiversity that supports genetic resources and pollination services [28,39], b) extremely high water consumption with a negative impact on water supply (e.g. reduction of ground and surface water reserves, saltwater intrusion in lowlands etc.) [40,41], c) water pollution and eutrophication by nutrients and agrochemicals losses with severe impact on water supply and waste treatment services [42], d) nitrous oxides emissions (green house gas) which negatively affect climate regulation services [43] and e) exhaustive absorption of soil macro and micro nutrients and degradation of soil physico-chemical properties that may lead to gradual decline of soil quality through salinization, codification or desertification [44,45]. The aforementioned environmental problems suggest an extensive negative impact especially on non-market AESs.Thus,integratedmanagementstrategies towards a more sustainable agriculture are required in order to preserve and increase the potential value of non-market AESs.
3. DATA AND METHODS 3.1. Data
The analysis was performed for the Italian territory, which is divided in 20 administrative regions and 110 provinces, using the most recent Corine Land Cover raster map of 2012 (CLC2012) developed by the European Environment Agency (EEA). The CLC2012 is provided with a geometric accuracy better than 100m and a thematic accuracy of at least 85% (http://land. copernicus.eu/pan-european/corine-land-cover). Agri- cultural land was extracted by the level 3 classification of CLC2012 at national, regional, and provincial level. The administrative boundaries of the Italian country, regions and provinces were obtained by the GADM database (http://www.gadm.org).
Additional data of the period 2010-2012 about the economical contribution of agriculture in the national GDP of Italy were also used. The data were obtained from FAO database (http://faostat.fao.org/site/613/ DesktopDefault.aspx?PageID=613#ancor). The econo- mic data were converted to USD$2007 values using
the online monetary inflation calculator (http://www. usinflationcalculator.com/) in order to be comparable with the monetary units used in ESs approach of Costanza et al. [2].
3.2. AESs Assessment and Priority of Sustainable Agriculture Index
For AESs assessment, the agricultural land cover- age was multiplied by the monetary values of each AES in USD$2007 proposed by Costanza et al. [2] for croplands (Table 1). The total value of the agricultural
GDP provided by FAO at national level was compared with the total value of AESs in order to assess the potential non-market value of AESs, which can be suc- ceeded in the Italian territory. At regional and provincial level, the non-market value of AESs was assumed proportional due to lack of data of agricultural GDP at administrative unit level.
The target to achieve the potential value of non-market AESs requires the development of integrated management strategies towards a more sustainable agriculture. One of the first things needed in order to develop such strategies is to set priorities for the imple- mentation of management schemes. The most typical approach used for this purpose is based on the degree of agricultural pollution based on environmental stand- ards such as those provided by EU Member States (e.g. Nitrates Directive - 91/676/EC, Water Framework Directive - 2000/60/EC etc.). This approach requires continuous and extensive monitoring of environmental parameters of high cost and labor.
On the other hand a more simplified approach is proposed in this study, which is based on the extent of agricultural land within an administrative unit in respect to other administrative ones. The approach is based on a simplified priority index, which uses the % coverage of agricultural land and the total coverage in area units of a number of administrative units as follows:
1 2 i ,i ,i
P f
=
×
f
(1) min 1, min max max min1 for
i ix x
if
x
x x
x
x
−
=
+
≤
≤
−
and min 2, min max max min1 for
i i iy y
f
y
y y
y
y
−
=
+
≤
≤
−
(2a,b)where xi: is the % coverage of agricultural land in a
province or a region i, and yi: is the coverage in area
26 Journal of Agriculture Food and Development, 2016, Vol. 2 Gaglio et al.
minimum and the maximum value of x and y para- meters correspond to the respective minimum and maximum values observed in the set of administrative units. f1 and f2 take always values between 1-2 and
thus also Pi is restricted between 1-4. The +1 inside the
f1 and f2 functions is used to avoid having 0 values in
the multiplication.
The concept of using the % coverage x and the total coverage y in area units as two independent para- meters is based on the fact that when a region has lower % of agricultural land then it also has greater % of natural land. Natural lands provide a high degree of ESs by themselves but also interact with agro-ecosys- tems mitigating the impact of agricultural activities. The parameter y of agricultural land coverage in area units is used as a substitute of the non-market AESs be- cause in this study they are considered proportional to agricultural land coverage in both regional and pro- visional scale. The higher the value of Pi of a region in
respect to others, the higher is the priority to implement sustainable agronomic practices in this region.
4. RESULTS
According to CLC2012, the total coverage of agri- cultural land per province and region is given in Figure
1a,b while the respective percentage % of agricultural
land for the respective administrative units is given in Figure 2a,b. The mean total economic contribution of
agricultural products of the period 2010-2012 in Italian economy at national level was estimated at 38.383 billion USD$2007 according to FAO data.
Table 1: Economic Evaluation of ESs for Agricultural Land According to the Benefit-Transfer Appr- oach of Costanza et al. [2]
Agro-Ecosystem
Services (AESs) USD$2007/ ha/Year %
Food production1 2323 41.72% Raw materials1 219 3.93% Genetic resources1 1042 18.71% Water supply1 400 7.18% Climate regulation2 411 7.38% Erosion control2 107 1.92% Waste treatment2 397 7.13% Biological control2 33 0.59% Soil formation3 532 9.55% Pollination3 22 0.40% Cultural services4 82 1.47% Total sum 5568 100%
1Provisioning Services, 2Regulation services, 3Supporting services, 4Cultural
services.
The total potential contribution of AESs at national level was estimated at 85.111 billion USD$2007 taking into account the total value of AESs per unit area provided in Table 1 (5568 USD$2007/ha/year) while
the respective proportions at regional and provincial level are given in Figure 3a,b. If we consider that the
AESs of food and raw materials production which are directly linked with the market are together the 45.65% of the total AESs (Table 1), then according to Costanza
et al. [2] the expected value of these AESs provided by
the Italian agricultural land is estimated at 38.853 billion USD$2007. This value is extremely close to the value provided by FAO verifying the values in Table 1 for
AESs linked to the market. If we also assume that the rest values of Table 1 for the non-market AESs are
realistic,thenarespective54.35% of the total estimated AESs can provide an estimation of the potential non-market contribution of Italian agricultural land in the national, regional and provincial economy. According to the above, the non-market value of AESs at national scale was estimated at ~46.2 billion USD$2007, while estimations of the total non-market AESs at regional and provincial level are given in Tables 2 and 3. The
multiplication of the total non-market AESs values of
each region (Table 2) or province (Table 3) with the
respective percentages given in Table 1 can provide
estimations for each specific non-market AES.
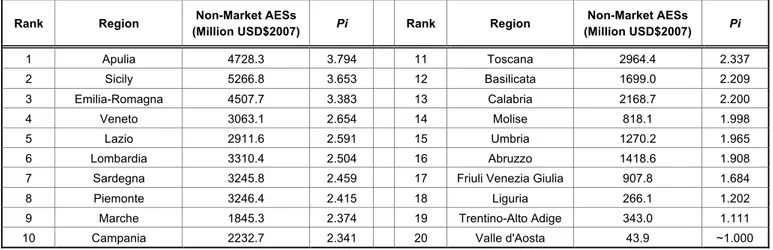
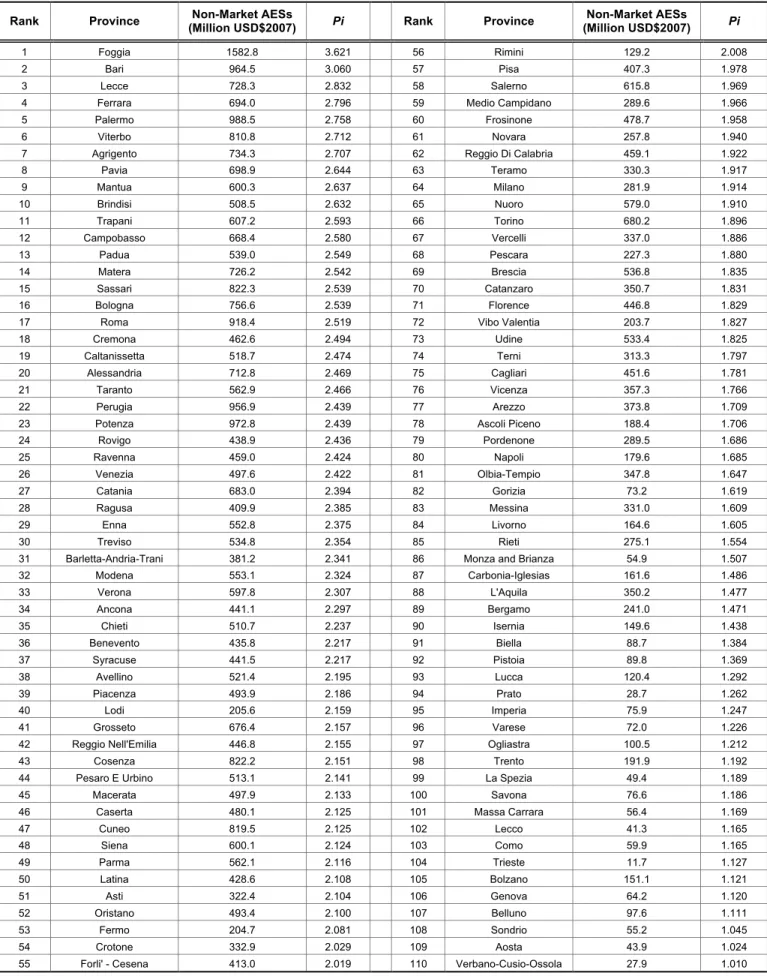
The estimated potential value of non-market AESs at national level is extremely large. It is indicative that for the 15 out of 20 regions the non-market AESs value exceeds the 1 billion USD$2007 while for the 39 out 110 provinces exceeds the 0.5 billion USD$2007. Table 2 and 3 also provides the ranking of regions and
provinces based on Pi index. This ranking scheme can
be used as tool to set priorities for the implementation of sustainable agronomic practices based on their contribution to non-market AESs.
Figure 2: % coverage of agricultural land a) per province and b) per region in Italy according to CLC2012.
Figure 3: Total contribution of AESs in USD$2007 a) at provincial level and b) regional level according to Costanza et al. [2] (Table 1).
28 Journal of Agriculture Food and Development, 2016, Vol. 2 Gaglio et al.
5. DISCUSSION
The estimated non-market AESs highlight the important economic contribution of agro-ecosystems that can be succeeded beyond food and raw materials production in the Italian agricultural land. Of course, for succeeding these values it is prerequisite to a) move towards more sustainable agricultural practices and b) to increase the awareness and willingness of politics, farmers, scientists, stakeholders and citizens non-related to agriculture to assess and exploit the econo- mic benefits, which can be derived from non-market AESs. Such actions require high-level political interven-
tions in local economies aiming to create a profitable interaction between the farmers and the rest society. Therest society should understand the economic bene- fits of such interactions and should support economic- allythefarmerstomovetowardsmore sustainable prac- tices that usually reduce their net agricultural income.
The last 25 years, the European countries have made a serious effort towards organic agriculture. Italy is one of the leading countries with the largest cover- age of organic and in-conversion farming in Europe (http://faostat.fao.org) [46]. Apart from waste treatment, other benefits of this effort have already been identified in many areas of Italy and they are related to increase of biodiveristy [47], carbon sequestration [48] and recreation-agrotourism activities [49]. At the same time, Italy remains one of the top producers in terms of yields at European scale. This suggests that the total recommended ESs value for agricultural land provided by Constanza et al. [2] may underestimate the real capacity of Italian croplands for ESs since non-market regulation, supporting and cultural ESs are expected to be much higher. Future studies in Italian territory are
necessary in order to assess the non-market economic effect of increased organic agriculture in the local economies in order to be used as a supporting tool for convincing authorities to promote and apply such activities.
As concern the amount of non-market AESs which can be derived by SEPs, the study provides potential estimations and ranking priorities for the implementa- tion of SEPs for three different administrative scales: national, regional and provincial scale. It has to be noted that the smaller the administrative scale is, the larger are the errors of non-market AESs estimations due to more distinct a) differences in the intrinsic pro- perties of agricultural land (e.g. climate, soil, topogra- phy), b) differences in the efficiency of SEPs due to crop type differences (e.g. irrigated or non-irrigated crops) c) differences of natural land types which co-exist with agricultural land, d) differences in the avail- able capital derived from other sources at adminis- trative scale which can be used for investments and support of SEPs. All the above should be taken into account in order to build a multi-disciplinary approach for setting priorities for SEPs implementation based on criteria which will fairly disseminate both the profit of non-market AESs and the additional cost of SEPs.
6. CONCLUSIONS
The potential economic contribution of the non-market services at national, regional, and provincial level in Italy was assessed in this study. A simplified index-based method for setting priorities at different scales of administration units for the implementation of SAPs was also proposed. The results showed that the potential non-market value of AESs in Italy can reach
Table 2: Potential Contribution of Non-Market AESs in USD$2007 in Italy at Regional Level and Priority Ranking for Implementing Sustainable Agricultural Practices at Regional Level Based on the Pi Index
Rank Region (Million USD$2007) Non-Market AESs Pi Rank Region (Million USD$2007) Non-Market AESs Pi
1 Apulia 4728.3 3.794 11 Toscana 2964.4 2.337 2 Sicily 5266.8 3.653 12 Basilicata 1699.0 2.209 3 Emilia-Romagna 4507.7 3.383 13 Calabria 2168.7 2.200 4 Veneto 3063.1 2.654 14 Molise 818.1 1.998 5 Lazio 2911.6 2.591 15 Umbria 1270.2 1.965 6 Lombardia 3310.4 2.504 16 Abruzzo 1418.6 1.908
7 Sardegna 3245.8 2.459 17 Friuli Venezia Giulia 907.8 1.684
8 Piemonte 3246.4 2.415 18 Liguria 266.1 1.202
9 Marche 1845.3 2.374 19 Trentino-Alto Adige 343.0 1.111
Table 3: Potential Contribution of Non-Market AESs in USD$2007 in Italy at Provincial Level and Priority Ranking for Implementing Sustainable Agricultural Practices at Provincial Level Based on the Pi Index
Rank Province (Million USD$2007) Non-Market AESs Pi Rank Province (Million USD$2007) Non-Market AESs Pi
1 Foggia 1582.8 3.621 56 Rimini 129.2 2.008
2 Bari 964.5 3.060 57 Pisa 407.3 1.978
3 Lecce 728.3 2.832 58 Salerno 615.8 1.969
4 Ferrara 694.0 2.796 59 Medio Campidano 289.6 1.966
5 Palermo 988.5 2.758 60 Frosinone 478.7 1.958
6 Viterbo 810.8 2.712 61 Novara 257.8 1.940
7 Agrigento 734.3 2.707 62 Reggio Di Calabria 459.1 1.922
8 Pavia 698.9 2.644 63 Teramo 330.3 1.917 9 Mantua 600.3 2.637 64 Milano 281.9 1.914 10 Brindisi 508.5 2.632 65 Nuoro 579.0 1.910 11 Trapani 607.2 2.593 66 Torino 680.2 1.896 12 Campobasso 668.4 2.580 67 Vercelli 337.0 1.886 13 Padua 539.0 2.549 68 Pescara 227.3 1.880 14 Matera 726.2 2.542 69 Brescia 536.8 1.835 15 Sassari 822.3 2.539 70 Catanzaro 350.7 1.831 16 Bologna 756.6 2.539 71 Florence 446.8 1.829
17 Roma 918.4 2.519 72 Vibo Valentia 203.7 1.827
18 Cremona 462.6 2.494 73 Udine 533.4 1.825
19 Caltanissetta 518.7 2.474 74 Terni 313.3 1.797
20 Alessandria 712.8 2.469 75 Cagliari 451.6 1.781
21 Taranto 562.9 2.466 76 Vicenza 357.3 1.766
22 Perugia 956.9 2.439 77 Arezzo 373.8 1.709
23 Potenza 972.8 2.439 78 Ascoli Piceno 188.4 1.706
24 Rovigo 438.9 2.436 79 Pordenone 289.5 1.686 25 Ravenna 459.0 2.424 80 Napoli 179.6 1.685 26 Venezia 497.6 2.422 81 Olbia-Tempio 347.8 1.647 27 Catania 683.0 2.394 82 Gorizia 73.2 1.619 28 Ragusa 409.9 2.385 83 Messina 331.0 1.609 29 Enna 552.8 2.375 84 Livorno 164.6 1.605 30 Treviso 534.8 2.354 85 Rieti 275.1 1.554
31 Barletta-Andria-Trani 381.2 2.341 86 Monza and Brianza 54.9 1.507
32 Modena 553.1 2.324 87 Carbonia-Iglesias 161.6 1.486 33 Verona 597.8 2.307 88 L'Aquila 350.2 1.477 34 Ancona 441.1 2.297 89 Bergamo 241.0 1.471 35 Chieti 510.7 2.237 90 Isernia 149.6 1.438 36 Benevento 435.8 2.217 91 Biella 88.7 1.384 37 Syracuse 441.5 2.217 92 Pistoia 89.8 1.369 38 Avellino 521.4 2.195 93 Lucca 120.4 1.292 39 Piacenza 493.9 2.186 94 Prato 28.7 1.262 40 Lodi 205.6 2.159 95 Imperia 75.9 1.247 41 Grosseto 676.4 2.157 96 Varese 72.0 1.226
42 Reggio Nell'Emilia 446.8 2.155 97 Ogliastra 100.5 1.212
43 Cosenza 822.2 2.151 98 Trento 191.9 1.192
44 Pesaro E Urbino 513.1 2.141 99 La Spezia 49.4 1.189
45 Macerata 497.9 2.133 100 Savona 76.6 1.186
46 Caserta 480.1 2.125 101 Massa Carrara 56.4 1.169
47 Cuneo 819.5 2.125 102 Lecco 41.3 1.165 48 Siena 600.1 2.124 103 Como 59.9 1.165 49 Parma 562.1 2.116 104 Trieste 11.7 1.127 50 Latina 428.6 2.108 105 Bolzano 151.1 1.121 51 Asti 322.4 2.104 106 Genova 64.2 1.120 52 Oristano 493.4 2.100 107 Belluno 97.6 1.111 53 Fermo 204.7 2.081 108 Sondrio 55.2 1.045 54 Crotone 332.9 2.029 109 Aosta 43.9 1.024
55 Forli' - Cesena 413.0 2.019 110 Verbano-Cusio-Ossola 27.9 1.010
30 Journal of Agriculture Food and Development, 2016, Vol. 2 Gaglio et al.
~46.2 billion USD$2007. This estimation shows that non-market AESs can play an important role in the na- tional GDP. Finally, a priority ranking for the implement- ation of SAPs was proposed at regional and provincial level that can be a valuable decision support tool for promoting SAPs. Future studies are necessary in order to develop tools for assessing the variation of ESs with- in the agricultural ecosystems due to the high differ- ences in environmental conditions, agronomic practices and crops. This would allow to better estimate the non-market ESs and their contribution in the local econo- miesbutalsoto create a more robust basis for develop- ing and improving SAPs based on economical evidenc- es that are more comprehensive to decision makers.
REFERENCES
[1] Costanza R, D’Arge R, De Groot R, Farber S, Grasso M, Hannon B, et al. The value of the world's ecosystem services and natural capital. Nature 1997; 387(6630): 253-260. http://dx.doi.org/10.1038/387253a0
[2] Costanza R, de Groot R, Sutton P, van der Ploeg S, Anderson SJ, Kubiszewski I, et al. Changes in the global value of ecosystem services. Global Environ Chang. 2014; 26(1): 152-158.
http://dx.doi.org/10.1016/j.gloenvcha.2014.04.002
[3] de Groot R, Brander L, van der Ploeg S, Costanza R, Bernard F, Braat L, et al. Global estimates of the value of ecosystems and their services in monetary units. Ecosyst Serv. 2012; 1(1): 50-61.
http://dx.doi.org/10.1016/j.ecoser.2012.07.005
[4] Gissi E, Burkhard B, Verburg PH. Ecosystem services: Build- ing informed policies to orient landscape dynamics. Int J Biodivers Sci Ecosyst Serv Manage. 2015; 11(3): 185-189. http://dx.doi.org/10.1080/21513732.2015.1071939
[5] Power AG. Ecosystem services and agriculture: tradeoffs andsynergies.PhilosTRoySoc B: Biol Sci. 2010; 365(1554): 2959-2971.
http://dx.doi.org/10.1098/rstb.2010.0143
[6] Porter J, Costanza R, Sandhu H, Sigsgaard L, Wratten S. The value of producing food, energy, and ecosystem services within an agro-ecosystem. AMBIO 2009; 38(4): 186-193. http://dx.doi.org/10.1579/0044-7447-38.4.186
[7] Su BY, Chen SB, Li YG, Yang WY. Intercropping enhances the farmland ecosystem services. Acta Ecol Sin. 2013; 33(14): 4505-4514.
http://dx.doi.org/10.5846/stxb201204200574
[8] Renting H, Marsden TK, Banks J. Understanding alternative food networks: Exploring the role of short food supply chains in rural development. Environ Plann A 2003; 35(3): 393-411. http://dx.doi.org/10.1068/a3510
[9] Ortmann GF, King RP. Research on agri-food supply chains in Southern Africa involving small-scale farmers: Current status and future possibilities. Agrekon 2010; 49(4): 397-41. http://dx.doi.org/10.1080/03031853.2010.526428
[10] Atchison JE. Present status and future potential for utilization of nonwood plant fibers – a worldwide review. TAPPI CA Rep. 1973; 2: 69-89.
[11] Md Tahir P, Ahmed AB, Saifulazry SOA, Ahmed Z. Retting process of some bast plant fibres and its effect on fibre quality: A review. BioResources 2011; 6(4): 5260-5281.
[12] McKendry P. Energy production from biomass (part 1): over- view of biomass. Bioresource Technol. 2002; 83(1): 37-46. http://dx.doi.org/10.1016/S0960-8524(01)00118-3
[13] Gissi E, Gaglio M, Reho M. Sustainable energy potential from biomass through ecosystem services trade-off analysis: The case of the Province of Rovigo (Northern Italy). Ecosyst Serv. 2016; (in press) DOI: 10.1016/j.ecoser.2016.01.004. http://dx.doi.org/10.1016/j.ecoser.2016.01.004
[14] Ten Kate K, Laird SA. The commercial use of biodiversity: Access to genetic resources and benefit-sharing. Earthscan Publications Ltd, London – Sterling, VA, 2002; p.398. [15] Reddy JM. Optimization of furrow irrigation system design
parameters considering drainage and runoff water quality constraints. Irrig Sci. 1994; 15(2-3): 123-136.
http://dx.doi.org/10.1007/BF00187198
[16] Ramos MC, Martínez-Casasnovas JA. Impact of land level- ing on soil moisture and runoff variability in vineyards under different rainfall distributions in a Mediterranean climate and its influence on crop productivity. J Hydrol. 2006; 321(1-4): 131-146.
http://dx.doi.org/10.1016/j.jhydrol.2005.07.055
[17] Zribi W, Aragüés R, Medina E, Faci JM. Efficiency of inorgan- ic and organic mulching materials for soil evaporation control. Soil Till Res. 2015; 148: 40-45.
http://dx.doi.org/10.1016/j.still.2014.12.003
[18] Araya T, Nyssen J, Govaerts B, Deckers J, Cornelis WM. Impacts of conservation agriculture-based farming systems on optimizing seasonal rainfall partitioning and productivity on vertisols in the Ethiopian drylands. Soil Tillage Res. 2015; 148: 1-13.
http://dx.doi.org/10.1016/j.still.2014.11.009
[19] Ur Rehman O, Rashid M, Kausar R, Alvi S, Sajjad MR. Assessment of runoff and sediment losses under different slope gradients and crop covers in semi-arid watersheds. Soil Environ. 2015; 34(1): 75-81.
[20] Morgan JA, Follett RF, Allen Jr LH, Del Grosso S, Derner JD, Dijkstra F, et al. Carbon sequestration in agricultural lands of the United States. J Soil Water Conserv. 2010; 65(1): 6A-13A.
http://dx.doi.org/10.2489/jswc.65.1.6A
[21] Gissi E, Gaglio M, Reho M. Trade-off between carbon stor- age and biomass-based energy sources ecosystem services, the case study from the province of Rovigo (Italy). Ann Bot. 2014; 4: 73-81.
[22] Oenema O. Governmental policies and measures regulating nitrogen and phosphorus from animal manure in European agriculture. J Animal Sci. 2004; 82(E-Suppl): 196-206. [23] Aschonitis VG, Lekakis EH, Petridou NC, Koukouli SG,
Pavlatou-Ve A. Nutrients fixation by algae and limiting factors of algal growth in flooded rice fields under semi-arid Mediterr- aneanconditions:Case study in Thessaloniki plain in Greece. Nutr Cycl Agroecosyst. 2013; 96(1): 1-13.
http://dx.doi.org/10.1007/s10705-013-9573-x
[24] Rigby H, Clarke BO, Pritchard DL, Meehan B, Beshah F, Smith SR, et al. A critical review of nitrogen mineralization in biosolids-amendedsoil,the associated fertilizer value for crop production and potential for emissions to the environment. Sci Tot Environ. 2016; 541: 1310-1338.
http://dx.doi.org/10.1016/j.scitotenv.2015.08.089
[25] Castaldelli G, Soana E, Racchetti E, Vincenzi F, Fano EA, Bartoli M. Vegetated canals mitigate nitrogen surplus in agricultural watersheds. Agr Ecosyst Environ. 2015; 212: 253-262.
http://dx.doi.org/10.1016/j.agee.2015.07.009
[26] Flint ML, Dreistadt SH. Natural Enemies Handbook: The Illustrated Guide to Biological Pest Control. (Ed.Clark, J.K.)
University of California Press, Division of Agriculture and Natural Resources. 1998; Pub. 3386: p.154.
[27] Orr D. Biological control and integrated pest management. In: Integrated Pest Management. Vol. 1. Innovation-Develop- ment Process. (Eds. Peshin, R., Dhawan, A.K.). Springer, Dordrecht, The Netherlands, 2009; 207-240.
http://dx.doi.org/10.1007/978-1-4020-8992-3_9
[28] Nicholls CI, Altieri MA. Plant biodiversity enhances bees and other insect pollinators in agroecosystems - A review. Agron Sustain Dev. 2013; 33(2): 257-274.
http://dx.doi.org/10.1007/s13593-012-0092-y
[29] Hajjar R, Jarvis DI, Gemmill-Herren B. The utility of crop genetic diversity in maintaining ecosystem services. Agr Ecosys Environ. 2008; 123(4): 261-270.
http://dx.doi.org/10.1016/j.agee.2007.08.003
[30] Berthelin J, Leyval C, Laheurte F, De Giudici P. Involvement of roots and rhizosphere microflora in the chemical weather- ing of soil minerals. Plant Root Growth 1991; 187-210. [31] Li Y, Zhang Q, Wan G, Huang R, Piao H, Bai L, et al. Phys-
ical mechanisms of plant roots affecting weathering and leaching of loess soil. Sci Chin Ser D Earth Sci. 2006; 49(9): 1002-1008.
http://dx.doi.org/10.1007/s11430-006-1002-4
[32] Leake JR, Duran AL, Hardy KE, Johnson I, Beerling DJ, Banwart SA, et al. Biological weathering in soil: The role of symbiotic root-associated fungi biosensing minerals and directing photosynthate-energy into grain-scale mineral weathering. Mineralogic Magaz. 2008; 72(1): 85-89.
http://dx.doi.org/10.1180/minmag.2008.072.1.85
[33] Rawitz E, Hadas A, Etkin H, Margolin M. The effect of var- ious residue mulch-tillage combinations on soil physical con- ditions and performance of irrigated cotton. Soil Till Res. 1994; 32(4): 347-366.
http://dx.doi.org/10.1016/0167-1987(94)00419-F
[34] Maurya PR. Effect of tillage and residue management of maize and wheat yield and on physical properties of an irrigated sandy loam soil in Northern Nigeria. Soil Till Res. 1986; 8(C): 161-170.
http://dx.doi.org/10.1016/0167-1987(86)90331-4
[35] Fuentes M, Govaerts B, De León F, Hidalgo C, Dendooven L, Sayre KD, et al. Fourteen years of applying zero and conventional tillage, crop rotation and residue management systems and its effect on physical and chemical soil quality. Eur J Agron. 2009; 30(3): 228-237.
http://dx.doi.org/10.1016/j.eja.2008.10.005
[36] Swinton SM, Lupi F, Robertson GP, Hamilton SK. Ecosystem services and agriculture: Cultivating agricultural ecosystems for diverse benefits. Ecol Econ. 2007; 64 (2): 245-252. http://dx.doi.org/10.1016/j.ecolecon.2007.09.020
[37] Van Berkel DB, Verburg PH. Sensitising rural policy: Assess- ing spatial variation in rural development options for Europe. Land Use Policy 2011; 28 (3): 447-459.
http://dx.doi.org/10.1016/j.landusepol.2010.09.002
[38] Fleischer A, Tsur Y. Measuring the recreational value of agricultural landscape. Eur Rev Agr Econ. 2000; 27(3): 385-398.
http://dx.doi.org/10.1093/erae/27.3.385
[39] Geiger F, Bengtsson J, Berendse F, Weisser WW, Emmerson M, Morales MB, et al. Persistent negative effects of pesticides on biodiversity and biological control potential on European farmland. Bas App Ecol. 2010; 11(2): 97-105. http://dx.doi.org/10.1016/j.baae.2009.12.001
[40] Konikow LF, Kendy E. Groundwater depletion: A global problem. Hydrogeol J. 2005; 13(1): 317-320.
http://dx.doi.org/10.1007/s10040-004-0411-8
[41] Colombani N, Mastrocicco M, Giambastiani BMS. Predicting Salinization Trends in a Lowland Coastal Aquifer: Comacchio (Italy). Water Res Manage. 2015; 29(2): 603-618.
http://dx.doi.org/10.1007/s11269-014-0795-8
[42] Withers PJA, Neal C, Jarvie HP, Doody DG. Agriculture and eutrophication: Where do we go from here? Sustainability. 2014; 6(9): 5853-5875.
http://dx.doi.org/10.3390/su6095853
[43] Reay DS, Davidson EA, Smith KA, Smith P, Melillo JM, Dentener F, et al. Global agriculture and nitrous oxide emiss- ions. Nature Clim Change. 2012; 2(6): 410-416.
http://dx.doi.org/10.1038/nclimate1458
[44] Pitman M, Läuchli A. Global impact of salinity and agricultural ecosystems. In: Salinity: Environment-Plants-Molecules, Springer, The Netherlands, A. Läuchli, U. Lüttge (Eds.) 2002; pp. 3-20.
[45] Stringer L. Can the UN Convention to Combat Desertification guide sustainable use of the world's soils? Front Ecol Environ. 2008; 6(3): 138-144.
http://dx.doi.org/10.1890/070060
[46] Gamboni M, Moscatelli S. Organic agriculture in Italy: chall- enges and perspectives. Organic Agr. 2015; 5(3): 165-177. http://dx.doi.org/10.1007/s13165-015-0098-2
[47] Genghini M, Gellini S, Gustin M. Organic and integrated agriculture: The effects on bird communities in orchard farms in northern Italy. Biodivers Conserv. 2006; 15(9): 3077-3094. http://dx.doi.org/10.1007/s10531-005-5400-2
[48] Lazzerini G, Migliorini P, Moschini V, Pacini C, Merante P, Vazzana C. A simplified method for the assessment of carbon balance in agriculture: An application in organic and conventional micro-agroecosystems in a long-term experi- ment in Tuscany, Italy. Ital J Agron. 2014; 9(2): 55-62. http://dx.doi.org/10.4081/ija.2014.566
[49] Privitera D. Combining organic agriculture and recreation: Evidence from Italy. Agricultural Management Strategies in a Changing Economy 2015; 301-317.
Received on 11-02-2016 Accepted on 03-03-2015 Published on 09-03-2016
© 2016 Gaglio et al.; Licensee Revotech Press.
This is an open access article licensed under the terms of the Creative Commons Attribution Non-Commercial License (http://creativecommons.org/licenses/by-nc/3.0/), which permits unrestricted, non-commercial use, distribution and reproduction in any medium, provided the work is properly cited.
View publication stats View publication stats