Department of Mechanical and Industrial Engineering XXI Ph.D. Fellowship
(2006-2008)
Multi-Step Approaches
for Comprehensive Modeling of Diesel Engine
Fuel Injection Processes
Fulvio Palmieri
Advisor Professor:
chiar.mo prof. ing. Giancarlo Chiatti
Coordinator:
Contents
Section I – Map of the work
1.
Abstract
62.
Introduction
72.1 Overview 7
2.2 Specific overview, state of the art 9
2.2.1 Injection rate
2.2.2 Atomization and air-fuel mixture formation
2.3 Motivation and Methodologies 13
2.3.1 Numerical modeling of injection processes
2.3.2 Multi-step modeling (0D-3D CFD) for injection processes simulation
2.3.3 Double step modeling (3D-0D) of fuel metering component operation for inline pump injection systems 2.3.4 Comprehensive multi-step lumped modeling of injection
system operation, spray formation and fuel vaporization
2.4 Applications 19
2.4.1 Development of a three-step cascade modeling procedure for sequential simulation of inline-pump injection system operation, nozzle flow features and in-cylinder spray formation
2.4.2 Application of the cascade modeling procedure evaluating fuel influence on common rail system performances 2.4.3 Comprehensive modeling of injection: the introduction of
the fuel in the combustion chamber as the result of the correct integration of component roles
2.4.4 Evaluation of injector dynamic and nozzle flow features in multiple injection strategies. Modeling capabilities of the multi step unitary approach
2.4.5 Contribution of sequential modeling approach investigating dynamic features of injectors
2.4.6 Two step 3D-0D modeling of inline pump systems. The CFD contribution for detailed parameter lumping
2.4.7 Multi step lumped modeling of injection process. Development of a comprehensive injection process model for low computational effort investigations
Section II
Case studies
Each chapter of this section is conceived as a single unit, which consists of a complete investigation on specific facets related to the injection process and its modeling. In order to ease the consultation of the work, all the chapters are provided with independent nomenclature and list of references.
3.
Coupling Codes For a Multi-step Modeling Approach of Diesel
Injection System
233.1 Introduction 23
3.2 Injection system. 24
3.3 Nozzle flow modelling 24
3.4 Spray and chamber flow simulation 27
3.5 Results 30 3.5.1 Injection characteristics 3.5.2 Injector flow 3.5.3 Chamber flow/spray 3.6 Concluding remarks 41 3.7 Nomenclature 42 3.8 References 43
4.
Multi-step Modeling of Fuel Influence on Common Rail
Injection
System
Performance
45
4.1 Injection system 45
4.2 Spray and chamber flow simulation 47
4.3 Results 50 4.4 Injection characteristics 50 4.5 Injector flows 52 4.6 Spray features 55 4.7 Concluding remarks 58 4.8 Nomenclature 59 4.9 References 60
5.
Injector Dynamic and Nozzle Flow Features in
Multiple
Injection
Modeling
62
5.1 Injection system 62
5.2 Injector features and nozzle type 64
5.3 Results 66 5.3.1 Injection System 5.3.2 Nozzle flow 5.4 Concluding remarks 76 5.5 Nomenclature 76 5.6 Appendix 77 5.7 References 78
6.
Diesel VCO Injector: Geometric Layout and Operating
Condition influence. Nozzle Flow Modeling and
3D
in-Cylinder
Simulation
80
6.1 Injection system 80
6.2 Injector geometry and configuration 81
6.4 Results 87 6.4.1 Injection System 6.4.2. Nozzle Flow 6.4.3 Chamber Flow/Spray 6.5 Concluding remarks 98 6.6 Nomenclature 98 6.7 References 100
7.
Mini-sac Injector: Modeling Needle Motion Influence
on Nozzle Flow in High Pressure Injection System
1027.1 Introduction 102
7.2 Injector model 104
7.3 Injector flow modeling 104
7.4 Results 108
7.5 Concluding remarks 115
7.6 Nomenclature 116
7.7 References 117
8.
Flow Features in Reduced Dwell Time Diesel Injector
1198.1 Introduction 119
8.2 0/1-D injection system model 120
8.3 Injector features and lift modeling 122
8.4 Results 124
8.5 Concluding remarks 134
8.6 Nomenclature 134
8.7 References 135
9.
Inline Pump Internal Flow Characterization for Optimized
Diesel Injection – 3D-CFD Evaluation of Pump Passages
Discharge
Coefficients
136
9.1 Introduction 136
9.2 Fuel injection system 137
9.3 Lumped/1D approach 137
9.3.1 Flow through orifices modeling 9.3.2 3D flow analysis
9.3.3 Discharge coefficient evaluation
9.4 Simulated system performance 143
9.5 Concluding remarks 147
9.6 Appendix A - Multiphase flow modeling 147 9.7 Appendix B – Cdsetting influence 148
9.8 Nomenclature 149
9.9 References 150
10. Multi-Step
Lumped
Parameter
Fuel Injection and Vaporization
Modeling for Diesel Engine Performance Analysis
15110.1 Introduction 151
10.2 Fuel injection system 151
10.3 Injection system modeling - I Simulation Module 152 10.4 Fuel spray dynamics - II Simulation Module 153 10.5 Droplet evaporation - III Simulation Module 154 10.6 Comparison among models and validation 156
10.7 Results 157
10.8 Fuel spray model 160
10.9 Vaporization model 162
10.10 Fuel influence on engine performance 165
10.11 Concluding remarks 165
10.12 Nomenclature 166
10.13 Appendix A 167
10.14 References 172
11.
References
of
Published
Works
176
12.
Concluding
Remarks
177
1. Abstract
The overall optimization of diesel fuel injection equipment and combustion process is mandatory to fulfill the future emission regulations. Among the involved phenomena, a preliminary role is played by the strong link between the combustion behavior and the adopted strategies to promote the mixing of reactants. The aim of the present work is to develop a comprehensive modeling approach, having the capability to take the deep connection between fuel injection phenomena into account. For this scope, different computational tools, characterized by different roles, have been used and coupled, accounting for the interdependencies of the relevant sub-processes. Three main multi-step modeling approaches are outlined and then used in the analysis of practical cases; these can be summarized as follows: 1) multi-step modeling (0D-3D CFD) for injection process and spray simulation with a unitary approach; 2) double step modeling (3D-0D) of fuel metering component operation; 3) comprehensive multi-step lumped modeling of injection system operation, spray formation and fuel vaporization. The mechanical-hydraulic modeling of the injection systems is based on the 0-1D code AMESim. To model the in-cylinder flows and the 3D transient nozzle flow, the commercial FIRE code is used, whereas the lumped modeling of evaporation processes in cylinder ambient is self FORTRAN implemented. Several cases have been considered and the contribution of the modeling approach is presented evaluated. Two different injection system types (inline pump and common rail systems) are considered in the applications. Investigations are devoted to evaluate the influence on injection process of fuel characteristics and composition, injection strategies, injector layout, geometrical features and needle operating conditions.
2. Introduction
2.1 Overview
The market share of diesel equipped passenger car has become wider and wider during the last years. Among the various factors, low fuel consumption, high power density and torque behavior are the main reasons of such a relatively recent diffusion.
As regards the new production cars, since 1998 the European Automobile Manufacturers’ Association (ACEA) is playing an active part in the reduction of the mean fuel consumption. To achieve such a goal, it is widely acknowledged that diesel engine represents a valid answer to the problem; the manufacturers plans (until 2012) count to increase the diesel market at 50% (in respect to gasoline) and to maintain it. Indeed, due to the relatively high efficiency, direct injected diesel engines retain an advantage in fuel economy (compared to the spark ignited engine performances). The biggest challenge in diesel applications is the future emission legislation in mostly all markets over the world.
Currently more and more countries around the globe are legislating controls aimed at achieving safe concentrations of these pollutants by regulating their level of emissions from combustion sources, notably those discharged from the exhausts of automobiles. The maximum allowable levels of emissions from automobiles are already regulated by many governments using measures in grams per kilometer or grams per mile. Emission control standards were initially established in the major
centers of Japan, the United States, and the European Union. These regions have similar approaches to emission reduction, although each set of regulations is tailored to specific requirements. The US system, based on groups of regulations called Tiers, has decreasing emissions limits and increasing durability requirements. The European regulations also define increasing restrictions. Currently Euro V sets limits to 2014 when Euro VI will take effect. The most stringent emissions standards in the world are to be found in California which has become the benchmark for worldwide environmental legislation. The legislation refers to LEV (Low Emission Vehicle), ULEV (Ultra LEV), SULEV (Super Ultra LEV), and ZEV (Zero Emission Vehicle).
In such a scenario, the goal of research and development activities is the definition of strategies able to satisfy the emissions regulations; diesel finds itself more and more faced with continuously burdening challenges which have to be overcome within the technical progress. While the gasoline engine settles the benchmark for noise vibration harshness (NVH), the complexity of the overall diesel system becomes tends to increase in spite of the tremendous desire to lower the overall system costs. To overcome this challenge an overall system optimization of the fuel injection equipment, the engine and combustion process and the exhaust gas treatment are mandatory.
In the frame of direct injected diesel engines, a preliminary role is played by the strong link that exists between the combustion behavior and the strategies that are adopted to promote the mixing among reactants in combustion chamber. From an operational point of view, fuel is introduced in combustion chamber as a fine spray and it evolves into heat release and pollutant emission. The recent trends in combustion control research are gaining significance, much more evidently than in the past. Heat release (and pollutant formation) is supposed to be controlled by a refined shaping of fuel injection rate. Therefore, it seems that research approaches take advantage of consideration that fuel spray formation is an aspect of several interrelated phenomena. According to this viewpoint, a chain process (that lasts until the exhaust phase) starts when fuel is injected into the combustion chamber. So the engine can be viewed as a combustion system in which injection system, cylinder volume and gas flows have strongly interrelated tasks.
2.2 Specific Overview and State of the art
2.2.1 Injection rate
Diesel engine optimization is a challenging task due to the interrelation among the several phenomena that take place in the cylinder. Injection systems features (e.g. maximum injection pressure - tied to fuel atomization and droplet velocity), and flexibility (e.g. fuel rate shape capability and multiple injection) define the limits in determining the optimum system configuration for the above mentioned diesel engine goals. An important contribution comes from the introduction of common rail systems. During the recent years, multiple injection strategies have been implemented for simultaneously reducing diesel engine NOx and particulate emissions. Moreover, the up to date engine tests show that improvement of multiple injection still has the potential of achieving a reduction in the peak heat release and the NOx and particle emissions. To stay on very small injection quantities and fully flexible multiple injection events, the optimization of injection dynamics with at higher pressure level is desired.
The need for short dwell time and the small amount of fuel to deliver has driven the research to the development of piezo actuated injectors. Previous injector designs used electro-magnetic solenoids to pilot the movement of needle and feed fuel to the combustion chamber. In piezo injectors, a stack of piezo crystals expand when an electric current is applied. The first generation of piezo injectors used an indirect servo-hydraulic actuation mechanism; the development is going ahead and, in the latest implementations, the piezo ceramic actuator directly actuates the needle, so it responds to commands even more quickly, allowing the timing of the fuel pulses to
be smaller, and more accurately timed. In practice, beside the classical requirements of injection systems, like:
-flexible injection pressure
-level of maximum injection pressure, -flexible timing of multiple injections
-small and stable injection quantities to realize pilot and post injections
it is possible to outline the specific features that realize a desired injection rate (all the features show themselves during the injection time transient)
- fast needle opening
- low injection rate during ignition delay, but
- strong increase of the injection rate after start of combustion - high maximum injection rate
- fast rate decrease at the end of injection and also high needle closing velocity.
The stable and repeatable achievement of such a kind of requirements (on wide engine operating conditions) leads to a full flexible rate shape in the whole engine map, that means low emissions, high engine performance, low noise level and low fuel consumption. The automotive industry, has based the injection process improvement (and diesel engine future, as well) on the common rail systems development. With its improved performance and higher torque, common rail gave to diesel engine a new image. In conjunction with turbo charging, the injection system has helped the diesel engine achieve a breakthrough.
As a consequence the successful application of lowest emission, diesel combustion strategies must always be seen in close connection with the required engine control strategy. It is realistic, in the next future, the deep integration among the several electronically controlled systems of the engine, as VG-turbocharger, injection system and valve camshafts timing; closed loop combustion control is being developed since the recognition that, with today's flexibility on diesel engines, the start of combustion is not only controlled by the fuel injection timing. Charge condition parameters have significant effects on the combustion and thus on engine out emissions. Applying some kind of closed loop combustion control reduces the dispersion when shooting for lowest emissions and also enables future combustion strategies.
2.2.2 Atomization and air-fuel mixture formation
Injection pressure of up to 200 MPa is becoming a mandatory feature for the latest injection strategies. The liquid enters the combustion chamber with velocities that can overcome the value of 500 m/s, and the jet evolves according to the mechanisms proper of the dominating atomization regime. Two main atomization mechanisms can be identified; immediately after leaving the nozzle hole, the jet starts
to break up into a conical spray. Such a first break-up of the liquid is called primary break-up and results in large ligaments and droplets that form the dense spray in the proximity of the nozzle exit hole. In case of high-pressure injection, cavitation and turbulence, which are generated inside the injection holes, are the main break-up mechanisms. Concerning the case of turbulence induced disintegration, if the radial turbulent velocity fluctuations inside the jet, which are generated inside the nozzle, are strong enough, turbulent eddies can overcome the surface tension and leave the jet to form primary drops. Turbulence-induced primary break-up is regarded as one of the most important break-up mechanisms of high-pressure sprays. In the cavitation-induced disintegration, cavitation structures develop inside the nozzle holes because of the decrease of static pressure due to the strong acceleration of the liquid (axial pressure gradient) combined with the strong curvature of the streamlines (additional radial pressure gradient) at the inlet edge. Hence, a two-phase flow exists inside the nozzle holes. The intensity and spatial structure of the cavitation zones depends on nozzle geometry and pressure boundary conditions. The cavitation bubbles implode when leaving the nozzle because of the high ambient pressure inside the cylinder. Different opinions exist regarding whether the energy that is released during these bubble collapses contributes to the primary break-up either by increasing the turbulent kinetic energy of the jet or by causing a direct local jet break-up. However, experimental investigations have shown that the transition from a pure turbulent to a cavitating nozzle hole flow results in an increase of spray cone angle and in a decrease of penetration length. The two main break-up mechanisms in the case of high-pressure full-cone occur usually simultaneously. Injector design tries to take into account the role of the phenomena that happen inside the hole, in order to achieve a trade off among many factors such as atomization performances, material stress, nozzle lifetime, production costs and so on.
The subsequent break-up processes of already existing droplets into smaller ones are called secondary break-up and are due to aerodynamic forces caused by the relative velocity between droplets and surrounding gas. The aerodynamic forces decelerate the droplets. The drops at the spray tip experience the strongest drag force and are much more decelerated than droplets that follow in their wake. For this reason the droplets at the spray tip are continuously replaced by new ones, and the spray penetration increases. The droplets with low kinetic energy are pushed aside and form the outer spray region. Altogether, a conical full-cone spray (spray cone angle) is formed that is more and more diluted downstream the nozzle by the entrainment of air. Most of the liquid mass is concentrated near the spray axis, while the outer spray regions contain less liquid mass and more fuel vapor. Droplet velocities are maximal at the spray axis and decrease in the radial direction due to interaction with the entrained gas. In the dense spray, the probability of droplet collisions is high. These collisions can result in a change of droplet velocity and size. Droplets can break up into smaller ones, but they can also combine to form larger drops, in case of droplet coalescence. In the dilute spray further downstream the main factors of influence on further spray disintegration and evaporation are the boundary conditions imposed by
the combustion chamber such as gas temperature and density as well as gas flow (tumble, swirl). The penetration length is limited by the distance between the nozzle and the piston bowl. In detail, It has to be highlighted that gas flows inside cylinder volume play a preeminent role when a relatively few nozzle holes are present (e.g. small DI diesel engines equipped with inline pump systems). In the case of high injection pressure and long injection duration (full load) or low gas densities (early injection) the spray may impinge on the wall, and the formation of a liquid wall film is possible. Liquid wall films usually have a negative influence on emissions, because the wall film evaporates slower and may only be partially burnt.
It has to be highlighted that the pollutant formation mechanisms are governed by intrinsically local sub-processes. Drawbacks can be induced by the improvement of some processes like fuel atomization, too; a very fine spray can induce the formation of lean combustion zones that burn at a relatively low temperature. In such conditions, the carbon monoxide formation could affect diesel processes as well. During transient operation of the engine (e.g. acceleration phase) the fuel-air ratio increases, caused by the delayed response of the turbocharger and the increased amount of injected fuel. Obviously, in order to fulfill future emission limitations, the use of exhaust gas after-treatment systems represents an effective methodology, especially for heavy vehicles. However, the reduction of engine raw emissions, by means of a proper control of the combustion process, still remains an attractive challenge.
2.3 Motivation
and
Methodologies
2.3.1 Numerical modeling of injection processes
On the basis of joined numerical models and experimental activities it is possible to achieve relevant improvements in the process of internal combustion engine optimization. Besides the uncertainties typical of the simulations, the advantages resulting from the modeling of the processes that take place within the engine are becoming crucial during the research and development phases. Simulation models, which have been carefully adjusted to a specific range of boundary conditions, can be used to perform extensive parametric studies, which are usually faster and cheaper than experiments. Despite the higher uncertainty compared to experiments, numerical simulation can give much more extensive information about the complex in-cylinder processes than experiments could ever provide. Using numerical simulations, it is possible to calculate the temporal behavior of every variable of interest at any place inside the computational domain. This allows getting a detailed knowledge of the relevant processes, and is a prerequisite in order to improve them. Furthermore, the numerical simulation can be used to investigate processes that take place at time and length scales or at places that are not accessible and thus cannot be investigated experimentally.
In the case of high-pressure diesel injection for example, the spray break-up near the nozzle is mainly influenced by the flow conditions inside the injection holes. However, because of the small hole diameters (less than 200 µm for passenger cars) and the high flow velocities (about 600 m/s and more), the three-dimensional turbulent and cavitating two-phase flow is not accessible by measurement techniques. One very
costly and time-consuming possibility of getting some insight into these processes is to manufacture a glass nozzle in real-size geometry and to use laser-optical measurement techniques. Outside the nozzle in the very dense spray measurements of the three-dimensional spray structure (droplet sizes, velocities etc.) become even more complicated, because the dense spray does not allow any sufficient optical access of the inner spray core. In these and other similar cases numerical simulations can give valuable information and can help to improve and optimize the processes of interest.
As it will be exposed in the next paragraphs, a crucial advantage of the process modeling is the possibility to describe the interactions and the interdependencies among the relevant processes.
The aim of the present work is to develop a comprehensive modeling approach having the capability of take the deep connection between fuel injection phenomena (e.g. injection strategy, fuel flows, jet atomization, evaporation and mixture formation) into account. For this scope, different computational tools, characterized by different roles, have been used and coupled, in order to take into account the interdependencies that characterize the relevant sub-processes. The following paragraphs illustrate the three main modeling approaches that have been outlined and then used in the analysis of several practical cases. In section II, several application cases have been considered and the contribution of the modeling approach has been presented evaluated.
2.3.2 Multi-step modeling (0D-3D CFD) for injection process and
spray simulation with a unitary approach
In fuel injection investigations, simulation tools are significantly supported by research and development activities. At present, injection system simulation tools and spray modeling singly achieve good results, as they have been successfully improved (Fig.2.1). On the other hand, by considering the whole injection process and its effects on engine performance, a unitary modeling approach is desirable. As pointed out in the precedent paragraphs, the flow condition inside the orifice is one of the factors that promote the spray to break up into droplets, as well the interaction between the spray and the ambient. Moreover, the flow characteristics are influenced by the injection pressure, and consequently its time variations. The injector geometry also plays a role. Interesting experimental and computational works have investigated the influence of injection strategies over engine performance, emissions and over the spray behavior. The modeling goal is to develop an integrated tool able to take the deep connection between fuel injection phenomena (injection strategy, jet atomization, evaporation and mixture formation) into account. For this scope, two computational codes, characterized by different roles, have been used.
A multi step simulation procedure has been outlined and used. In the former step, a phenomenological model is built to simulate the operation of the complete injection system; the attention spots on the system analysis and on the investigation of the effect of specific components and parameter settings on the system performance. In the second step, the latter computational tool, based on a 3D CFD environment, has been initialized by means of the results obtained from the injection system simulation and has been used to perform the 3D investigation of the internal nozzle flow. Such a simulation is aimed at evaluating the effect of physical fuel features on local flow characteristics and their influence on the system performances.
Figure 2.1: Use of simulation tools in diesel injection modeling
Since experiments can be difficult to manage for injection conditions (small-scaled, high-speed flow) a numerical simulation seems to be an appropriate tool to get an interesting model of the flow features inside and at the exit of the injector nozzle. In the third simulation step, the model and of the spray formation within the combustion chamber is performed.
Figure 2.2: Schematic of the multistep modeling approach
Aimed at achieving a realistic link between the nozzle flow results and the spray model, the data of the two phase flow calculation inside the nozzle are used as initial condition for an Euler/Lagrange spray calculation. Although there is no direct
step 1
step 2
Needle lift: Mesh Movement Pressure: Inlet Mesh Surface
Boundary Condition 0 .00 0 0 .10 0 0 .20 0 0 .30 0 0 .40 0 0 .50 0 0 0 .0 00 30 .0 0 0 6T im e [s]0 .0 0 0 90.0 0 1 2 Lift [m m ] 0 20 40 60 80 100 0 0.0003T ime [s]0.00060.00090.0012 Press ure [M Pa ] Nozzle Exit Turbulence Intensity Fuel-Vapor Mass Fraction Local Fuel Velocities TIME EVOLUTION OF:
“NOZZLE FILE” Spray modeling
step 3
coupling between the internal nozzle flow simulation and the spray calculation, nozzle data are used as boundary conditions for spray calculation. At the interface, the values of liquid velocities, densities and turbulence quantities are stored into a data file. For a transient calculation, an arbitrary number of data sets can be saved at different time steps. During the Lagrangian spray simulation, the initial values are linearly interpolated from the available data sets. This approach helps to obtains reliable initial conditions for injection velocity and initial spray angle and it offers the possibility of applying more detailed primary break-up models, since detailed information about turbulence quantities and cavitation bubbles at the nozzle exit are available (Fig.2.2).
2.3.3 Double step modeling (3D-0D) of fuel metering component
operation for inline pump injection systems
Small diesel engines are largely used in industry and agriculture. Reliability and cost effectiveness are often key features of such a kind of engines. In several applications, sophisticated electronic or electric devices (common in automotive field) cannot be used; furthermore, especially for the smaller units, battery lack is often necessary or recommended (e.g. manual start). If reliability is preferred to absolute performance, these engines are equipped with relatively simple auxiliary components. Nonetheless, the pollutant emission standards define limits that must be strictly satisfied. Therefore, simple engine layouts do not mean obsolete technology; on the contrary, accurate research and development activities are required to match reliability, cost effectiveness and emission standard accordance. As exhaust-gas after-treatment systems cannot be easily used (for the already described reason), the in-chamber pollutant formation control is pre-eminent. In such a frame of reference, fuel-air mixing process plays a major role and it is deeply influenced by the injection strategy. More in detail, the engine performance is widely influenced by the ensemble inline pump-delivery valve; as known, injected fuel amounts, fuel pressure level and process length are reciprocally related. Engine operation is controlled by the positioning of the helicoidal groove, whose rotation angle defines engine load, injection phase and pressure evolution.
The proposed investigation approach is based on a lumped/1D model of the injection system that is set in a double step simulating procedure. The main mechanical-hydraulic model uses the indications obtained by a 3D CFD characterization of the most influencing components. Indeed, the discharge coefficients needed by the lumped approach are evaluated by means of 3D numerical experiments, allowing for a detailed component characterization. The detailed evaluation of the flow through the fuel metering components makes also possible the evaluation of the fuel characteristics influence on the system operation (in terms of fuel rate time evolution and injected amount). Due to the interesting capability to draw useful indications about the injection system, the used modeling approach is very
helpful in advanced system design and development (Fig.2.3). The fine modeling of fuel delivery process is directly tied to the description accuracy of combustion processes; therefore, it represents a key factor during the engine optimization in the matter of performance and emission reduction. The present approach is implemented in the modeling procedure that is described in the next paragraph, as well.
Figure 2.3: Schematic of the double step modeling approach
2.3.4 Comprehensive multi-step lumped modeling of injection
system operation, spray formation and fuel vaporization
Accurate research and development activities are required to match reliability, cost effectiveness and emission standard accordance, which defines limits for the considered engine category. Due to the interesting capability to draw useful indications about the injection system operation, an appropriate modeling approach is helpful in advanced system design and development. The fine modeling of fuel delivery process and the consequent evolution in terms of spray formation is directly tied to the description accuracy of engine performances; therefore, it represents a key factor during the engine optimization in the matter of performance and emission reduction. With a comprehensive simulation strategy, an injection system numerical model is set-up. The modeling approach is based on the mechanical-hydraulic representation of the system; such a main model is worked up in order to build in two additional modules. The modules permit the evaluation of the fuel jet characteristics and the subsequent evaporation process. Therefore, the complete model is totally
3D CFD flow study to simulate the behavior of pump fuel passages and delivery valve
discharge coefficients are evaluated through 3-D simulation and used to build a complete lumped/1D model of injection system
composed of three sequential main modules. Each module is based on a zero/one-dimensional approach, which is computationally not expensive. Indeed, it allows to easily execute time-efficient calculations or pre-calculations, parametric studies and system operation preliminary adjustment. Concerning the first computation module, a fully mechanical injection system is considered. The lumped model is used with a predictive approach to compute needle lift and fuel flow rate time traces.
The second simulation module is devoted to the fuel spray characteristics evaluation, in terms of jet penetration, spray cone angle and droplet atomization. Such a computation step is based on the use of empirical correlations and it is coupled to the first simulation module, in order to evaluate the time evolution of jet penetration, Sauter mean diameter and cone angle during the injection shot.
In a further step, the third one, the vaporization process is simulated. The model takes into account the effect of the droplet heating before the evaporation and it is implemented according to two different approaches, in order to evaluate the role of the droplet thermal conductibility on the vaporization rate. In principle, the coupling between such a computation step and the previous one is based on the values of the Sauter mean diameter, which is considered to be representative of the simulated atomization behavior.
The three modules of the model allow for the integrated simulation of the multiple and complementary aspects of the injection process, so that it is possible to infer an effective picture of the injection system behavior, taking into account the role of each sub-phase and the links among them. In addition, the use of such a model is extended to the influence evaluation of different types of fuel on the injection process.
Finally, moving from the single component fuel, the third simulation module is adjusted in order to model the evaporation behavior of mixtures, in which usually high boiling point components are blended with low boiling point species. Binary mixtures are modeled; the time evolution of the specie concentration (both for vapor and liquid states) is computed and the differences in vaporization rate are highlighted. Finally, the integration of the injection-vaporization model with a single-zone combustion model is tested, allowing for the evaluation of fuel influence on engine performance.
2.4 Applications
Overview. On the basis of the modeling approaches that are described in
section 2.3, the roles of several factors influencing the injection process are investigated. The next paragraphs give a description of the application cases.
Two different injection system types are considered in the applications; they are inline pump and common rail systems. Indeed, the adopted simulating approaches can be adopted in each case, independently from the particular system, device or fuel type. The contribution of each simulation step is investigated and highlighted, pointing out the modeling approach capability in the evaluation of the relevant phenomena. A preliminary investigation phase has been devoted to the choice of the simulation tools and environments to be used for the model building. To model the in-cylinder flows and the 3D transient nozzle flow, the commercial FIRE code has been selected and used. The mechanical-hydraulic modeling of the various injection systems has been based on the 0-1D code AMESim. Moreover, the lumped modeling of evaporation processes in cylinder ambient is self FORTRAN implemented in order to achieve an effective computational module that can be easily integrated in a comprehensive simulating environment.
2.4.1 Development of a three-step cascade modeling procedure for sequential simulation of inline-pump injection system operation, nozzle flow features and in-cylinder spray formation
The application deals with a numerical investigation of a single cylinder diesel engine equipped with mechanical fuel direct injection system and focuses on the fuel injection system modeling with the aim of predicting the performance of the entire injection system, the spray characteristics, the interaction among spray-cones, combustion chamber flows and geometry. In the simulations, two different codes have been used. With the former one, AMESim code, the complete injection system has been analyzed and the single components have been selected and modeled. The
results obtained from the injection system simulation, in terms of injection needle lift, injection flow rate, pressure time evolution, have been used to initialize the latter computation tool, FIRE code, in which 3D flow numerical investigation of the internal injector flow has been performed. Since such a flow is directly linked to the spray modeling, the primary break-up effects have been taken into account. The details of the adopted modeling strategy have been shown and the results of each simulation step have been presented. In order to highlight the relationship among the nozzle flow condition and the spray formation-vaporization characteristics, a comparison between two different calculation setups has been shown.
2.4.2 Application of the cascade modeling procedure evaluating fuel influence on common rail system performances
A model for the analysis of diesel engine common rail injection system has been developed and the influence that different fuels have on the injection performances has been investigated. Diesel fuel, biodiesel and kerosene have been used and the differences of injection flow rate, injection pressure time trace, nozzle flow features and break up mechanism have been highlighted. The coupling of two different codes has been used in the simulations: the former one, AMESim code, has been adopted to model the common rail system and to investigate the fuel flow rate and the injection pressure dependence on the fuel type. The latter computational tool, FIRE code, has been initialized by means of the results obtained from the injection system simulation and has been used to perform the 3D investigation of the internal nozzle flow and of the spray formation phenomena, aimed at evaluating the effect of physical fuel features on local flow characteristics and their influence on the system performances. Details of the adopted modeling strategy are described and results of each simulation step are presented.
2.4.3 Comprehensive modeling of injection: the introduction of the fuel in the combustion chamber as result of the correct integration of component roles
A multi-step modeling procedure is presented with the aim of analyzing the complete fuel injection system, the spray characteristics, the combustion chamber flows. Such a modeling procedure is based on an integrated use of two different computation codes (0D-1D and 3D), each one developed and well suited for a specific task: the investigation of overall injection system performance, phenomena connected to the internal injector flow, spray formation and in-cylinder flows. By means of a 0D-1D code, the complete injection system is realized, providing the relevant indications about the injection process. The investigation deepens into the nozzle flow condition in
the second step of the procedure, where the results coming from the injection system model (flow rate, pressure and needle lift time traces) are used to initialize a 3D calculation, with the objective of evaluating the influence of the injector features (e.g. hole geometry, asymmetries and needle eccentricity) on the development of two phase cavitating flows. In the last computation step, the 3D CFD modeling of the phenomena that take place in the combustion chamber (spray formation) is performed. Results and details of each computation steps are presented in order to illustrate the modeling approach and its capabilities.
2.4.4 Evaluation of injector dynamic and nozzle flow features in multiple injection strategies. Modeling capabilities of the multi step unitary approach
This application deals with the integrated modeling of a multiple injection common rail system. The aim of the numerical investigation is to capture the behavior of the multiple injections, in terms of electro-injector dynamic and nozzle flow development. In detail, the multiple injection investigation focuses on the transient phenomena of the injector, in order to evaluate their role on the definition of two aspects of the injection strategy, the fuel rate time evolution and their influence on the nozzle flow features. In the simulations, a 0/1-D code has been used to analyze the complete injection system. The results obtained from the injection system simulation, in terms of injection needle lift, injection flow rate, pressure time evolution, have been used as boundary conditions for the 3-D CFD computation tool, in which the numerical investigation of the internal injector flow has been performed.
2.4.5 Contribution of sequential modeling approach investigating dynamic features of injectors
The research and development activities on diesel injection systems have focused some key-factors that improve the solenoid actuated injector performance, especially in the frame of the multi-event injection strategies. This application deals with a sequential 0D-3D numerical investigation in order to highlight the nozzle flow features of different injector layouts. A comparison between a last generation standard injector and an optimized unit characterized by an improved dynamics, different number of holes and reduced maximum lift is performed. By means of transient numerical simulations, the behavior of the fuel flows, the tendency to cavitation development and the response to the deviation from the standard operating conditions (highlighted by introducing a radial perturbation on the lift motion) are investigated.
2.4.6 Two step 3D-0D modeling of inline pump systems. The CFD contribution for detailed parameter lumping
The attention is focused on relatively small diesel units, equipped with fully mechanical injection systems; in detail, the considered system layout is based on the use of spring injectors; the amount of delivered fuel is controlled by the positioning of the pump plunger groove. The application highlights the role of the inline pump and the influence of fuel characteristics on the system operation. A two step modeling approach is outlined: by means of a three-dimensional numerical flow study, the behavior of pump fuel passages and delivery valve is simulated. Then, on the basis of the system features, a complete lumped/one-dimensional numerical model is realized, in which the discharge coefficients evaluated through the three-dimensional simulation are employed. Fuel injection rate and local pressure time histories are investigated, paying specific attention to the occurrence of the relevant phenomena in the system components.
2.4.7 Multi step lumped modeling of injection process. Development of a comprehensive injection process model for low computational effort investigations
The work aims at developing and setting up a model able to predict the diesel spray evolution to be integrated into a complete thermodynamic engine model. Previous application has been devoted to realize a numerical model for the injection system, in which a lumped parameter + one-dimensional approach is employed. Such a model has then enhanced by introducing a quasi-dimensional model for fuel break up, diffusion and penetration processes. Moreover a self-developed heating sub-model is included in the sub-model, which enables the evaluation of the influence of the fuel properties on the evaporation process. As a result, the injection system simulation model gives indications on the spray formation process and it is used into a lumped parameter model of the combustion process. Results concerning the influence of fuel properties on the evaporation process are presented and discussed, pointing out its effect on engine performance.
3. Coupling Codes For a Multi-step Modeling
Approach of Diesel Injection System
3.1 Introduction. Although simulation tools can be viewed as standard things today, the predictive quality of the sub-models is constantly supported and enhanced by research and development activities [1,2]. At present, injection system simulation and spray modelling singly achieve good results, due to the more and more accurate and modeling of the relevant processes [3]. On the other hand, by considering the whole injection process and its effects on engine performance, a unitary approach is desirable [4]. It is well known that the flow condition inside the orifice is one of the factors that promote the spray to break up into droplets, as well the interaction between the spray and its ambient. Moreover, the flow characteristics are influenced by the injection pressure, and consequently its time variations. The injector geometry also plays a role [5]. Interesting experimental and computational works have investigated the influence of injection strategies over engine performance, emissions and over the spray behaviour [6-8]. The aim of this section is to show the development of an integrated tool able to take into account the deep connection between fuel injection phenomena (injection strategy, jet atomisation, evaporation and mixture formation). For this scope, two computational codes, characterized by different roles, have been used. AMESim software [9], as a phenomenological environment, is based on zero/one-dimensional code; in the modelling of the complete injection system, the attention spots on the system analysis and on the investigation of the effect of specific components and parameter settings on the system performance. Since experiments can be difficult to manage for injection conditions (small-scaled, high-speed flow) [10], a numerical simulation seems to be an appropriate tool to get an interesting model of the flow features inside and at the exit of the injector nozzle. The knowledge of the injector mass flow rate and the flow conditions at the nozzle exit is considered to be a key issue for a successful simulation of all the subsequent processes of mixture formation, and eventually combustion and pollutant formation. In order to take the impact of geometrical details on the highly transient nature of the cavitating injector flow into account, a comprehensive multidimensional two-phase flow model, available in the FIRE environment [11], has been used. Aimed at achieving a realistic link between the nozzle flow results and the spray model, the so-called ‘nozzle interface’ has been adopted [12]. The idea behind the ‘nozzle interface’ is to use the data of a two phase flow calculation inside the nozzle as an initial condition for an Euler/Lagrange spray calculation. Although there is no direct coupling between the internal nozzle flow simulation and the spray calculation, nozzle data have been used as boundary conditions for FIRE spray calculation. At the interface, the values of liquid velocities, densities and turbulence quantities are stored into a data file. For a
transient calculation, an arbitrary number of data sets can be saved at different time steps. During the Lagrangian spray simulation, the initial values are linearly interpolated from the available data sets. This method retains two advantages:
-it delivers reliable initial conditions for injection velocity and initial spray angle; -it offers the possibility of applying more detailed primary break-up models, since detailed information about turbulence quantities and cavitation bubbles at the nozzle exit are available.
Results of each modelling step are presented in terms of injection laws, nozzle flow results and spray droplet visualisation, in order to describe and clarify the adopted procedure; results based on a different break-up setting are presented, in order to explore its influence on the solution.
3.2 Injection system. The injection system modelling has been performed in AMESim environment. It is made of a cam-driven reciprocating pump, a delivery valve, an high-pressure duct, a fully mechanical injector (Fig.3.1).
Figure 3.1: Injection system
The fuel is delivered to the injector as soon as the fuel pressure reaches a predefined value. The delivery valve closes as the pressure decreases. This represents an already well-studied system and it doesn’t need a detailed description, but it must be noted that the same modelling strategy can be adopted if an high pressure common rail system is considered. In the present case, a simple system has been chosen, since this work focuses on the modelling approach.
3.3 Nozzle flow modelling. In order to evaluate the role of the cavitation, FIRE Multiphase Flow Module [12] has been used. The adopted multiphase simulation is based on the Euler-Euler Approach, that is the most general approach to simulate multiphase flows. The Multifluid Model (it is one of the default models available in Fire environment) has been adopted. In such a model, all conservation equations are
solved for each phase; in particular, in the modelling of closure terms in the turbulence kinetic energy equation, the following assumptions are made [13]:
-the interfacial interaction between the two phases is neglected;
-the turbulence level of the dispersed phase is assumed to be equal to the continuous phase turbulence level.
The modelling of the mass transfer between the fluid phases is based on the Linear Cavitation Model, available in the Fire library. The relation for the mass exchange is:
d . 2 c=ρN'''4R R=−Γ
Γ (1)
where N′′′ is bubble number density and R is bubble radius. The time derivative of the bubble radius is estimated from the Rayleigh equation:
c 2 . .. p R 2 3 R R ρ Δ = + (2)
By linearizing the above equation neglecting the inertial term, the mass exchange can be derived to be equal to:
( )
2 d 1 d 3 2 3 1 ''' c d CR c C1 sign p3.85 N α Δp =−Γ ρ ρ Δ = Γ (3)where the effective pressure difference equals:
⎟ ⎠ ⎞ ⎜ ⎝ ⎛ − ρ − = Δ sat E ckc 3 2 C p p p (4)
The effective pressure difference, ∆p, includes the effects of pressure fluctuations. The closure coefficient–Egler coefficient, CE, depends on local turbulence level [14]. CCR is the condensation reduction factor; in the present case, the following values have been adopted: CR=1; CE=1.2. Bubble number density, N′′′, is calculated according to the assumed diminishing linear ramp:
(
)(
)
⎩ ⎨ ⎧ + α − − = 1 1 1 '' ' N 2 '' ' N '' ' N d 0 0 5 . 0 5 . 0 d d > α ≤ α (5)The (5) is a heuristic formula, used to model coalescence effects. The initial bubble number density, N0′′′, depends on the characteristics of the liquid phase [15]: in the present case, the value N0′′′ =1012 is used. The number density should not be smaller than the one constrained by the maximum bubble diameter:
⎟ ⎟ ⎠ ⎞ ⎜ ⎜ ⎝ ⎛ π α = max , b 3 d D 6 ,' '' N max '' ' N (6)
The maximum bubble diameter, Db,max, is a function of the geometry. This value is chosen so that it practically does not affect the calculation of the number density, N′′′. The used value for the maximum bubble diameter is equal to 0.01 m. The bubble diameter is uniquely defined if volume fraction, αd, and the number density, N′′′, are known: 3 1 d b 6N''' D ⎟ ⎠ ⎞ ⎜ ⎝ ⎛ π α = (7)
The implemented interfacial momentum source includes drag and turbulent dispersion forces: d d c c TD r r '' i c D c C 81 A C k M M = ρ v v + ρ ∇α =− (8)
where the relative velocity is defined as:
c d
r v v
v = − (9)
The interfacial area density for bubbly flow equals:
3 2 d 3 1 2 b '' i D N''' (36 ) A =π = π α (10)
Number density, N′′′, is obtained from the cavitation mass exchange model. Drag coefficient, CD , is a function of the bubble Reynolds number, Reb, defined as:
c b r b vvD
Re = (11)
The correlation for drag coefficient for bubbles is used [16]:
⎪ ⎩ ⎪ ⎨ ⎧ + = 438 . 0 ) Re 10 . 0 1 ( Re 192 C 75 . 0 b b D 1000 Re 1000 Re b b > ≤ (12)
Turbulent dispersion force accounts for the vapour diffusion due to turbulent mixing processes. The margins for bubbly flows are: CTD= 0.05÷0.5. In this case CTD=0.1.
The nozzle flow simulation is based on the injector calculation grid. Figure 3.2 shows the injector mesh. It’s made of 92630 cells.
Figure 3.2: Injector mesh
The sac and the body parts are based on a structured grid. The nozzle surface has been separately meshed and then connected to the sac volume. The whole injector mesh represents an angular portion of the complete volume. A polar flow symmetry has been supposed. The fuel considered in the work is a typical European diesel fuel with 86% of carbon content and 13% of hydrogen content. In order to simulate the
needle lift, a mesh set generation is required. The needle displacement is imposed to the meshes by an external law (Fig.3.5), that has been obtained as a data file coming from the injection system simulation. In order to investigate the nozzle flow, an injection pressure law must be imposed to the inlet surface of the injector mesh. Such a law (Fig.3.6), as the needle lift one, comes from the injection system simulation. In this way, the coupling between AMESim code and FIRE code is realized.
3.4 Spray and chamber flow simulation. Spray simulation involves two-phase flow phenomena, then it requires the numerical solution of conservation equations for the gas and the liquid phase simultaneously. With respect to the liquid phase, the spray calculation is based on a statistical method referred to the Discrete Droplet Method (DDM). All the adopted following models are default models in FIRE [13]. The k-ε closure for a RANS solution has been adopted.
Breakup model. Wave model has been used to simulate the droplet break-up process. According to such a model [17-19], the growth of an initial perturbation on a liquid surface is linked to its wavelength and to other physical and dynamic parameters of the injected fuel and the fluid domain.
Turbulent dispersion model. O’Rourke [20] model has been adopted. As particles pass through the flow, it is assumed that they interact with the individual turbulent eddies. Each interaction deflects the particle as dictated by the instantaneous velocity of the turbulent eddy and the particle inertia. The particle trajectory is determined similar to a random walk computation until the particle passes out of the region under consideration. The instantaneous gas velocity within a turbulent eddy is obtained from the mean domain fluid velocity and the turbulence kinetic energy. Both are known from the solution of the gas phase equations. The interaction time of a particle with the individual eddies is estimated from two criteria, the turbulent eddy life time and the time required for a particle to cross the eddy.
Particle interaction model. With the viewpoint of the statistical particle method [21] which builds the basis of the current spray simulation module, the particle collisions are modelled by a statistical rather than a deterministic approach [22]. The probability distribution governing the number and nature of the collisions between particles is sampled statistically. The collision calculation is performed for pairs of particles only if they are in the same computational cell. It is assumed that the particles associated with each parcel are uniformly distributed within the sampling volume (computational cell) in which they are located. The particles, on the basis of their behaviour, can be divided in collectors and droplets. The collision frequency between a particle of parcel 1 and all particles associated with another parcel, within the computational volume, is used to calculate the probability that a particle of parcel 1 will collide with a particle of the other parcel (pairs).
Wall interaction model. Wall interaction of liquid droplets can play a major role for diesel and gasoline engines. Especially for small bore diesel engines, the distance between the injector and the bowl can be very small, so that large parts of the fuel are not yet evaporated or atomized when they hit the wall. Walljet2 is the adopted model,
and it is based on the spray/wall impingement model of Naber and Reitz [23]. Depending on the engine run condition, a vapour cushion is formed under the droplets and they rebound or slide along the walls. In the currently implemented model, it is assumed that a droplet which hits the wall suffers one of the two consequences, namely rebound or reflection in the manner of a liquid jet, depending on the Weber number. The transition criterion between these two regimes is described by a critical Weber number (Wec=80):
- low Weber number regime (We < Wec) (rebound); - high Weber number regime (We > Wec) (jet regime).
The droplet diameter after the impingement d1 depends on d0 and on the following Weber number criteria (Fig.3.3):
We ≤ 50 d1=d0
50< We ≤ 300 d1=d0 [1-( We⊥in-50)/500] We>300 d1=0.5d0
Figure 3.3: Impinging parcel
Evaporation model. The heat and mass transfer processes are described by the model originally derived by Dukowicz [24] and based on the following assumptions:
- spherical symmetry;
- quasi steady gas-film around the droplet;
- uniform droplet temperature along the drop diameter; - uniform physical properties of the surrounding fluid; - liquid–vapour thermal equilibrium on the droplet surface.
In such evaporation model, it is considered that the droplet is evaporating in an incondensable gas.
Primary break-up: Diesel Blob Injection Primary Break-up Model plus Nozzle Flow Rresults. To set up the primary fuel jet disintegration within the framework of the DDM, the following method has been used: introduction of a series of large blobs of approximately nozzle diameter, which close to the nozzle represent the coherent liquid jet. Their diameter is subsequently reduced according to the mass detachment rate
calculated from the primary break-up model. The primary atomisation model is based on the simulation of the competing effects of turbulence, cavitation and aerodynamic induced break-up processes. The WAVE model is used to determine the aerodynamic break-up rate. Model constants C1 and C2 are used to adjust break-up time and characteristic droplet radius. In the model, the spray angle is calculated immediately from atomization physics. The turbulence induced break-up is accounted for by solving an additional equation for the turbulence kinetic energy and its dissipation rate within the liquid fuel core. The impact of the collapsing cavitation bubbles on the primary break-up is modelled via additional source terms in the turbulence model. The turbulence and cavitation induced break-up competes with the aerodynamic one until, at a certain distance downstream of the nozzle exit, the aerodynamic break-up processes become dominant. The boundary conditions required for the primary break-up spray simulation are obtained from the results of the two-phase nozzle flow calculation. For the individual injector configurations and operating conditions, the nozzle flow results provide the relevant information on the local fuel velocity, turbulence intensity and fuel vapour mass fraction at the nozzle exit. The aim is to capture the highly transient nature of the cavitating nozzle flow characteristics. To cover the locally resolved flow data in the nozzle orifice, the ligament release positions are randomly chosen within the orifice cross section at each time step. The numerical implementation of the primary break-up model adopts an Eulerian-Lagrangian two-phase flow method which is based on the basic concept of transporting particle pdf’s representing the statistics of the ligaments formed in the primary break-up region. Close to the nozzle exit, the ligament properties and interaction processes are modelled in order to account for dense spray effects and according to the above primary break-up model, in the far field of the nozzle the two-phase flow method reduces to the well known discrete droplet approach (DDM). Transition from ligaments to droplets occurs according to Weber number and diameter criteria.
Figure 3.4: Engine mesh
The simulation has been performed on a relatively complex computational grid, representing a diesel engine combustion chamber. It allows to simulate the complete engine cycle, taking into account the intake/exhaust manifold effects on the chamber flows. The flow calculation begins at 135 CABTDC and ends at 117
CAATDC, in order to consider the whole flow field evolution during the compression-expansion phase. In this way it is possible to evaluate the role of the piston bowl and its interaction with the spray cloud.
3.5 Results. The simulation has been performed on a single cylinder diesel engine whose main features are listed in Tab.3.1:
displacement [m3] 401.3*10-6 bore x stroke [m] 0.082 x 0.076
compression ratio 20.3:1
fuel injection system direct injection injector nozzle diameter [m] 0.159*10-3
injector nozzle length [m] 0.72*10-3
sac diameter 0.495*10-03
sac volume [m3] 1.589*10-10
number of holes 5
Table 3.1: Main characteristics of the diesel engine The simulations refer to the following conditions:
engine speed [Hz] 50
Start of injection CABTDC 6 injected mass [MPa] 1.78*10-05
Table 3.2: Simulation conditions
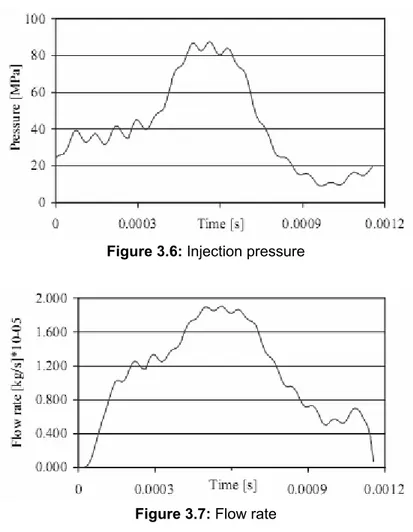
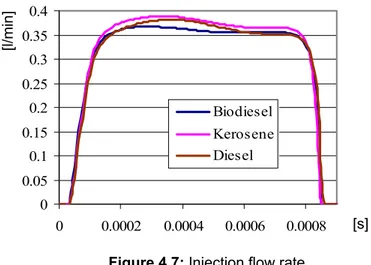
3.5.1 Injection characteristics. The following figures show the needle lift trace (Fig.3.5, maximum value 0.425 mm), the injection pressure trend (Fig.3.6) and the injection flow rate curve (Fig.3.7) respectively. The total injected mass has been computed and has been used to verify the nozzle flow results, in terms of fuel flow rate time integral at the nozzle exit.
Figure 3.6: Injection pressure
Figure 3.7: Flow rate
3.5.2 Injector flow. The flow visualization is displayed by means of a cut surface containing the nozzle axis. The earlier state of the injection condition is shown in the following figure. The needle lift and the injection pressure values are 0.05 mm and 33.9 MPa respectively. At 0.1 ms after SOI a vapour region grows from the inlet corner of the hole and extends downstream without involving significantly the nozzle exit (Fig.3.8, Left); the vapour/liquid volume fraction does not exceed the limit of 0.6 in the core, as the isocontour lines highlight.
Figure 3.8: Left, Vapour/liquid volume fraction – 0.1 ms ASOI Right, Injector flow velocity isolines - 0.1 ms ASOI
The flow velocity values in the region of liquid are in the range of 80÷120 m/s. The vapour region causes a restriction of the normal duct section whose entity increases from the inlet section to the exit. The injector flow 3D streamlines (Fig.3.9) reveal the presence of an helicoidal flow motion in the vapour zone; moreover a large eddy zone is generated in the injector sac.
Figure 3.9: 3D injector flow streamlines - 0.1 ms ASOI
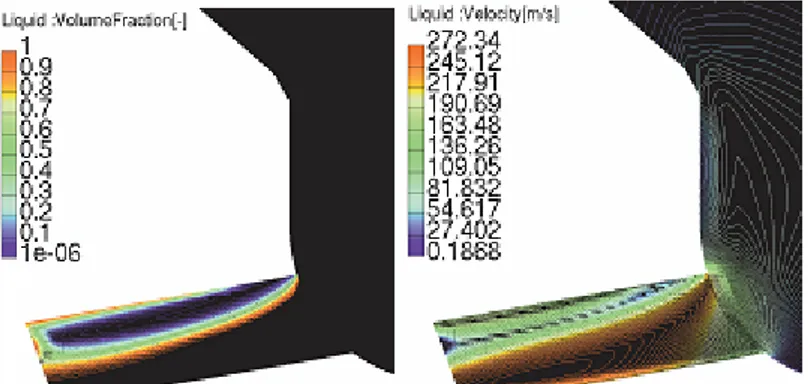
Figure 3.10 refers to 0.375 ms ASOI. The needle is at the maximum of the lift and the pressure level is equal to 41.7 MPa. The vapour/liquid fraction is significantly decreased (equal to the minimum in the core cavitating region) and the cavitating zone is characterized by an evident contour (Fig.3.10, Left). The vapour region increases to reach the nozzle exit. The flow velocity is increased and the values are in the range of 300 m/s. The flow in the sac presents an increment, too: the velocity is in the range of 70÷100 m/s (Fig.3.10, Right). In the 3D visualisation of the streamlines (Fig.3.11), the helicoidal structures are emphasized and characterize the flow in the vapour region; on the other hand, in the sac volume, the streamlines are back straight.
Figure 3.10: Left, Vapour/liquid volume fraction – 0.315 ms ASOI Right, Injector flow velocity isolines - 0.315 ms ASOI
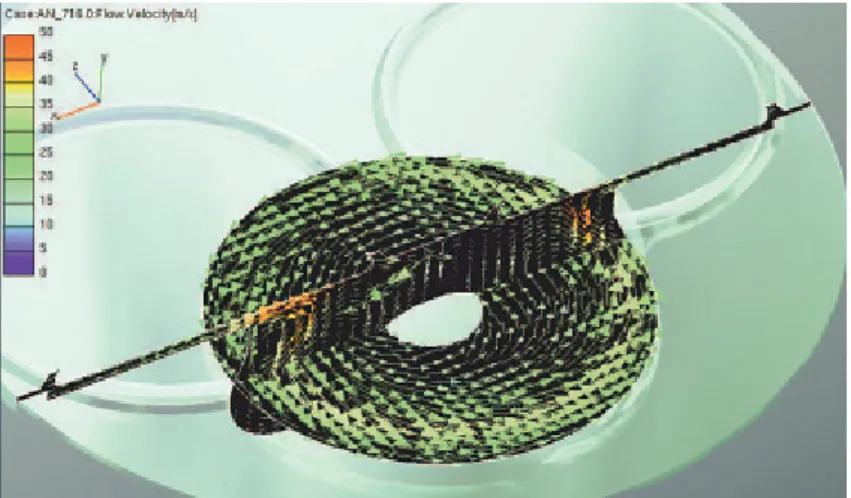
Figure 3.11: 3D injector flow streamlines - 0.315 ms ASOI
At 0.575 ms ASOI, the vapour region is still relevant (Fig.3.12, Left), but at the exit section of the nozzle, the vapour/liquid volume fraction reaches lower values compared to the previous visualisation; in particular, a decrement of about 40% is obtained. The isolines map (Fig.3.12, Right) shows a decrement of values (approximately 15% of reduction).
Figure 3.12: Left, Vapour/liquid volume fraction – 0.575 ms ASOI Right, Injector flow velocity isolines - 0.575 ms ASOI
Different flow conditions characterize the subsequent injection phase: the visualization in correspondence to 0.865 ms ASOI (Fig.3.13, Left – needle lift 0.425 mm, injection pressure 19.4 MPa) shows that the vapour region completely collapses before the nozzle exit. The gradient of vapour/liquid fraction towards the nozzle wall is decreased respect to the previous case, as the result points out. The velocity in the liquid flow region (Fig.3.13, Right) is in the range of 180÷220 m/s.
Figure 3.13: Left, Vapour/liquid volume fraction – 0.865 ms ASOI Right, Injector flow velocity isolines – 0.865 ms ASOI
Figure 3.14: 3D injector flow streamlines – 0.865 ms ASOI
The streamlines still show the highlighted helicoidal shape, but they converge in a restricted region in correspondence to the zone in which the vapour bubbles collapse takes place (Fig.3.14). The end of the injection is characterized by the detachment of the cavitating region from the corner of the hole. A vapour bubble is conveyed downstream and another one is involved in a sac eddy (Fig.3.15).
Figure 3.15: Left, Vapour/liquid volume fraction – EOI Right, 3D injector flow streamlines – EOI
The flow features highlighted in this section are in agreement with the experimental investigations concerning cavitation inception and its development [25]:
- the hole inlet flow around the side corners of an injection hole is a possible mechanism of cavitation;
- the cavitation flow patterns exhibit a more stable structure with increasing needle lift;
- in the lower nozzle tip volume, no appreciable liquid movement is identified;
Figure 3.16 refers to a developed flow through a mini sac type nozzle showing cavitation [25].
3.5.3 Chamber flow/spray. The flow visualisation is displayed by means of two cut surfaces, in order to evaluate the swirl and the squish effects. A well structured swirl motion structure is present in the bowl, generated by the intake manifold. A squish effect is visible: there is no symmetry because of the bowl offset respect to the cylinder axis. At 4 CABTDC (fig.3.17), the swirl motion and a squish eddy are evident in the bowl. The presence of the injection jet is shown by the velocity field.
Figure 3.17: Bowl velocity field – 4 CABTDC
Figure 3.18: Spray droplet diameter- Diesel mass fraction isosurface (0.001) – 4 CABTDC
Figure 3.18 gives an idea of the vaporisation process; the spray cones are visualized at the beginning of injection. An isosurface representing the fuel/air ratio of 0.001 is depicted and it is located around the spray jet. At TDC (Fig.3.19, Left) the jet is represented after 0.33 ms after SOI. The spray droplets interact with the bowl flow field. The droplet having little diameter are conveyed by the swirl stream and there is no wall impingement.
Figure 3.19: Left, Spray result at TDC Right, Minisac six-hole developed spray [26]
The spray cone angle is approximately in the range of 20÷25 degree. This characteristic can be qualitatively compared to an experimental spray cones visualization of minisac multi-hole nozzles (Fig.3.19, Right) [26] and a good degree of agreement can be observed. The result refers to a minisac six-hole nozzle, 0.124*10-03 m hole diameter, 80*10+06 Pa injection pressure, 2.7*10+06 Pa ambient pressure. At 6 CAATDC, the effect of the spray cones on the swirl stream is increased. Five sub-streams indicate the droplets-chamber flow interaction: the mixing process involves the whole chamber (Fig.3.20).
Figure 3.21: Spray droplet diameter - Diesel mass fraction isosurface (0.001) – 6 CAATDC
The fuel/air mass fraction (0.001) of Fig.3.21 is located at a large distance from the spray cones, as the mixture building is going on. At this crank angle, the first half of the injected mass is evaporated (Fig.3.21). At 12 CAATDC, the flow velocity field show that the mixture is outgoing from the bowl (Fig.3.22).
Figure 3.22: Bowl velocity field – 12 CAATDC
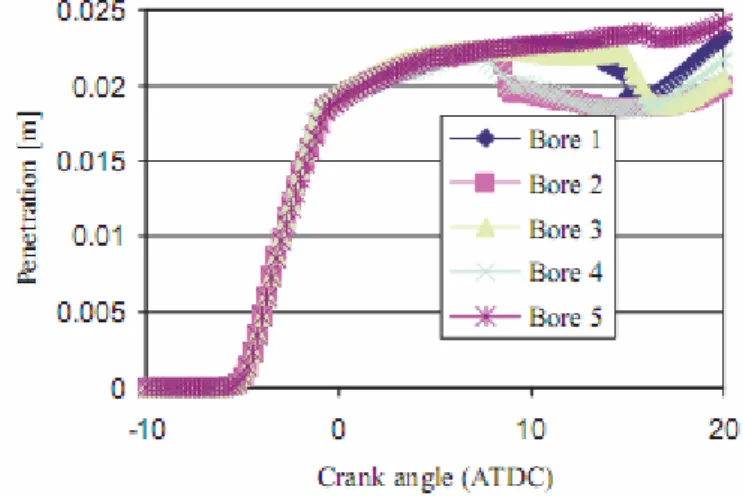
In order to evaluate the influence of the ‘nozzle interface’ on the spray break-up, a second calculation run has been performed. In such a run (case 2), the ‘nozzle interface’ has been disabled: it means that the results of the nozzle flow simulation have been neglected and the fuel injection has been modelled directly on the basis of the fuel flow rate law (Fig.3.7). In case 2, a different evaporation rate has been observed. Differences in the spray penetration, spray cone angle, droplet diameter,
mixture building and wall impingement have been highlighted by the comparison between Figs.3.23, 3.24. In the second case, the spray cone angle is almost completely undeveloped. These qualitative differences can be quantitatively evaluated in Fig.3.25, in which the evaporated fuel mass is depicted. In case 2, the droplet vaporisation shows a delay of about 3 CA. Then the vaporisation rate becomes faster, but at 20 CAATDC the amount of evaporated fuel is the 94% of the total. Figures 3.26 and 3.27 represent the hole to hole penetration curves. The differences between the curves could be caused by the chamber flow field characteristics and by the mesh grid influence [27]. The spray cone penetration has quantitatively a different behaviour; a relevant increment, of about 25% at 10 CAATDC, is shown in the second simulation. On the other hand, penetration curves coming from case 1 (Fig.3.26) have an evident slope change in the initial phase of injection, corresponding to a penetration depth of 0.01 m. In correspondence to this point, the SMD curve (Fig.3.29) of case 1 presents a relevant slope change, too. About the SMD curves of both simulations, the values at the beginning of the injection are significantly different (20%). This feature reflects the different vaporisation behaviour between the two solutions. A shape agreement between the obtained results and the experimental measurements of spray cone investigations [28] has been obtained (Fig.3.28).
Figure 3.23: Spray droplet diameter- Diesel mass fraction isosurface (0.0065) – TDC Measurements are referred to a hydraulic electronic unit injector, with pressure of 77*10+06 Pa, duration of 2.25*10-03 s, nozzle hole diameter 0.190*10-03 m. The spray penetration results from case 1 seem to be closer to the measured data, because of the discussed slope change. Figure 3.28 indicates that the ambient pressure affects the spray penetration significantly.

![Figure 4.9: Scalar velocity [m/s], 0.2 ms ASOI; a, kerosene; b, diesel; c, biodiesel](https://thumb-eu.123doks.com/thumbv2/123dokorg/2846205.5631/53.892.56.588.104.300/figure-scalar-velocity-ms-asoi-kerosene-diesel-biodiesel.webp)

![Figure 4.18: Evaporated and remaining fuel volume [l]](https://thumb-eu.123doks.com/thumbv2/123dokorg/2846205.5631/56.892.309.711.474.807/figure-evaporated-remaining-fuel-volume-l.webp)
