! ! ! ! ! ! !
UNIVERSITÀ!DEGLI!STUDI!DI!SASSARI!
!
SCUOLA!DI!DOTTORATO!DI!RICERCA!
Scienze!e!Biotecnologie!
dei!Sistemi!Agrari!e!Forestali!
e!delle!Produzioni!Alimentari!
!
Indirizzo(Produttività(delle(Piante(Coltivate((
(
Ciclo(XXVII
(
(
Anno(accademico(2013;2014(
(
(
(
(
(
(
(
(
Characterization of a wide collection of tomato (Solanum
lycopersicum L.) for morpho-phenological, quality and resistance
traits
(
(
(
dr.(Alessandro(Scintu(
(
(
(
(
(
(
(
(
(
(
(
(
Direttore'della'Scuola(
prof.(Alba(Pusino(
Referente'di'Indirizzo(
prof.(Rosella(Motzo(
Docente'Guida(
prof.(Giovanna(Attene(
Tutor'
dr.(Monica(Rodriguez(
Co6tutor'
dr.(Domenico(Rau(
(
(
! ! ! ! ! ! !
UNIVERSITÀ!DEGLI!STUDI!DI!SASSARI!
!
SCUOLA!DI!DOTTORATO!DI!RICERCA!
Scienze!e!Biotecnologie!
dei!Sistemi!Agrari!e!Forestali!
e!delle!Produzioni!Alimentari!
!
Indirizzo(Produttività(delle(Piante(Coltivate(
(
Ciclo(XXVII
(
(
(
(
(
La(presente(tesi(è(stata(prodotta(durante(la(frequenza(del(corso(di(dottorato(in(“Scienze(e(
Biotecnologie( dei( Sistemi( Agrari( e( Forestali( e( delle( Produzioni( Alimentari”( dell’Università(
degli(Studi(di(Sassari,(a.a.(2013/2014(M(XXVII(ciclo,(con(il(supporto(di(una(borsa(di(studio(
finanziata( con( le( risorse( del( P.O.R.( SARDEGNA( F.S.E.( 2007M2013( M( Obiettivo( competitività(
regionale(e(occupazione,(Asse(IV(Capitale(umano,(Linea(di(Attività(l.3.1(“Finanziamento(di(
corsi(di(dottorato(finalizzati(alla(formazione(di(capitale(umano(altamente(specializzato,(in(
particolare(per(i(settori(dell’ICT,(delle(nanotecnologie(e(delle(biotecnologie,(dell'energia(e(
dello(sviluppo(sostenibile,(dell'agroalimentare(e(dei(materiali(tradizionali”.(
(
(
Alessandro(Scintu(gratefully(acknowledges(Sardinia(Regional(Government(for(the(financial(
support( of( her( PhD( scholarship( (P.O.R.( Sardegna( F.S.E.( Operational( Programme( of( the(
Autonomous( Region( of( Sardinia,( European( Social( Fund( 2007M2013( C! Axis( IV( Human(
Resources,(Objective(l.3,(Line(of(Activity(l.3.1.)!
(
(
(
(
(
(
(
(
(
(
(
(
(
(
Tomato (Solanum lycopersicum L.) is considered one of the leading vegetable crops worldwide and it is an important model species for plant biology, in particular for the genetic control of quantitative variation, fruit ripening processes and resistance to biotic stress. The availability of the tomato genome has enhanced the chances to unravel the genetic control of simple and complex traits that can be achieved by genome-wide association studies which exploit natural variation.
Accordingly, in the present study it has been investigated a wide collection of tomato mainly including landraces (71 from Italy of which 64 from Sardinia, and 44 from all over the world) which were compared to ten cultivars and five wild-related tomato species. Three experimental trials in two years and two locations were performed and data were collected for a) phenotypic traits by both classic and precision phenotyping, b) genetic diversity by means of 19 micro-satellite markers, c) carotenoid content and d) antixenotic resistance to Tuta absoluta (Meyrick).
Results revealed high levels of phenotypic and genetic diversity pointing to these landraces as a valuable model to identify QTLs and genes of relevant interest. Finally, the associations detected between molecular markers and phenotypic traits indicate that our collection is suitable for future association mapping and transcriptome correlation studies in addition to breeding purposes.
1 The tomato: a brief introduction 5
1.1 Economic and nutritional importance . . . 5
1.2 Taxonomy and botanical description . . . 7
1.3 Tomato origin and domestication . . . 8
1.4 Genetic diversity in wild and cultivated tomato . . . 10
1.5 Challenges of tomato breeding . . . 10
1.6 Genetic resources for tomato breeding . . . 11
1.7 Importance of plant phenotyping . . . 13
1.8 Association mapping in tomato . . . 14
2 Phenotypic and genetic characterization 17 2.1 Introduction . . . 17
2.2 Materials and methods . . . 21
2.2.1 Plant material and experimental design . . . 21
2.2.2 Phenotypic analysis . . . 22 2.2.3 Molecular analysis . . . 23 2.2.4 Statistical analysis . . . 25 2.3 Results . . . 25 2.3.1 Phenotypic analysis . . . 25 2.3.2 Molecular analysis . . . 35 2.4 Discussion . . . 40 2.5 Conclusions . . . 45
3 Diversity for carotenoid contents 47 3.1 Introduction . . . 47
3.2 Materials and methods . . . 51
3.2.1 Plant material and experimental trials . . . 51
3.2.2 Measurements and molecular analysis . . . 51
3.2.3 Statistical analysis . . . 52
3.3 Results . . . 52
3.4 Discussion . . . 56
3.5 Conclusions . . . 61
4 Characterization for antixenotic resistance to Tuta absoluta (Meyrick) 63 4.1 Introduction . . . 63
4.2 Materials and methods . . . 66
4.2.2 Experimental trials . . . 66
4.2.3 Phenotypic characterization . . . 67
4.2.4 Statistical analysis . . . 68
4.3 Results . . . 69
4.3.1 Year 2012 - Open-field conditions . . . 69
4.3.2 Year 2013 - Greenhouse conditions . . . 70
4.3.3 Antixenotic resistance at fruit level . . . 76
4.4 Discussion . . . 79
References 83
Appendices 115
A List of accessions 117
CHAPTER
1
The tomato: a brief introduction
1.1 Economic and nutritional importance
Tomato (Solanum lycopersicum L., formerly Lycopersicon esculentum Miller) is one of the most important vegetable crops in the world (FAOSTAT, 2012), consumed not only as fresh fruit but also as processed product such as paste, whole peeled tomatoes, diced products, juice, sauces and soups (Foolad, 2007). In 2012, the worldwide production of tomato exceeded 160 millions tons becoming the ninth most important crop species and the second most important vegetable after potato (Figure 1.1).
Figure 1.1: Worldwide crop production ranking in 2012 (FAOSTAT, 2012).
Considering a 20 years interval from 1992 to 2012, tomato production has more than doubled (Figure 1.2), and this increase is mainly attributed to the growing importance of Asia in the global economy. In fact, its tomato production moved from 39.4% in 1992 to 60.5% in 2012 (Figure 1.3). In particular, China is the leading producer, followed by India, USA, Turkey, Egypt, Iran, Italy and Spain (Figure
Tomato consumption is due to its high nutritional value and for its importance for a balanced diet. In fact, tomato is a rich source of lycopene, b-carotene, potassium, vitamin A, vitamin C, vitamin E and flavonoids (Willcox et al., 2003). Some of these nutrients, in particular carotenoids, are antioxidants so that the regular consumption of tomatoes has been correlated to protect from the risk of contracting various types of cancer and heart diseases (Borguini and Ferraz Da Silva Torres, 2009).
Figure 1.2: Worldwide tomato production for the period 1992-2012 (FAOSTAT, 2012).
Figure 1.3: Weight in percentage of the different continents in tomato production in 1992 and 2012 (FAOSTAT, 2012).
1.2 Taxonomy and botanical description
The tomato is a fruit berry that is often treated as a vegetable (Foolad, 2007). It belongs to the family of Solanaceae with approximately 90 genera and 3,000-4,000 species, some of which economically important such as potatoes, eggplants, peppers, tobacco and mandrake (Knapp et al., 2004; Weese and Bohs, 2007; Peralta et al., 2008).
The largest genus in Solanaceae is Solanum, that includes 1,250 to 1,700 species. The genus and designation of tomato were for a long time subject of debate, as reported by several authors (Foolad, 2007; Peralta et al., 2007). The use of molecular data allowed a final revision of the phylogenetic classification of the Solanaceae and the genus Lycopersicon was re-introduced in the Solanum genus into the section Lycopersicon (Peralta et al., 2008; Spooner et al., 1993; Bohs and Olmstead, 1997; Olmstead and Palmer, 1997; Olmstead et al., 1999; Peralta and Spooner, 2001; Bohs, 2005; Peralta et al., 2005; Spooner et al., 2005).
Figure 1.5: Standard representation of a tomato plant.
The tomato (2n = 2x = 24) is an autogamous species with a high degree of homozigosity (Rick, 1979). It is a perennial plant, although it is usually cultivated as an annual plant. Wild tomatoes most probably behave as annuals in their natural environment in the Andean mountains and deserts, because frost or drought kills the plants after the first growing season (Müller, 1940). When the climatic conditions are favorable, wild tomatoes can behave as biennials and perennials depending on the plant capacity for developing secondary growth in basal stems and roots (Liedl et al., 2013).
Tomato plants are dicots, and grow as a series of branching stems, with a terminal bud at the tip that does the actual growing. When that tip eventually stops growing, whether because of pruning or flowering, lateral buds take over and grow into other, fully functional, stems. Tomato stems are typically pubescent,
meaning covered with fine short hairs. The shoots are initially erect, but later, due to the weight of the branches, the plants become decumbent or prostrate and in some cases an develop adventitious roots from basal nodes. In the cultivated species (S. lycopersicum) there are cultivars with semi-determinate or determinate growth habit, with short branches and more compact development (Peralta et al., 2007). The leaves are 10-25 cm long, bipinnate. Leaflets are quite variable in size and shape from narrowly elliptic, elliptic to broadly elliptic, ovate or orbicular.
This crop present a variety of trichome types and density patterns that are also taxonomically useful. Trichome length range between 10-2,500 mm and four types of glandular trichomes and also four types of non-glandular trichomes have been described in wild tomatoes (Peralta et al., 2008). Glandular trichomes accumulate essential oils that produce the characteristic smell of tomato leaves that varies considerably among species (Darwin et al., 2003).
The basic inflorescence in wild tomatoes is a cyme with different branching patterns. Flowers usually have five petals, although sometimes seven or more flowers can also be found, and its style are usually inserted. The flowers have the anthers fused along the edges, forming a column surrounding the pistil’s style.
Tomato fruit is classified as a berry and, as a true fruit, it develops from the ovary of the plant after fertilization, its flesh comprising the pericarp walls. The fruit contains hollow spaces full of seeds and moisture, called locular cavities, that can vary among cultivated species. The fruit color is produced by a combination of pigments in the epicarp and subepidermical tissues. Some species have green fruits due to the presence of chlorophyll in the pericarp. In the cultivated tomato, a wide range of varieties with fruits of different colors, shapes and sizes are currently commercialized (Diez, 1995).
1.3 Tomato origin and domestication
Wild tomato species putatively originated in western South America along coasts and high Andes from central Ecuador, through Peru, to northern Chile, and in the Galapagos Islands (Peralta et al., 2008; Blanca et al., 2012). This wild species grow in a variety of habitats ranging from sea level on the Pacific coast up to 3300 m above sea level in the Andean highlands, and from arid to rainy climates (Warnock, 1988). It is likely that the Andean geography, the diverse ecological habitats and the different climates together contributed to wild tomato diversity (Nakazato and Housworth, 2011) that is expressed through morphological, physiological and sexual characteristics (Peralta et al., 2005; Spooner et al., 2005).
Recently, Peralta et al. (2008), in the monograph of wild tomatoes and their relatives, recognized 13 species of wild tomatoes (Table 1.1).
Although the natural distribution of the wild species is restricted to the Andean region, the site of domestication remain uncertain (Labate et al., 2007). Two alternative hypothesis have been proposed, one supporting Peru, another southern Mexico. According to the Mexican hypothesis, the feral populations of tomatoes migrated from Peru into Central America and were domesticated in Mexico (Jenkins, 1948; Rick and Fobes, 1975; Rick et al., 1974). Following the philology, Jenkins (1948) also argued that the name “tomato” comes from the Mexican Nahua word “tomatl” which refers to “plants bearing globous and juicy
Table 1.1: List of wild tomatoes. From Liedl et al. (2013).
Names in Solanum (Peralta et al., 2008) Lycopersicon equivalent
Solanum pennellii Correl Lycopersicon pennellii (Correll) D’Arcy
Solanum habroichates S. Knapp and D. M. Spooner Lycopersicon hirsutum Dunal
Solanum chilense (Dunal) Reiche Lycopersycon chilense Dunal
Solanum huaylasense Peralta Part of Lycopersycon peruvianum (L.) Miller
Solanum peruvianum L. Lycopersicon peruvianum (L.) Miller
Solanum corneliomuelleri J. F. Macbr. (1 geographic race: Misti near Arequipa)
Part of Lycopersicon peruvianum (L.) Miller, also known as L. glandulosum
Solanum Arcanum Peralta (4 geographic races: ‘humifusum’, lomas, Marañon, Chotano-Yamaluc)
Part of Lycopersicon peruvianum (L.) Miller Solanum chmielewskii (C.M. Rick, Kesicki, Fobes and M. Holle) D.M.
Spooner, G.J. Anderson and R.K. Jansen
Lycopersicon chmeilewskii C.M. Rick, Kesicki, Fobes and M. Holle
Solanum neorickii D.M. Spooner, G.J. Anderson and R.K. Jansen Lycopersicon parviflorum C.M. Rick, Kesicki, Fobes and M. Holle
Solanum pimpinellifolium L. Lycopersicon pimpinellifolium (L.) Miller
Solanum lyciopersicum L. Lycopersicon esculentum Miller
Solanum cheesmaniae (L. Riley) Fosberg Lycopersicon cheesmaniae L. Riley Solanum galapense S.C. Darwin and Peralta Part of Lycopersicon cheesmaniae L. Riley
fruit” (Bauchet and Causse, 2012). De Candolle (1886) supported for the first time the Peruvian origin of tomato domestication, based on the linguistic evidence that “mala peruviana” and “pomi del Peru” were used to refer to the tomato, suggesting its initial domestication and transport from Peru to Europe. Arguments supporting were latter maintained by Moore (1935), Muller (1940) and Luckwill (1943). However, none of the evidence is conclusive regarding an initial site of domestication, and tomatoes may have been domesticated independently in both areas (Peralta et al., 2007).
The most likely ancestor of cultivated tomatoes is thought to be the wild cherry tomato, usually identified as S. lycopersicum var. cerasiforme because of its wide diffusion in Central America. Nev-ertheless the genetic investigations made by Nesbitt and Tanksley (2002) demonstrated that the plants known as cerasiforme are a mixture of wild and cultivated tomatoes. A very recent study based on the analysis of single nucleotide polymorphisms not only confirms that S. lycopersicum var. cerasiforme is not the ancestor of the cultivated tomato but also reinforces the model that a pre-domestication of the tomato occurred in the Andean region (Peruvian hypothesis), with the domestication being completed in Mesoamerica (Mexican hypothesis), followed by its introduction to Europe by Spaniards and then spread all over the world (Blanca et al., 2012; Lin et al., 2014).
Tomatoes were introduced into Europe at the beginning of the 16th century by Spaniards (Peralta
et al., 2006). It was probably the Spanish conquistador Cortes who first introduced the small yellow tomato to Spain (McCue, 1952). From Spain, the tomato reached Italy where this species was first recorded in 1544 by the botanist Matthiolus. Introduced tomatoes were cultivated first as an ornamental plant and thought by many to be poisonous, than it was incorporated into the local cuisine only in the late17th or early 18th century (McCue, 1952).
Afterwards, tomato consumption expanded to the north. From England, tomatoes were “exported” to the Middle East/Asia and North America due to English colonization (McCue, 1952)). The real domestication of the tomato as an edible vegetable started during the 19th century. The first european
spontaneous mutation, natural outcrossing or recombination of pre-existing genetic variation (Bauchet and Causse, 2012). Because tomatoes are mostly autogamous, crosses between two different individuals were quite rare and the plants developing from the seeds had a parental phenotype. This allowed obtaining and maintaining fixed populations called “heirlooms” which were unique in their size, color and shape. With expansion of tomato’s use, the 20th century was marked by the development of private seeds
industries which developed the principle of the F1 hybrid (Bai and Lindhout, 2007).
1.4 Genetic diversity in wild and cultivated tomato
The high diversity of the wild tomato species makes them highly valuable for tomato breeding. The levels of genetic variation can vary among species and within species among populations. Moreover, variation in the levels of the genetic diversity can be due to mating system, historical events, selection or adaptation to local environmental conditions (Arunyawat et al., 2007; Städler et al., 2008). For this reason, many efforts have been devoted to genetically characterize these species that can be further used for classical and association mapping studies (Arunyawat et al., 2007), and for the identification of traits useful for crop improvement.
On the contrary, the cultivated tomato is characterized by a limited variability, largely because of bottleneck events and natural and artificial selection that occurred during the domestication and evolution of the modern cultivars (Rick, 1976). It is reported that tomatoes that were first introduced to Europe by Spanish explorers, furnished the entire genetic base for the modern cultivars and consequently the modern European and U.S. cultivars are highly similar (Miller and Tanksley, 1990; Rick and Fobes, 1975). It is estimated that only the 5% of the total Solanum genetic variation can be found within S. lycopersicum (Miller and Tanksley, 1990; Rick and Fobes, 1975) and genes for many desirable agricultural characteristics do not exist in this species. The related wild tomato species, however, are a rich source of desirable genes and characteristics for crop improvement, such as high fruit quality and tolerance to abiotic stresses. Indeed, during the past 70 years, wild species of tomato have been utilized in breeding programs to improve the cultivated tomato (Rick, 1979, 1982, 1973). For example, much of the disease resistance in most commercial cultivars has been derived from the related wild species.
Curiously, despite the low levels of genetic diversity, domestication and selection has led to a greater variety of morphological shapes and colors in domesticated tomato fruits than in wild species. Size ranges from small to very large fruits and shape ranges from round to pear-shaped, torpedo, oval and even bell-pepper, whereas ripe fruit color includes various shades of red, pink, orange, yellow, gold green (Male et al., 1999; Paran and van der Knaap, 2007). Wild tomato relatives, on the other hand, produce small round fruits that are often green in color.
1.5 Challenges of tomato breeding
The role of genetic diversity is crucial for future crop improvements especially under the predicted climate change scenario and it is expected that the demand for tomato production will increase, also based on the
current trends in population growth. Accordingly, as breeding is based on the most compelling demands of the consumers yield and improved agronomical traits represent among the most important objectives also in the breeding of tomato. Among these, other important issues are resistance to pests and diseases, adaptability to the environment, followed by fruit quality and nutritional value, fruit shelf life and taste (Bai and Lindhout, 2007; Bauchet and Causse, 2012; Causse et al., 2007; Foolad, 2007; Bergougnoux, 2014).
The resistance to biotic stresses that always cause significant economic losses is a first concern in both processing and fresh market industries as it is estimated that tomato is the target of more than 200 pests and diseases (Lukyanenko, 1991; Schoonhoven et al., 2005; Bai and Lindhout, 2007). The control of these pest and diseases usually rely on repeated chemical treatments that can often lead to the resistance of these pests or pathogens to a number of chemical active ingredients. The heavy reliance of agriculture on pesticides to manage arthropod pests has led to well-documented negative effects on producers and the environment (Hond et al., 2003). Host plant resistance is one of the most effective forms of insect control and offers a very good alternative to the use of insecticides. To be able to develop insect-resistance varieties, it is essential therefore to identify, characterize and categorize effective sources of resistance (Broekgaarden et al., 2011). Within plant species, there is considerable variation in defence mechanisms that has been shaped by differences in selection pressure (Thompson, 2005; Tumlinson et al., 1993). However, by now only very little of this natural variation has been exploited in agriculture (Broekgaarden et al., 2011). Therefore natural variation among wild relatives of crop plants, or even cultivated accessions, needs to be explored to identify sources of resistance specific for a plant species and to introduce these into modern crop plants (Broekgaarden et al., 2011).
Another important breeding objective is to increase the level of carotenoid content in modern cultivars. The strategy mainly rely on the necessity to improve the overall antioxidant activity that can be obtained by selecting for genotypes with high concentrations of these compounds (Kochian and Garvin, 1999; Tucker, 2003). In terms of human health, tomato fruit provides significant quantities of lycopene and b-carotene (Hanson et al., 2004). Lycopene, the major carotenoid in tomato fruit, is a natural antioxidant that is increasing in demand because numerous studies have demonstrated its positive effects on human health such as a decrease of heart diseases, age-related diseases or an association with a lower risk for certain cancers (Bramley, 2000; Heber and Lu, 2002; Kun et al., 2006; Omoni and Aluko, 2005). Also, b-carotene, or vitamin-A precursor, have been shown to be an effective antioxidant, to help in the prevention of free radical chain reactions and diminish risk for eye diseases (Clevidence et al., 2000; Omaye and Zhang, 1998).
1.6 Genetic resources for tomato breeding
Tomato plant breeding over the past century has been associated with a narrowing of the available genetic diversity within elite germplasm. Cultivars (domesticated varieties) have been selected by humans in the last 10,000 years and inevitably represent a subset of the variation found in their wild ancestors (McCouch, 2004). For this reason, the use of genetic resources plays an important role in breeding programs. New
sources of variation useful for crop improvement include landraces and wild relatives of crop species (McCouch et al., 2013).
Multiple tomato resources are available for both research and crop improvement purposes. Many of these resources are publicly available, contributing greatly to a thriving cooperative worldwide tomato research community. Wild and cultivated germplasm of tomato, as well as various genetic stocks are maintained and made available through various gene banks within the US and around the world (Tanksley and McCouch, 1997; Gonçalves et al., 2009; Zamir, 2001), and this germplasm has been continuously used for a wide variety of basic and applied researches.
As aforementioned, the wild germplasm represents a key resource for tomato improvement. A major objective in modern breeding is to return to the wild ancestors of crop plants and employ the diversity that was lost during domestication for the improvement of yields and other agricultural traits under optimal as well as stress field conditions (Bessey, 1906; Tanksley and McCouch, 1997; Zamir, 2001; Gur and Zamir, 2004). The key role of wild relatives in tomato is demonstrated by the ongoing identification of agronomically useful traits in exotic germplasm (Fulton et al., 2002; Frary et al., 2004; Labate et al., 2007). A major drawback to the use of wild genetic resources in breeding is the linkage drag. This phenomenon is due to the fact that the introgressed gene is often in linkage with other genes, carrying a potential negative impact on other elite varieties (Tester and Langridge, 2010).
Despite the significant loss of genetic diversity, the cultivated tomato shows a large diversity that is particularly evident in the fruit morphology (Figure 1.6). Therefore the diversity within cultivated tomato germplasm might also represent a resource for a variety improvement. In particular, tomato landraces (also called regional varieties) are the earliest form of cultivars and represent the first step in the domestication process (Harlan, 1975; Villa et al., 2005). They constitute the main source of variation in the cultivated species, justifying the increasing interest for their utilization in scientific studies (Chable et al., 2009). Landraces are highly heterogeneous, having been selected for subsistence agricultural environments where low, but stable yields were important and natural environmental fluctuation required a broad genetic base. Landraces are closely related to the wild ancestors and embody a great deal more genetic variation than modern, high-yielding varieties that are selected for optimal performance within a narrow range of highly managed environmental conditions. The value of both the wild species and the early landrace varieties in the context of modern plant breeding is that they provide a broad representation of the natural variation that is present in the species as a whole (Brown, 2000; Brush, 2000; Feuillet et al., 2008). Wild relatives and early landrace varieties have long been recognized as the essential pool of genetic variation that will drive the future of plant improvement (Bessey, 1906; Burbank, 1921). The tomatoes classified as landraces are farmer or gardener-selected and are adapted to the local environment, typically in areas of local subsistence. For these reasons, the information obtained with the analysis of wide collections of landraces would be of great interest in the management of the ex-situ collections, for their utilization in breeding programs or for their direct use in quality markets (Brown, 2000; Brush, 2000).
Other tomato resources interesting for their diversity level and made available through various gene banks, are heirloom tomatoes (Gonçalves et al., 2009), mutant stocks (Emmanuel and Levy, 2002) and mapping populations (Eshed and Zamir, 1995).
Figure 1.6: Tomato fruits are characterized by different sizes and shapes. Source: Tanksley (2004).
Different monogenic mutants stocks, accumulated through years, are available and they represent one of the most direct ways to determine gene function by analyzing the variant phenotype in the organism that is mutated for a particular gene (Emmanuel and Levy, 2002). However, extensive screening of tomato mutants have been limited by the number of plants that can be managed in a field trial. As an example, the most of characterized ripening mutants have reflected mostly spontaneous mutations or wild allele variants (Giovannoni, 2007).
Mapping populations have been widely used to determining the molecular basis of quantitative and qualitative phenotypic variation in tomatoes. One of the first molecular linkage maps of tomato was pub-lished in 1992 (Tanksley et al., 1992) and was based on 62 F2 plants from a cross between S. lycopersicum (cv. VF36-Tm2a) and S. pennellii (LA716) locating, among the others, 100 genes of known function of phenotype and was subsequently extensively enriched until the highly saturated tomato maps now available (http://www.sgn.cornell.edu/cview/map.pl?map_id=9). Among the publicly available map-ping populations there are lines that derive from crosses between wild and cultivated germplasm. In particular, the interspecific crosses from which most linkage maps of tomato have been developed are between the cultivated species and S. pennellii or L. pimpinellifolium); these have contributed to the identification of thousands of QTLs in tomato (Foolad, 2007; Lippman et al., 2007).
1.7 Importance of plant phenotyping
In order to harness the phenotypic variation of cultivated tomato, and to employ this diversity in basic and applied research projects, it is important to measure and quantify these traits accurately and objectively. Phenotypic characterization is based upon a set of methodologies and protocols used to measure plant growth, architecture, and composition at different scales of plant organization, from organs to canopies (Fiorani and Schurr, 2013).
Analysis of phenotypes of germplasm resources is fundamental to subsequently evaluate the molecular basis underlying their traits and their overall performances (McCouch et al., 2013). However, evaluating phenotypic traits such as fruit morphology, color intensity, nutritional quality, firmness, flavour and aroma are challenging and time-consuming because of the quantitative nature of these traits (Fiorani and Schurr, 2013). Moreover, the objective and accurate quantification of these traits can be difficult. Therefore, cost reductions and time gains are among the objectives most desirable of the phenotyping of wide collections (Bilder et al., 2009; Fiorani and Schurr, 2013; McCouch et al., 2013).
Many of the ongoing developments in plant phenotyping are driven by the increasingly available tech-nologies, such as imaging sensors (e.g., high-resolution imaging spectrometers) and advanced software for image analysis and feature extraction for 2D and 3D analyses of shoot and root growth and architecture (Biskup et al., 2007; Mühlich et al., 2008; Paproki et al., 2012). Accordingly, in the last few years, con-ventional phenotyping have been supported by phenomics, defined as the acquisition of high-dimensional phenotypic data on an organism-wide scale (Houle et al., 2010). Phenomics improves the identification of the genetic basis of complex traits and overtakes our limited ability to understand many important biological phenomena by measuring different important variables (Houle et al., 2010). Two-dimensional images derived from photography or scanning is just an example of how to apply phenomics in a cheap and quick manner.
Using these phenotypic data in combination with molecular data, geographic and ecological infor-mation will enable researchers to strategically target field experiments and to develop models that can predict plant performances. This will make plant breeding faster, more efficient and cheaper (McCouch et al., 2013).
1.8 Association mapping in tomato
Collection of high quality phenotypic data is essential for genetic mapping research (Zhu et al., 2008). The phenotypic variation of many complex traits of agricultural or evolutionary importance is influenced by multiple quantitative trait loci (QTLs), their interaction, the environment, and the interaction between QTL and environment. Aside to classical QTL mapping, association mapping is one of the tools that is increasingly been adopted for dissecting complex traits (Zhu et al., 2008; Huang et al., 2010; Atwell et al., 2010).
Association mapping, also known as linkage disequilibrium (LD) mapping, has emerged as a tool to dissect complex traits that is based on the establishment of causal relationships between genotypes and phenotypes in natural or breeding populations (Oraguzie et al., 2007; Nordborg and Tavaré, 2002; Flint-Garcia et al., 2003)). Association mapping offers three different advantages, (i) increased mapping resolution, (ii) reduced research time, (iii) greater allele number (Yu and Buckler, 2006). Moreover, in association mapping studies, phenotypic data collected over years in multiple locations are needed (Flint-Garcia et al., 2005). In this framework, newly discovered candidate gene polymorphism can be tested for association with existing phenotypic data.
the tomato genome (Tomato-Genome-Consortium, 2012), an increasingly of higher numbers of sequences and SNPs are being used (Lin et al., 2014). Nonetheless, micro-satellite or simple sequence repeat (SSR) markers based on short tandem repeats are still of interest in genetic analyses since they are reliable, less costly and show a high level of polymorphism even in closely related material such as the cultivate tomato (Liedl et al., 2013). They are multi-allelic, which is very useful for association studies (Bredemeijer et al., 2002). Approximately 2000 well characterized and mapped micro-satellite markers have been described and characterized in tomato lines (Smulders et al., 1997; Areshchenkova and Ganal, 2002; Shirasawa et al., 2010a; Geethanjali et al., 2010).
CHAPTER
2
Phenotypic and genetic characterization
2.1 Introduction
The tomato (Solanum lycopersicum L.) is an autogamous species having its primary center of diversity in a narrow belt along the Andean region of Ecuador and Peru (Blanca et al., 2012). During its evolution and domestication in Mexico S. lycopersicum has undergone various genetic ‘bottlenecks’ determining the current narrow genetic base (Rick, 1991; Saavedra et al., 2001; Barrero and Tanksley, 2004; Bai and Lindhout, 2007; Foolad, 2007). Moreover, the introduction of the species into Europe at the beginning of the 16th century represented a genetic bottleneck for the cultivated tomato germplasm in Europe
(Rick, 1976; Tanksley and McCouch, 1997; Foolad, 2007). The genetic heritage of the tomato was further eroded by the development of vintage and modern cultivars with a high degree of genetic uniformity, also considering that only a limited number of genotypes were used for breeding (Saavedra et al., 2001; Williams and Clair, 1993; Barrero and Tanksley, 2004; Miller and Tanksley, 1990). The decrease in the intraspecific genetic diversity of cultivated species is a consequence of the continuous selection by breeders of more homogenous genotypes with more specific adaptability (Haussmann et al., 2004). Moreover, due to the replacement or disappearance of wild species and local varieties, countless genomic forms with genes that could have been of interest for breeders were lost (Bai and Lindhout, 2007). For these reasons, genetic variation in modern cultivars or hybrids is limited (Archak et al., 2002; Wang et al., 2005; Sharma et al., 2006; Benor et al., 2008; Yi et al., 2008; Chen et al., 2009), as it has been estimated that cultivated tomato genome contains less than 5% of the genetic variation of the wild relatives (Miller and Tanksley, 1990).
This narrowing of the genetic diversity increases the probability of pest occurrence and vulnerability, as well as diseases. Also considering that, in order to develop new cultivars, genetic variation is necessary for breeding programs. For this reason, it is necessary to promote the decrease of the genetic erosion by introducing common and rare alleles locally distributed, from wild species, or from local and traditional varieties. Moreover, with the increasing consumers request for both quality and diversity of tomato products, it is increasing the need to extensively collect, exploit and evaluate unknown tomato germplasm as well as the collections preserved in germplasm banks with the consequent deployment of new alleles (Agong et al., 2000; Hammer et al., 2003; De Castro et al., 2010). Germplasm banks provide information about the preserved accessions, identifying significant characteristics for genetic breeding programs that can facilitates breeding for wider geographic adaptability and traits of interest, especially with respect to biotic and abiotic stresses (Carvalho and Quesenberry, 2009; Nass and Paterniani, 2000; Agong et al., 2000; Saavedra et al., 2001; Saha et al., 2010).
in the 1930s and allowed the subsequent exploitation of wild species’ alleles (Boswell, 1933; Porte et al., 1941). Spain played a major role in the spread of tomato from the countries of origin and considering that Spain and Italy were the first countries cultivating this crop in Europe, both countries have been recognized as secondary centre of diversification for tomato (Cebolla-Cornejo et al., 2013; Bauchet and Causse, 2012; García-Martínez et al., 2006; Mazzucato et al., 2008). Over five centuries of cultivation, numerous ecotypes adapted to different agroclimatic conditions have been developed (Hammer, 1999; Terzopoulos and Bebeli, 2008; Mazzucato et al., 2008, 2010; García-Martínez et al., 2013). Since the early days of cultivation, a vast number of tomatoes with different fruit shapes have been documented in these countries (Grandillo et al., 2004; De Cillis, 1961). It was the farmers themselves who contributed to the diversification of this crop, by carrying out distinct selections in different cultivation areas (Cebolla-Cornejo et al., 2013). All these types gave rise to landraces, that have been adopted for centuries and are still common in the local markets (Soressi, 1969; Ruiz et al., 2005).
Tomato landraces have been grown and selected by farmers under specific conditions of a limited geographic area (Figàs et al., 2014; Villa et al., 2005). They are usually associated with traditional farming systems and have evolved under natural and farmers’ selection often in low-input agricultural systems (Terzopoulos and Bebeli, 2008). A strong decline in the cultivation of tomato landraces has been recorded during the last decades, because of the introduction of pure lines and hybrids, and the evolution of highly mechanized farming systems (Grandillo et al., 2004; Cebolla-Cornejo et al., 2012; Casals et al., 2011; Ruiz et al., 2005; Terzopoulos and Bebeli, 2008). However, this genetic material is typically characterized by a good stress tolerance and local adaptability (Newton et al., 2010; Hawtin et al., 1996).
Tomato landraces represent a wealth of interesting traits such as biotic stress-resistance and high quality fruits as well (Acciarri et al., 2010; Digilio et al., 2010; Andreakis et al., 2004). In fact, they usually present great variability for agronomic traits and contain higher genetic diversity than modern cultivars or hybrids (Williams and Clair, 1993; Zeven, 1998; Zhu et al., 2003; García-Martínez et al., 2006; Terzopoulos and Bebeli, 2008; Yi et al., 2008; Terzopoulos et al., 2009). Therefore they are among the most important sources of genetic variation within the cultivated tomato and to date, a large number of local varieties have been collected (Robertson and Labate, 2007), which provide a potential for increasing the genetic variation in modern breeding (Hawtin et al., 1996; Hoisington et al., 1999; Huang et al., 2010). Moreover, landraces are gaining increasing attention because of their value for niche markets, their yield stability in low input agricultural systems and their growing popularity for sustainable farming (Andreakis et al., 2004; Fernie et al., 2006; Berg, 2009; García-Martínez et al., 2013; Caramante et al., 2011), thus determining an increasing demand by consumers (Brugarolas et al., 2009; Causse et al., 2010). However, in spite of their great potential as a source of variability, the lack of information about their origin, genealogy, agronomic traits and genetic background has limited the use of these varieties in breeding programs (Carelli et al., 2006; Cebolla-Cornejo et al., 2013; García-Martínez et al., 2013). Nowadays, it is still difficult to differentiate in some cases between real landraces, selected by farmers, and old obsolete commercial varieties selected by breeders, as only their designations and not their origins are conserved in the spoken tradition (Cebolla-Cornejo et al., 2013).
In this context, the characterization of landraces is imperative for their efficient use in plant breeding and to improve crop production (Fischbeck, 1989) as an efficient conservation and exploitation of landraces also require the study of their genetic diversity structure (Van Hintum and Elings, 1991; Labate et al., 2011; Corrado et al., 2013; García-Martínez et al., 2013). In fact, genetic profiles of tomato landraces are clearly different from those of modern tomato hybrids and their initial diversity may have been conserved in a range of landraces that have been cultivated for centuries (Carelli et al., 2006; García-Martínez et al., 2006; Terzopoulos and Bebeli, 2008). The evaluation of the diversity of a given collection can be based on phenotypic traits (Yan et al., 2007; Terzopoulos and Bebeli, 2010; Cebolla-Cornejo et al., 2013), genetic markers (Li et al., 2005; Rodríguez et al., 2011; Rao et al., 2012) or their combination (Terzopoulos and Bebeli, 2008; Labate et al., 2011; Hu et al., 2012; Xu et al., 2013). The classification of individuals and quantification of genetic diversity in gene banks is usually aimed at the identification of similarity groups based on separate analyses of continuous (e.g., plant height, fruit weight, days to flowering) and discrete variables (such as fruit color and shape, the presence or absence of a trait, or a molecular marker) (Mohammadi and Prasanna, 2003; Crossa and Franco, 2004; Sudré et al., 2007).
Despite the low variability of S. lycopersicum, several molecular markers based on isozymes (Rick and Fobes, 1974), seed proteins (Van den Berg, 1991; Chakraborti et al., 1992; Wang et al., 2000), RFLP (Miller and Tanksley, 1990), AFLP (Park et al., 2004), CAPS (Yang et al., 2004) and SSR (Smulders et al., 1997; Bredemeijer et al., 2002) have been used to address variety identification and relationships among tomato landrace and cultivar collections, as well as in wild species (McClean and Hanson, 1986; Rick et al., 1990; Miller and Tanksley, 1990; Egashira et al., 2000; Zhu et al., 2003). The current genomic era is characterized by new powerful genome sequencing platforms, such as next-generation sequencing (NGS), providing a better way to develop DNA molecular markers (Davey et al., 2011). Single nucleotide polymorphisms (SNPs) have been identified as powerful markers for use in genome-wide studies and in crop breeding programs for genetic diversity analysis, cultivar identification, characterization of genetic resources, and association with agronomic traits (Edwards and Batley, 2010). As tomato genome has been sequenced and assembled (Tomato-Genome-Consortium, 2012), a large amount of tomato NGS data is available for understanding the genetic variations in the tomato genome (Holton, 2001; Shirasawa et al., 2010b; Sim et al., 2012; Kim et al., 2014; Lin et al., 2014). However, in order to perform a rapid and cost-saving genetic diversity study in tomato, the use of SSR markers may be adequate because of their co-dominance, high reproducibility, easy detection, and multiallelic variation (Smulders et al., 1997; Areshchenkova, 2000; He et al., 2003; Frary et al., 2005; Mazzucato et al., 2008).
Although molecular markers are of great utility for studying the relationships among local tomato varieties (Terzopoulos and Bebeli, 2008; Mazzucato et al., 2010; Cebolla-Cornejo et al., 2013; García-Martínez et al., 2013), phenotypic traits remain indispensable descriptors for evaluating genetic variation and try to link quantitative trait loci (QTLs) responsible for this variation to functional genes. Despite phenotypic traits can be affected by environmental factors (Van Berloo et al., 2008), morphological char-acterization is essential to define the characteristics of local varieties for their protection and registration as recognized conservation varieties (Spataro and Negri, 2013; Hurtado et al., 2014). In this respect, tomato characterization has usually been performed with conventional highly heritable morphological
descriptors based on seedling, plant, inflorescence, flower, fruit, and agronomic traits (Institute, 1996; Scott, 2010). Morphological traits are intuitive and practical, but as they are subject to environmental influences and selection pressure during domestication and breeding, the interpretation of the results of diversity studies based on such traits can be difficult (Van Berloo et al., 2008).
These conventional descriptors are very useful for characterization of varieties but have some limita-tions, especially when characteristics used for establishing cultivar groups in local varieties correspond to subtle differences in fruit morphology (Scott, 2010). In these cases, conventional descriptors may need to be complemented with more precise characterization tools. Recently, a free high-throughput phenomics software tool (Tomato Analyzer) for the analysis of fruit shape and flesh color of tomato has been de-veloped (Brewer et al., 2006; Gonzalo and Van Der Knaap, 2008; Rodríguez et al., 2010b,a). Tomato Analyzer allows precision phenotyping by the scoring of a large number of fruit traits (e.g. shape and flesh color) from scanned images of fruit sections. Several studies have been performed with Tomato An-alyzer to characterize local tomato varieties (Mazzucato et al., 2010; Scott, 2010; Rodríguez et al., 2011; Panthee et al., 2013; Bota et al., 2014; Figàs et al., 2014) as well as to study the genetics of fruit shape in this crop (Brewer et al., 2007; Gonzalo and Van Der Knaap, 2008; Gonzalo et al., 2009; Rodríguez et al., 2011; Rodriguez et al., 2013). These studies reveal that Tomato Analyzer is a powerful tool for precisely describing tomato fruit morphology and it may be a precise complementary tool to conventional characterization of tomato varieties and to distinguish closely related materials (Figàs et al., 2014).
In Sardinia, tomato landraces were widely cultivated until the introduction of modern cultivars. Today, the vast majority of landraces are cultivated in horticultural gardens for personal consumption. Many crop landraces of different species have been collected during 2006 and 2007 and stored at the “Centro Interdipartimentale per la Conservazione e Valorizzazione della Biodiversità Vegetale” (CBV), University of Sassari, Italy (Attene and Rodriguez, 2008). However, only a subsample of this collection has been previously evaluated (Attene and Rodriguez, 2008), and a complete and depth knowledge is indispensable for their efficient use to improve crop production and quality, for promoting them in quality markets and for future plant breeding studies.
In this context, the aim of this work is to evaluate a wide collection of cultivated tomato, that includes the current complete collection of Sardinian landraces, a collection of landraces from around the world, landraces from different Italian regions, vintage cultivars and wild tomato species. These accessions were characterized in two different locations and cropping seasons trough the evaluation of several morpho-phenological traits of interest, using both conventional descriptors and precision phenotyping. Genetic diversity and structure of the collection was also evaluated by using 19 SSR markers. The main objective of the present study was to assess the morphological and genetic variation of this wide tomato collection and evaluate its suitability for association mapping studies.
2.2 Materials and methods
2.2.1 Plant material and experimental design
A collection of 127 cultivated tomato (Solanum lycopersicum L.) and wild-related tomato species was investigated. The cultivated tomato accessions included 64 tomato landraces from Sardinia, 7 landraces from other regions of Italy, 44 landraces from different countries around the world, and 10 vintage cultivars. The Sardinian landraces were mainly collected during 2006 and 2007 (Attene and Rodriguez, 2008) when they had been cultivated locally in the same farm (according to the information given by farmers) no less than 30 years (Louette, 2000). Seeds of Italian landraces, cultivars and wild species Solanum lycopersicum var. cerasiforme and Solanum pimpinellifolium were kindly provided by Prof. Andrea Mazzucato, University of Viterbo, Italy. Seeds of accessions from other countries of the world were obtained from the Centre for Genetic Resources, Wageningen University, The Netherlands. The entire collection is now stored at the “Centro Interdipartimentale per la Conservazione e Valorizzazione della Biodiversità Vegetale” (CBV), University of Sassari, Italy. For each group of accessions we use an acronym (L-SAR, Sardinian landrace; L-IT, Italian landrace; L-EXOT, exotic landrace; C, vintage cultivar; W, wild species). The seed stock also includes an accession (Cocktail) that is close to the wild-species S. pimpinellifolium (data not shown) and, for this reason, it is classified as wild. The complete list of the accessions is reported in Table A.1.
The accessions have been studied throughout two experimental trials, one in 2012 and one in 2013. In 2012, the experimental trial was carried out in an open-field in Oristano, Sardinia, following a randomized complete block design with five replicates, 124 treatments (accessions) and 4 plants per plot. The field was characterized by eight mulched double rows, with 0.9 m between each double row, 0.6 m between the rows of the same double row and plants spaced 0.4 m apart in-the-row. Transplantation was done by hand at the beginning of June, 2012. Plants of a commercial tomato variety were transplanted all around the field as borders of the trial. All plants were staked by reeds and pruned to one stem, excepting genotypes with a determined growth type. When the plants with undetermined growth type reached the height of about 1.8 m, the apex was trimmed. Standard agronomic practices were used. The trial ended in September when all fruits were harvested.
The experimental trial in 2013 was carried out in a greenhouses at the “M. Deidda” experimental farm of Ottava, University of Sassari, Sardinia. The trial followed a randomized complete block design with three replicates, 127 treatments (accessions) and 1 plant per plot. The field was characterized by three mulched double rows, one for each replicate, with 1.2 m between each double row, 0.4 m between the rows of the same double row and 0.4 m among plants on the same row. Transplantation was done by hand at the end of January 2013. Plants of a commercial tomato variety were transplanted all around the field as borders of the trial. All plants were staked by cords and pruned to one stem, excepting genotypes with a determined growth type. When the plants with undetermined growth type reached the height of about 1.8 m, the apex was trimmed. Standard agronomic practices were used. The trials ended in July when all fruits were harvested. Most of the accessions were shared between the two trials from 2012 and 2013,
except for few lines analyzed only in 2013.
The list of the genotypes and the number of accessions studied during each experimental trial is reported in Table 2.1. Details about accession name, group and origin are given in Table A.1.
Table 2.1: Number of accessions analyzed for each group in 2012 and 2013.
Collection Collection code 2012 2013
Sardinian landraces L-SAR 61 64
Italian landraces L-IT 6 7
Exotic landraces L-EXOT 44 43
Cultivars C 10 10
Wild-related species W 3 3
Total accessions 124 127
2.2.2 Phenotypic analysis
Individual plants were characterized using twenty-six agronomic conventional traits, both phenological and morphological traits. The registered descriptors were sowing date (SD, date), transplanting date (TD, date), flowering date (FLD, date), ripening date (RD), days to flowering from sowing date (DTFs, (FLD-SD), days), days to flowering from transplanting date (DTFt, (FLD-TD), days), flowering-ripening interval (FRI, [FLD-RD], days), plant growth type (PGT, score), number of flowers per inflorescence (NFI), inflorescence type (ITP, score), stigma exertion (SE, score), leaf attitude (LAT, score), leaf length (LLE, cm), leaf width (LWI, cm), leaf length/width (LL/W, [LLE/LWI]), foliage density (FD, score), number of harvested fruits (NHF), weight of harvested fruits (WHF, g), mean fruit weight (FW, [WHF/NHF], g), fruit length (FLE, cm), fruit width (FWI, cm), fruit length/width (FL/W, [FLE/FWI]), fruit color (FCO, score), fruit shape (FSH, score), green shoulder (GS, score), shape of pistil scar (SPS, score), fruit blossom end shape (SBE, score) fruit cross-sectional shape (FSS, score), number of locules (NOL), puffiness appearance (PUF, score), pericarp thickness (PTK, cm) and degrees Brix (BRIX, Bx). Most of the descriptors were taken from the guidelines of the Bioversity International, formerly IPGRI (http://tinyurl.com/n7k75m6). All variables used to calculate other parameters (i.e. SD, TD, FLD, RD, NHF, WHF) were not used for further analysis.
The parameters scored in each trial are listed in Table 2.2.
In addition to these conventional descriptors, 38 fruit-related traits were analyzed by using the software Tomato Analyzer (Brewer et al., 2006; Gonzalo and Van Der Knaap, 2008). This analysis was done on all the accessions cultivated in 2013 (Table 2.1). For each accession, six fruits were harvested at the ripe stage. Three of them were cut longitudinally and the others transversally, then scanned with an Mustek Must A3 600S scanner at a resolution of 300 dpi, saved as JPEG images and subjected to morphometric analysis with Tomato Analyzer version 3 software (Rodríguez et al., 2010a), setting ‘centimeters’ as units, 0.9 as upper position and 0.1 as lower position for blockiness position settings, and 20 degrees as macro distance and three degrees as micro distance for proximal and distal angles settings. The following trait groups were selected from attributes list: basic measurements (seven), fruit shape index (three), blockiness (three), homogeneity (three), proximal fruit end shape (four), distal fruit end shape (four), asymmetry (six), internal eccentricity (five), and latitudinal section (three), for a total of 38 traits. Thirty-five traits
Table 2.2: List of conventional traits evaluated for each trial in 2012 and 2013.
Trait Code Typea 2012 2013
PHENOLOGY DESCRIPTORS
Days to flowering from sowing (days) DTFs QNT 3 3
Days to flowering from transplanting (days) DTFt QNT 3 3
Flowering-ripening interval FRI QNT 3 3
HABITUS DESCRIPTORS
Plant growth type PGT QLT 3 3
INFLORESCENCE DESCRIPTORS
Number of flowers per inflorescence NFI QNT 3 3
Inflorescence type ITP QLT 3 3
Stigma exertion SE QLT 3 3
LEAF DESCRIPTORS
Leaf attitude LAT QLT 3 3
Leaf length (cm) LLE QNT 3 3
Leaf width (cm) LWI QNT 3 3
Leaf length/width LL/W QNT 3 3
Foliage density FD QLT 3 3
FRUIT DESCRIPTORS
Mean fruit weight (g) FWG QNT 3 3
Fruit length (cm) FLE QNT 3 3
Fruit width (cm) FWI QNT 3 3
Fruit length/width FL/W QNT 3 3
Fruit color FCO QLT 3 3
Fruit shape FSH QLT 3 3
Green shoulder GRS QLT 3 3
Shape of pistil scare SPS QLT 3 3
Fruit blossom end shape SBE QLT 3 3
Fruit cross-sectional shape FSS QLT 3 3
Number of locules NOL QNT 3 3
Puffiness appearance PUF QLT 3 3
Pericarp thickness (cm) PTK QNT 3 3
Degrees Brix ( Bx) BRIX QNT 3 3
aQLT = qualitative trait, QNT = quantitative trait.
were assigned to the longitudinal section, and three to the transversal section.
The parameters scored through Tomato Analyzer are listed in Table 2.3. Full details about the description of each of the measured traits can be found in Rodríguez et al. (2010a).
2.2.3 Molecular analysis
A molecular analysis was also performed on all the accessions cultivated during 2013 (Table 2.1). The genomic DNA was extracted from young leaves by taking approximately 100-300 mg of tissue from one plant per accession, for a total of 127 samples. The frozen leaf tissue was grinded with a TissueLyser II (Qiagen s.r.l., Milano, Italy) and DNA extracted using the Qiagen DNeasy Plant Mini Kit (Qiagen s.r.l., Milano, Italy). All samples of extracted DNA were stored at -20 C.
The molecular analyses were conducted with 19 simple sequence repeat (SSR) markers that were selected from the literature to obtain a good coverage of the tomato genome. Ten SSRs were selected to include a group of loci in regions harboring reported QTLs that affect several fruit features (Q-SSRs), whereas the remaining SSRs do not have a known linkage with genes of interest (NQ-SSRs). The complete
Table 2.3: List of conventional traits evaluated using Tomato Analyzer in 2013.
Trait Sectiona Attribute group Trait Section Attribute group
Perimeter (cm) L Basic measurements Proximal indentation area L Proximal fruit end shape
Area (cm2) L Basic measurements Distal angle micro ( ) L Distal fruit end shape
Width mid-height (cm) L Basic measurements Distal angle macro ( ) L Distal fruit end shape Maximum width (cm) L Basic measurements Distal indentation area L Distal fruit end shape Height mid-width (cm) L Basic measurements Distal end protrusion L Distal fruit end shape
Maximum height (cm) L Basic measurements Obovoid L Asymmetry
Curved height (cm) L Basic measurements Ovoid L Asymmetry
Fruit shape index external I L Fruit shape index V.Asymmetry L Asymmetry
Fruit shape index external II L Fruit shape index H.Asymmetry.Ob L Asymmetry
Curved fruit shape index L Fruit shape index H.Asymmetry.Ov L Asymmetry
Proximal fruit blockiness L Blockiness Width widest pos L Asymmetry
Distal fruit blockiness L Blockiness Eccentricity L Internal eccentricity
Fruit shape triangle L Blockiness Proximal eccentricity L Internal eccentricity
Ellipsoid L Homogeneity Distal eccentricity L Internal eccentricity
Circular L Homogeneity Fruit shape index internal L Internal eccentricity
Rectangular L Homogeneity Eccentricity area index L Internal eccentricity
Shoulder height L Proximal fruit end shape Lobedness degree T Latitudinal section
Proximal angle micro ( ) L Proximal fruit end shape Pericarp area T Latitudinal section Proximal angle macro ( ) L Proximal fruit end shape Pericarp thickness T Latitudinal section
aL = longitudinal section, T = transversal section.
list of the markers is shown in Table 2.4. All details are available in Table B.1.
All PCR reactions were performed using the EconoTaqR DNA Polymerase Kit (Tema Ricerca s.r.l.,
Bologna, Italy) on a Perkin-Elmer PCR machine (Applied Biosystems, Foster City, CA, USA), with a standard program: an initial cycle of 5 min at 94 C, followed by 30 cycles of 30 s at 94 C, 30 s at X C and 30 s at 72 C, plus 15 min at 72 C. X C refers to the annealing temperature variable for the different primers used (Table B.1).
PCR products were finally separated on 8M denaturing polyacrylamide gels and displayed through a silver staining method (Baudoin et al., 2007). All individuals were genotyped by scoring the bands using a ladder with a known molecular weight as a reference.
Table 2.4: List of SSR markers used for genetic analysis.
Marker Chromosome Typea Marker Chromosome Type
TMS42 11 Q-SSR EST245053 1 NQ-SSR TMS52 12 Q-SSR LE20592 11 NQ-SSR TMS59 8 Q-SSR LE21085 4 NQ-SSR TMS63 1 Q-SSR LELE25 10 NQ-SSR EST253712 6 Q-SSR LELEUZIP 8 NQ-SSR EST258529 5 Q-SSR LEMDDNa 5 NQ-SSR Tom 59-60 3 Q-SSR Tom 47-48 3 NQ-SSR Tom 236-237 9 Q-SSR Tom 162-163 1 NQ-SSR SLM6-14 6 Q-SSR SLM12-29 12 NQ-SSR SLM6-35 6 NQ-SSR
2.2.4 Statistical analysis
All the statistical analyses were done by using JMP 10.0.0 (SAS Institute, Inc. 2012) and when necessary accessions with missing data were excluded from the analysis.
Ranges and mean values were calculated for each accession. For conventional traits, the analysis of variance (ANOVA) was performed over all the accessions to test the presence of significant differences among genotypes. The interaction between the two experimental trials was performed considering only the 120 accessions shared among the two. For Tomato Analyzer descriptors, ANOVA was performed on individual fruits values to detect differences among accessions.
Nei’s diversity index (Nei, 1978) was used to evaluate the diversity among qualitative traits. Broad sense heritability was calculated by fitting model with random effects through the restricted maximum likelihood method (REML) (Patterson and Thompson, 1971; Patterson and Nabugoomu, 1992; Lynch et al., 1998).
Pearson’s correlations were estimated to verify associations among different traits.
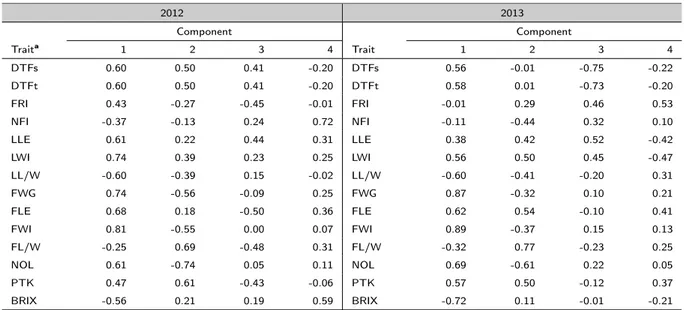
Multivariate analyses were done using cluster analysis by the hierarchical method and by principal components analysis (PCA).
Descriptive genetic statistics were calculated for the overall collection and within each group of geno-types by using PopGen 1.32 (Yeh Francis et al., 1999) and Arlequin 3.5.1 (Excoffier and Lischer, 2010). The genetic distances among the different groups were determined using the FSTstatistics (Wright, 1949)
and their significance was tested using 105 permutations (Arlequin 3.5.1.2; Excoffier and Lischer, 2010).
To investigate the population structure, the model-based clustering method as implemented in Struc-ture 2.3.4 was used (Pritchard et al., 2000). This method assigns each individual to different groups according to a membership coefficient (qi). The admixture model was run using the options ‘correlated allele frequencies among populations’ and ‘infer the degree of admixture (a) by the data’. For each K (number of hypothetical populations), 20 runs (burn-in length, 100,000; iterations, 200,000) were carried out, and the most likely number of K was determined using the K statistic (Evanno et al., 2005), using the online program STRUCTURE Harvester (Earl et al., 2012).
To detect possible marker-trait associations, the GLM (General Linear Model) test (TASSEL 2.1) that accounts for the genetic structure of the collection, was performed using 104permutations.
2.3 Results
2.3.1 Phenotypic analysis
The ANOVA was performed using the year, the genotype and the interaction year by genotype as effects of the model (Table 2.5). The year is highly statistically significant for all the quantitative traits, with the exception of the number of flowers per inflorescence (NFI), the leaf width (LWI) and the fruit weight (FWG). Strong significant differences (P < 0.0001) among genotypes and for the interaction year ⇥ genotype were detected for all the parameters (Table 2.5).
Table 2.5: ANOVA analysis for all the conventional quantitative traits evaluated in 2012 and 2013 among cultivated tomato accessions (landraces and cultivars). Year, genotype and the interaction year ⇥ genotype have been considered as effects of the model.
Year Genotype Year ⇥ Genotype
Traita DF SS F DF SS F DF SS F DTFs 1 503160.11 26202.61 **** 119 39345.61 17.22 **** 119 14265.53 6.24 **** DTFt 1 125396.97 6813.21 **** 119 37496.46 17.12 **** 119 13092.69 5.98 **** FRI 1 242044.26 6896.66 **** 119 31310.59 7.50 **** 119 22560.47 5.40 **** NFI 1 48.83 2.77 119 10688.18 5.10 **** 119 4761.10 2.27 **** LLE 1 560.23 35.29 **** 119 11519.14 6.10 **** 119 3726.68 1.97 **** LWI 1 3.15 0.13 119 17795.51 6.33 **** 119 6537.37 2.32 **** LL/W 1 0.55 27.65 **** 119 9.23 3.93 **** 119 3.82 1.62 **** FWG 1 398.00 0.12 119 12820541.00 31.87 **** 119 1192201.00 2.96 **** FLE 1 27.22 55.04 **** 119 3835.74 65.18 **** 119 216.29 3.68 **** FWI 1 11.70 12.08 *** 119 7515.26 65.17 **** 119 343.80 2.98 **** FL/W 1 1.78 122.68 **** 119 208.94 120.73 **** 119 4.37 2.52 **** NOL 1 57.09 16.02 **** 119 30125.08 71.02 **** 119 1008.77 2.38 **** PTK 1 2.69 350.76 **** 119 23.26 25.44 **** 119 2.42 2.65 **** BRIX 1 242.60 628.87 **** 119 572.35 12.47 **** 119 123.87 2.70 ****
DF = degrees of freedom, SS = sum of squares, F = F ratio * P < 0.05, ** P < 0.01, *** P < 0.001, **** P < 0.0001.
aDTFs, days to flowering from sowing; DTFt, days to flowering from transplanting; FRI, flowering-ripening interval; NFI, number of flowers
per inflorescence; LLE, leaf length; LWI, leaf width; LL/W, leaf length/width; FWG, mean fruit weight; FLE, fruit length; FWI, fruit width; FL/W, fruit length/width; NOL, number of locules; PTK, pericarp thickness; BRIX, degrees Brix.
both in 2012 and in 2013 (Table 2.6). This variation is highly significant (P < 0.0001) for all the traits in both experiments. This wide variation was particularly evident for some traits, such as the number of flowers per inflorescence (NFI), the fruit weight (FWG) and the number of locules (NOL), showing a high coefficient of variation (CV) of 36.28, 73.77 and 62.41%, respectively, in 2012 and 38.76, 60.23 and 63.40% in 2013.
As regards to the 38 Tomato Analyzer descriptors analyzed in 2013 (Table 2.7), 36 traits showed high significant differences among genotypes (P < 0.0001), whereas lower significant differences (P < 0.01) were found only for one of them (Proximal fruit blockiness). No significant differences were found for the trait ‘Distal angle micro’ (Table 2.7). Some descriptors showed an interesting range of variation, such as the Perimeter (7.64-35.84 cm), Area (3.88-66.39 cm2), Fruit shape triangle (0.65-2.00), Fruit shape index
internal (0.50-2.19), Lobedness degree (0.80-6.85) and Pericarp thickness (0.10-0.38).
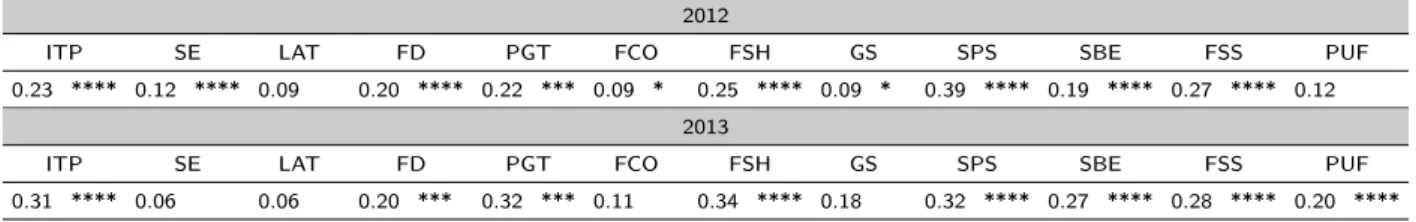
The Nei’s diversity index (He) calculated among qualitative traits ranged from 0.11 for the puffiness
appearance (PUF) to 0.78 for the fruit shape (FSH) in 2012, and from 0.03 for the green shoulder (GRS) to 0.79 for FSH in 2013 (Table 2.8). All traits showed the same number of variants in the two years except for the inflorescence type (ITP), the fruit shape (FSH) and the shape of pistil scare (SPS), for which one additional variant was detected in 2013. For some of the descriptors many accessions showed only one variant such as the puffiness appearance (PUF) that in 2012 was mostly slight, and the green shoulder (GRS) that in 2013 was mostly absent.
Broad sense heritability (H2) for conventional traits showed few differences between the two
experi-ments (Figure 2.1). In 2012, H2varied between 26.8% for the leaf length/width ratio (LL/W) and 85.2%
for the fruit length/width ratio (FL/W), while in 2013 H2 ranged from 24.6% for the leaf length (LLE)
Table 2.6: Significant differences among cultivated tomato accessions for all the conventional quantitative traits in 2012 and 2013. 2012
Traita Mean Min Max SD DF SS F
DTFs 58.45 48 73 4.19 120 36605.15 19.24 **** DTFt 24.44 14 39 4.19 120 36594.51 19.32 **** FRI 47.09 36 57 4.03 120 30281.81 8.31 **** NFI 11.62 4 33 4.18 120 12137.04 5.16 **** LLE 34.00 20.5 44.7 3.49 120 15288.39 8.88 **** LWI 31.82 13.6 45.2 4.45 120 25380.66 9.75 **** LL/W 1.09 0.9 1.5 0.10 120 12.28 4.97 **** FWG 113.83 6 435 94.17 120 8492981.50 19.21 **** FLE 4.94 2.0 9.6 1.45 120 2328.76 32.73 **** FWI 5.79 2.2 10.4 2.00 120 4325.81 33.11 **** FL/W 0.93 0.49 2.05 0.33 120 120.43 55.26 **** NOL 5.70 2 17 3.87 120 14754.16 36.25 **** PTK 0.45 0.2 0.7 0.11 120 11.04 9.97 **** BRIX 4.06 2.6 6.2 0.58 120 373.43 6.50 **** 2013
Traita Mean Min Max SD DF SS F
DTFs 100.10 73 118 8.53 123 25352.74 4.28 **** DTFt 45.26 19 63 8.16 123 23670.96 4.66 **** FRI 77.22 55 105 9.57 123 28083.72 3.18 **** NFI 11.07 5 27 4.30 123 6545.15 4.38 **** LLE 35.44 21.5 45.3 4.15 123 5889.64 2.03 **** LWI 31.98 13.2 41.8 5.26 123 9276.99 2.29 **** LL/W 1.13 0.9 1.6 0.13 123 5.42 2.98 **** FWG 127.57 3.2 336.3 76.29 123 5972561.80 16.30 **** FLE 4.89 1.5 9.1 1.3 123 1852.45 39.14 **** FWI 6.27 1.7 10.2 1.9 123 3846.18 37.46 **** FL/W 0.85 0.46 2.12 0.32 123 105.78 80.49 **** NOL 6.51 2 17 4.14 123 17640.25 38.62 **** PTK 0.53 0.1 0.8 0.13 123 16.66 21.29 **** BRIX 4.71 3.2 7.2 0.65 123 377.98 10.79 ****
Min = minimum value, Max = maximum value, SD = standard deviation, DF = degrees of freedom, SS = sum of squares, F = F ratio * P < 0.05, ** P < 0.01, *** P < 0.001, **** P < 0.0001.
aDTFs, days to flowering from sowing (days); DTFt, days to flowering from transplanting (days); FRI, flowering-ripening interval (days);
NFI, number of flowers per inflorescence; LLE, leaf length (cm); LWI, leaf width (cm); LL/W, leaf length/width; FWG, mean fruit weight (g); FLE, fruit length (cm); FWI, fruit width (cm); FL/W, fruit length/width; NOL, number of locules; PTK, pericarp thickness (cm); BRIX, degrees Brix ( Bx).
of 55.3% in 2012 and of 59.1% in 2013; the highest variations were mainly seen for FRI (+11.8), NFI (+12.1), LLE (-17.6), LWI (-14.7), LL/W (+13.3), PTK (+17.5) and BRIX (+18.3). Interestingly, in 2013 the heritability for fruit morphology and fruit quality traits showed the highest values among all the analyzed traits.
Broad sense heritability (H2) for Tomato Analyzer descriptors showed an average value of 63% (Figure
2.2). The highest H2 values was shown by the trait ‘Pericarp thickness’ (H2 = 92.1%), whereas the
inheritance level of the trait ‘Distal angle micro’ was null.
Pearson’s correlations were observed among conventional quantitative traits in 2012 and 2013 (Table 2.9). As an example, the mean fruit weight (FWG) was strongly and positively correlated to the fruit size (FLE and FWI) and to the number of locules (NOL), as well as to the pericarp thickness (PTK). Moreover, FWG was negatively correlated to the degrees Brix (BRIX) indicating that small fruits are
Table 2.7: Significant differences among cultivated tomato accessions for all the Tomato Analyzer quantitative traits in 2013.
Trait Mean Min Max SD DF SS F
Longitudinal section descriptors
Perimeter 20.75 7.64 35.84 5.90 114 11444.35 20.07 **** Area 27.84 3.88 66.39 13.67 114 61279.28 14.73 **** Width mid-height 6.08 2.40 11.75 1.98 114 1287.43 17.37 **** Maximum width 6.16 2.42 11.79 1.98 114 1289.39 17.85 **** Height mid-width 4.76 1.90 8.96 1.41 114 674.19 26.43 **** Maximum height 5.38 1.95 9.29 1.53 114 784.76 25.03 **** Curved height 5.56 2.11 9.25 1.51 114 768.56 22.68 ****
Fruit shape index external I 0.92 0.47 1.80 0.28 114 25.97 31.54 ****
Fruit shape index external II 0.84 0.28 1.83 0.32 114 34.31 28.51 ****
Curved fruit shape index 0.97 0.58 1.89 0.28 114 27.17 25.80 ****
Proximal fruit blockiness 0.77 0.51 0.91 0.06 114 1.24 1.55 **
Distal fruit blockiness 0.62 0.37 0.81 0.07 114 1.76 5.21 ****
Fruit shape triangle 1.27 0.65 2.00 0.22 114 16.12 3.05 ****
Ellipsoid 0.05 0.02 0.12 0.02 114 0.09 7.94 ****
Circular 0.11 0.03 0.32 0.05 114 0.85 10.63 ****
Rectangular 0.55 0.44 0.71 0.03 114 0.35 2.78 ****
Shoulder height 0.06 0.00 0.15 0.03 114 0.39 5.54 ****
Proximal angle micro 212.34 117.45 262.18 29.16 114 289535.85 1.88 ****
Proximal angle macro 141.20 29.90 200.65 32.20 114 357711.48 11.14 ****
Proximal indentation area 0.13 0.00 0.46 0.09 114 2.76 4.70 ****
Distal angle micro 144.88 57.81 252.42 42.09 114 594182.53 0.84
Distal angle macro 115.29 50.70 174.15 24.66 114 203500.28 13.27 ****
Distal indentation area 0.02 0.00 0.23 0.04 114 0.57 3.19 ****
Distal end protrusion 0.01 0.00 0.16 0.02 114 0.17 2.05 ****
Obovoid 0.02 0.00 0.31 0.04 114 0.61 4.40 ****
Ovoid 0.16 0.00 0.32 0.06 114 1.40 2.93 ****
V.Asymmetry 0.12 0.02 0.32 0.07 114 1.52 3.22 ****
H.Asymmetry.Ob 0.02 0.00 0.37 0.06 114 1.13 3.03 ****
H.Asymmetry.Ov 0.20 0.00 0.49 0.11 114 4.40 5.22 ****
Width widest pos 0.45 0.32 0.64 0.05 114 0.85 3.83 ****
Eccentricity 0.82 0.64 0.95 0.06 114 1.29 6.02 ****
Proximal eccentricity 1.05 0.77 1.26 0.11 114 4.50 6.69 ****
Distal eccentricity 0.89 0.80 1.11 0.05 114 0.76 4.95 ****
Fruit shape index internal 0.99 0.50 2.19 0.34 114 39.67 21.41 ****
Eccentricity area index 0.37 0.18 0.54 0.09 114 2.96 11.43 ****
Transversal section descriptors
Lobedness degree 2.08 0.80 6.85 1.11 122 449.13 2.61 ****
Pericarp area 0.64 0.38 0.80 0.11 122 4.24 24.03 ****
Pericarp thickness 0.20 0.10 0.38 0.07 122 1.79 36.03 ****
Min = minimum value, Max = maximum value, SD = standard deviation, DF = degrees of freedom, SS = sum of squares, F = F ratio * P < 0.05, ** P < 0.01, *** P < 0.001, **** P < 0.0001.
usually more sweeter than bigger ones.
Some interesting relations were also observed between qualitative and quantitative conventional traits (Table 2.10). The multiparous inflorescence type (ITP) was generally associated to a higher number of flowers per inflorescence (NFI), a higher fruit weight (FWG) and a lower Brix level (BRIX) than the uniparous inflorescence. Moving from sparse to dense foliage density (FD), both the leaf width (LWI) and the leaf length/width ratio (LL/W) increased. Fruits with a heavy weight are characterized by an irregular shape at pistil scare (SPS), an indented shape at blossom end (SBE) and an irregular sectional shape; medium size fruits showed a stellate or linear SPS, a flat or pointed SBE and a round or