Studies on the Value of Cultural Heritage
22
IL CAPITALE CULTURALE
«Il capitale culturale», n. 22, 2020, pp. 369-393 ISSN 2039-2362 (online); DOI: 10.13138/2039-2362/2379
Managing visitors’ flows in
museums. The case of Firenze
Card*
* Authors express their gratitude to Roberto Dinelli, Alessia Rossi and Gabriele Alidori of the team of SILFI SPA for making the Firenze Card data available and to Bruno Bertaccini and Silvia Bacci of University of Florence for some previous elaborations on Firenze Card.
** Stefania Oliva, Research Fellow, University of Florence, Department of Economics and Management, via delle Pandette, 9, 50127 Florence, e-mail: [email protected].
*** Francesco Capone, Assistant Professor, University of Florence, Department of Economics and Management, via delle Pandette, 9, 50127 Florence, e-mail: [email protected].
**** Luciana Lazzeretti, Full Professor, University of Florence, Department of Economics and Management, via delle Pandette, 9, 50127 Florence, e-mail: [email protected].
***** Alessandra Petrucci, Full Professor, University of Florence, Department of Statistics, Computer Science, Applications “G. Parenti”, Viale Morgagni, 59, 50134 Florence, e-mail: [email protected].
Stefania Oliva
**, Francesco Capone
***,
Luciana Lazzeretti
****, Alessandra
Petrucci
*****Abstract
This article aims to enlarge the study of new technologies for monitoring visitors’ flows in cities of art. Based on data collected thanks to the use of the Firenze Card by city visitors, the article investigates the museums co-visits networks in Florence for understanding the visitors’ flows within the city, identifying the great attractors, the networks of minor museums, which museums receive or send more visitors to others. The analysis highlights the potential that such a study can develop in the future for optimizing the management of
tourist flows and improving the local cultural offer. The novelty of the dataset together with interesting results allows us to provide the policymakers with useful information about the principal nodes of attraction of tourists, which can be used to improve the cultural services, also through the suggestion of alternative paths.
Questo articolo si propone di ampliare lo studio delle nuove tecnologie per il monitoraggio dei flussi dei visitatori nelle città d’arte. Sulla base dei dati raccolti tramite l’utilizzo della Firenze Card da parte dei visitatori della città, l’articolo vuole analizzare le reti di co-visita dei musei di Firenze per comprendere i flussi dei visitatori, identificare i grandi attrattori, le reti dei musei minori e quali musei “ricevono/inviano” più visitatori rispetto agli altri. L’analisi evidenzia il contributo che studi di questo tipo possono apportare all’ottimizzazione della gestione dei flussi turistici, al fine di migliorare l’offerta culturale locale. La novità dei dati utilizzati e i risultati evidenziati dall’analisi contribuiscono a fornire ai policymakers informazioni utili sui principali nodi di attrazione turistica, cruciali per migliorare i servizi culturali, anche attraverso la proposta di percorsi alternativi.
1. Introduction
Over the last few years, museums have undergone numerous changes mostly related to the use of digital technologies and the digitization of their contents1.
Literature over the topic has rapidly increased and numerous studies have highlighted both the opportunities and the threats of the spread of Information and Communication Technologies (ICTs) in cultural organizations2.
Internet technologies have provided new tools for communicating cultural heritage. They have driven the expansion of the museums’ audience by providing innovative channels to interact and learn about their collections. Digital instruments have become a new and crucial factor for audience development and visitors’ engagement3. Gaming or digital learning have represented new forms
of conveying the cultural offer of museums through informal and interactive ways that stimulate the audience’s creativity and give visitors the possibility to participate in the contents’ creation4.
The cultural industries, in particular, thanks to new ICTs and digital technologies have been renewed and transformed into new creative industries5
able to renew and regenerate their offer6. Furthermore, the interaction between
cultural organizations and ICT companies has led to the development of innovation and cross-fertilization processes between different sectors in order to produce new forms of communication. An example is the use of augmented
1 Parry 2007; Lazzeretti, Sartori 2016. 2 Marty 2008; Marty, Jones 2008. 3 Parry 2007; Cerquetti 2016. 4 Solima 2018.
5 Lazzeretti 2013. 6 Cunningham 2002.
reality, virtual reality and other digital technologies to integrate and enlarge the experience of museums’ visitors7.
However, digital technologies can be useful not only to communicate the cultural offer of the museums through new channels or to propose new forms of interaction with the cultural heritage. Digital technologies, in fact, have encouraged cross-fertilization processes in the communication of museum activities. The effect has been twofold. On the one hand, museums have used multiple channels to communicate with visitors, contributing to stakeholder engagement and attracting potential visitors not reached by traditional channels. On the other hand, digital technologies have shed light on alternative tools for monitoring and reporting museums’ activities, emphasizing new forms of dialogic communication8.
A significant change due to digital technologies has regarded the online purchases and related availability of big data9. Indeed, they can represent an
opportunity for the collection and analysis of visitors’ flow data. For instance, the use of museums’ cards has allowed collecting a large number of data and developing interesting strategic implications at museums and local level. Museums’ cards may allow gathering information on a specific museums’ circuit through a single repository that can provide indications on the behaviors and preferences of the visitors10.
This paper aims to enlarge the study of new technologies for monitoring visitors’ flows in cities of art. It investigates the museums’ co-visits networks in Florence in order to understand the visitors’ flows within the city, identify the great attractors, the networks of minor museums, which museums receive or send more visitors to others. Our main research question is: what is the role of new technologies for managing visitors’ flows in cities of art?
For the purpose of this article, the analysis is developed following the Social Network Analysis (SNA) methodology. Several works have shown the potentiality of SNA for the tourism industry11, underlying that SNA can be a
useful tool to analyze connections and disentangle relationships in the cultural and tourism industry. Casanueva et al.12 have pointed out that an exciting
opportunity for tourism research becomes apparent with the use of SNA. There are, in fact, several works on the tourism literature adopting SNA13, such as
works on the management and governance of tourism destinations14 or the
concept of “destination image”15. 7 Jung et al. 2016.
8 Sibilio, Manetti 2014. 9 Li et al. 2018. 10 Bacci et al. 2019b.
11 Casanueva et al. 2016; Baggio, Baggio 2020. 12 Casanueva et al. 2016.
13 Benckendorff, Zehrer 2013; Ye et al. 2013; Capone 2016. 14 Beritellli et al. 2015.
The analysis has been based on data collected thanks to the use of the Firenze Card by the visitors of the city of Florence. Firenze Card is the pass of the municipality of Florence that offers the possibility to visit more than 80 museums and exhibitions all around Florence and its surrounding area in a period of three days. All the entrances in the museums by Firenze Card users are registered through digital devices so that a huge amount of data flows across museums and also the tourists’ behavior is stored.
The Firenze Card was launched in 2011 and since then the total number of cards sold has reached approximately 720k units. In this paper, we analyze the 127,092 cards sold in the year 2018, amounting to around 880k visits to local museums in the same year.
The novelty of the dataset together with a graphical social network analysis has allowed us to provide the policymakers with useful information about the principal nodes of attraction of tourists, which can be used to improve the tourist services, also through the suggestion of alternative paths.
The article is structured as follows. Section 2 discusses the literature concerning the crucial elements identified for the co-visit choice and clarifies how museums and city cards represent an innovative instrument for audience development and flow analysis. Section 3 sets up the research design, first with a context description of the Firenze Card, and second with an explanation of the methodology applied for studying it. Section 4 describes and discusses the results of the analysis. Finally, Section 5 draws some conclusions and gives insights for both policymakers of cultural sectors and the management of museums.
2. Literature review
Over the last few years, studies devoted to understanding the role of ICTs and digital technologies for the cultural sector have spread among researchers of different fields.
An emerging strand of the literature has focused on digital technologies, in particular social media, as instruments to interact with users and to engage stakeholders through new participative forms of communication16.
Social media have represented an opportunity for organizations to improve the quality of the shared information or receive feedback on the activities proposed. Moreover, they have allowed stakeholders to actively participate in the content generation17. Although in recent years these practices have been
applied to the context of Italian museums, their potential has not yet been fully
16 Bellucci et al. 2019. 17 Manetti, Bellucci 2016.
exploited except for merely communicative activities that give little emphasis to interactive and dialogical aspects18.
Another part of the literature has focused on the study of tourism destinations and digital technologies to understand the role of ICTs in monitoring preferences of tourists when they plan and choose certain sites more than others. An emerging strand of this literature has been interested in the study of new technological instruments as sources for a big amount of data on the visitors’ characteristics and preferences19.
From a theoretical point of view, some researches have tried to understand which factors influence the tourist visit. An example has been the work of Lew and McKercher20 that has analyzed the intra-destination movements and has
identified six dimensions that influence tourist itineraries inside a place. The first three dimensions have concerned the characteristics of the destination, such as accommodations location, attractions location and the accessibility to transportation. The other three have referred to the visitor’s characteristics, such as time and budget, motivation and composition, destination knowledge and emotional value. In a later work, Mckercher and Lau21 have modeled
tourist movements within a single local destination finding that it is mostly influenced by the visitors’ intentions prior to arrival, their willingness to engage the destination, length of stay and risk avoidance. Visitors’ choice may be influenced also by other factors such as the presence of children, the typology of tourist packages or even the presence of iconic attractions, considering that visiting an attraction increases the probability of visiting also other closer and less relevant attractions22.
Concerning empirical research, several analyses have attempted to measure visitors’ flows in tourist destinations through different methodologies. Edwards and Griffin23 have developed spatial research on tourists’ behaviors by tracking
their movement through GPS technology. According to the authors, this approach may be applied to cities in order to rethink their cultural offer and promote sustainable tourism24. Other studies have focused on user-generated
content (UGC) platforms, such as TripAdvisor for clustering tourists in different sites of the local destination25. These platforms may provide visitors with data
on the quality of tourism offers26. Finally, other studies have collected data
18 Fissi et al. 2019.
19 Marine-Roig, Clavé 2015; Raun et al. 2016; Miah et al. 2017. 20 Lew, McKercher 2006.
21 Mckercher, Lau 2008.
22 Padrón-Ávila, Hernández-Martín 2019. 23 Edwards, Griffin 2013.
24 Scuttari et al. 2013; Della Lucia, Franch 2017. 25 van der Zee et al. 2020.
from repositories of users’ online researches, such as Google Trends, to study tourists’ flow in a single locality27.
In the field of cultural heritage and museums, a part of the literature has dealt with the study of digital technologies in cities of art and museums’ clusters28.
The origins of this interest are highly related to the nature of museums as public institutions that pones questions about the rationalization of resources and the seeking of alternative forms of visitors’ engagement29. Digital technologies have
changed the relationship between heritage, visitors and museums. The museums of the digital era have become participatory spaces where visitors may interact with cultural heritage through different channels30.
Within this scenario, the study of visitors’ flows in museums has been crucial to understanding how they may improve their cultural offer, engage new publics and develop their audience. It has helped to predict how tourist flows can move and change in the future31. Furthermore, digital technologies
have contributed to the development of new methodologies for visitor data collection32. Recently, a field of interest has concerned the understanding of
how the use of museum cards can increase visitors’ flows by analyzing the choices of cultural consumption through the joint visit of one or more cultural attractions. A museum card is an admission pass to visit more competing museums or other tourist sites for one to more days. In some cases, the card also allows discounts from a number of restaurants or shops located in the area covered by the pass33. These tools may represent a solution for increasing visits
to less attractive sites, regulate the distribution of visitors among cultural places and limiting the carrying capacity of tourist destinations34. Moreover, they may
be considered as a best practice when the pass is not only a marketing tool but is part of a multi-level governance framework for implementing cultural policies and promoting local development35.
Exploring the literature on the topic, the evidence has suggested that the study of museum cards may be applied to several geographical dimensions, such as national, regional or urban36. Studying the Dutch museum pass, van der Werff
et al.37 have shown that visits increase of three times through the introduction
of the museums’ pass. Bertacchini et al.38 have applied their analysis to the
27 Rivera 2016.
28 Bertacchini, Morando 2013; Capone et al. 2016. 29 Gstraunthaler, Piber 2012; Sibilio, Manetti 2014. 30 D’Orazio 2017. 31 Padrón-Ávila, Hernández-Martín 2019. 32 Shoval, Isaacson 2007. 33 Ginsburgh, Zang 2001. 34 Zoltan, McKercher 2015. 35 Ferraro 2011.
36 Zoltan, McKercher 2015; Scuderi, Dalle Nogare 2018. 37 van der Werff et al. 2014.
study of the Piedmont regional museum card to understand the relationship between museums located within the city of Turin and those located in the surrounding areas. They have revealed specific characteristics for the users who visit out-of-town museums and a preference for the iconic museums sited in urban settings. Other studies have highlighted that city museum cards represent one of the tools for networking and cooperation in museum clusters adopting a “museum-driven” strategy of urban redevelopment39. In some cases, these
admission passes may also be international. The Musées du Rhin Supérieur Pass gives access to over 190 museums in France, Switzerland and Germany40.
From a methodological viewpoint, transactional data from museum cards have enriched emerging literature adopting a big data approach to tourism research41 and providing new insight into tourist behavior42. Moreover, while
tourist cards and other passes have been quite popular marketing tools in the tourism and cultural sector43, very little academic research has been realized
on museums’ cards and networks of co-visits. Few empirical works using transaction databases of visiting behavior have offered novel opportunities to accurately analyze tourists’ intra-destination movements44.
However, some criticisms have raised in finding the right assessment of the value generated by cards for museums and the methodology to measure the income of each museum involved in the initiative. This has been observed, in particular, in the cultural economics literature as “the museum pass problem”, how museums that join a card program may allocate the benefits of their collaboration45. Moreover, other issues may arise in choosing the
most appropriate time duration for the card. This, in turn, may depend on the geographical proximity of attractions and the segment of users for which the pass is intended. Some museum cards have an annual duration when intended for residents rather than tourists46.
Despite these controversies, museum cards may represent a precious source of data of visitors’ characteristics and their study is still under-researched. They may help researchers of cultural and tourism management to identify those factors that influence the itineraries of visitors within an area, provide policymakers with instruments to monitor tourist flows and support policies for a most sustainable and efficient “cultural-driven” territorial development.
39 Van Aalst, Boogaarts 2002. 40 Ginsburgh, Zang 2001. 41 Li et al. 2018.
42 Bertacchini et al. 2019.
43 Pechlaner, Abfalter 2005; Bertacchini et al. 2019. 44 Zoltan, McKercher 2015.
45 Casas-Mendez et al. 2014. 46 Ginsburgh, Zang 2001.
3. Research design
3.1 The Firenze Card
The analysis has focused on the case of Florence and the Firenze Card. Firenze is well known for its cultural and artistic heritage around the world and it is one of the main cities of art in Italy and the world47. In this context, the launch of
the Firenze Card in 2011 has offered good opportunities to investigate the use of digital tools for the fruition of museums in an important city of art. The data availability of the Firenze Card and the context of the city of art of Florence are then suitable for the aims of the study.
Firenze Card is the pass of the municipality of Florence (IT) that offers the possibility to visit more than 80 museums and exhibitions all around Florence48.
All the entrances in the museums by Firenze Card users are registered through digital devices so that a huge amount of data about flows across museums and behavior of tourists is stored.
The pass allows access to museums located in Florence and close areas for a period of 72 hours from the first entrance.
Visitors can only access the museums included in the circuit once. Museums, permanent and temporary exhibitions can be visited at no additional cost, booking included. Furthermore, it gives the possibility to access the dedicated online application. When the Firenze Card expires, the visitor has the option to extend the card for additional days adding a surcharge. The extension takes place online and allows free access to public transport and discounts from restaurants and other affiliated services. Furthermore, online cards give the possibility to access the dedicated online application.
All the entrances are counted and recorded thanks to optical RFID reading devices. The information recorded concerns the number of museums that each holder visited, the path followed by the visitor, date and time of the entry. The cards also provide online information on gender, age, citizenship and family composition49. Moreover, after using the card, the online version administers a
questionnaire to collect data on the quality of the visit.
Since the launch of the Firenze Card in 2011, 720,000 cards have been sold. Among these, a number of 127,092 cards have been sold in 2018 (+4% of 2017). The number of museums visited per each card has an average of about 7.
This contribution focuses on the data collected by the cards sold in 2018. These represent a total of 884,389 visits to the museums of the Firenze Card circuit. Some monuments are free, others have more than one access point, for
47 Lazzeretti 2004.
48 For details look at <http://firenzecard.it>, 03.08.2020.
others no entrance has been recorded. For these reasons, the final number of museums and monuments visited in 2018 is 43.
The age of the users of the pass ranges between 25-44 years (60%) and 45-65 years (40%). The average age is 44 years. Concerning the geographical origin of visitors, the collected data shows that 48.8% are Europeans (12% from France and 11% from Italy), 37.5% come from North America, while only 8.5% are Asians.
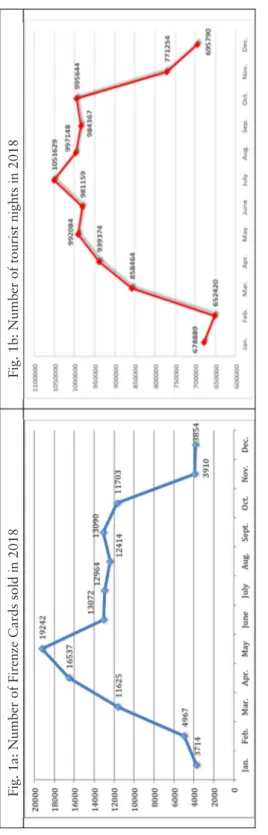
Figure 1 presents a comparison between the number of Firenze Cards sold (1a) with the number of tourism nights spent in the months of 2018 (1b). The evolution of the Firenze Cards is very similar to the one of tourist nights spent in the city with an increase starting in March and April and with high values until September-October, underlining the classical evolution of cultural tourism with peaks in Spring50. Firenze Card reaches a peak in April and May (respectively
16k and 19k cards sold), typical best months from Florence cultural tourism. From this point of view, the Firenze Card can be seen as a good proxy of the tourism phenomenon in Florence.
In order to analyze the co-visits in the museums of Florence, the Social Network Analysis (SNA) has been used to present the co-visits networks of 2018. The uni-partite (one-mode) visitor-museum matrix (where, in each row, a purchaser of the Firenze Card goes to visits one or more museums in the city represented in the columns) can be transformed into a bi-partite (two-mode) (co-visits) museum-museum matrix, where the link between two museums indicates the co-visit of one or more visitors51.
In the next section, the co-visits network will be analyzed in order to identify the most important museums, the most consistent flows of tourists and which museums receive or send more visitors to others.
4. Empirical Analysis
4.1 General background
In relation to the collected data by the Firenze Cards sold in 2018, it is possible to count a number or 127,092 sold cards. These represent 884,389 visits carried out in 40 different museums.
Each card counts a number of entrances that ranges between 1 and 31 and has a mean of 6.8 (median 6.0) and standard deviation 3.2. Analyzing data, these show that 25% of holders has visited at most 4 museums, while 75% of
50 Smiths, Richard 2013. 51 Scott 2011.
Fig. 1. A comparison among Firenze Cards sold and tourism nights spent in 2018 (
Source
: our elaboration on Bacci
et al.
2019a
and Florence Metropolitan City)
Fig. 1a: Number of Firenze Cards sold in 2018
visits concerns at most 9 museums. Unfortunately, we do not have information on the period spent on visits. As said, with a small surcharge, the card can be extended to more than 3 days.
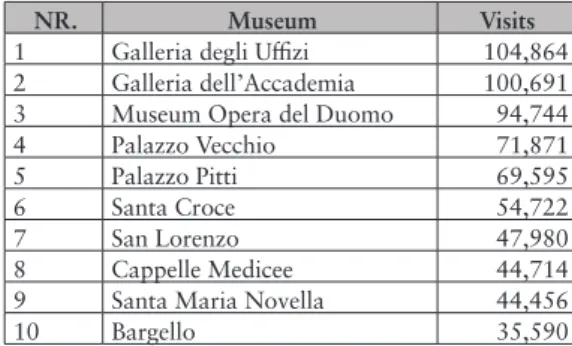
Table 1 presents the Firenze Card visits per museum in 2018. It is possible to observe that Galleria degli Uffizi (11.9% of visits in 2018), Galleria dell’Accademia (11.4%), and Opera del Duomo (10.7%) are the three most
visited museums of the circuit, with namely 11.9%, 11.4% and 10.7% of recorded visits in 2018. The table shows the main museums in Florence register around 50% of total visits to the city. This underlines the concentration of visitors in a few museums indicating also that the other 75 museums share the remaining 50% of visitors. In fact, cultural tourism in Florence is mainly concentrated in a few big museums as in other important cities of art in Italy52.
NR. Museum Visits
1 Galleria degli Uffizi 104,864
2 Galleria dell’Accademia 100,691
3 Museum Opera del Duomo 94,744
4 Palazzo Vecchio 71,871
5 Palazzo Pitti 69,595
6 Santa Croce 54,722
7 San Lorenzo 47,980
8 Cappelle Medicee 44,714
9 Santa Maria Novella 44,456
10 Bargello 35,590
Tab. 1. Most visited museums with Firenze Card in 2018 (Source: our elaboration
from Bacci et al. 2019a)
4.2 A social network analysis
Graph 1 presents the networks of museums of co-visits in 2018. The 40 museums visited with the Firenze Card define the nodes of a directed network whose edges (ties) represent the paths observed across museums. The amount of tourists that follow a certain path provides the weight of each edge. Notwithstanding that the graph is difficult to read, it shows the complexity and a large number of “micro” connections in the museums’ network.
Looking at the increasing ordered distribution of the weighted edges, we observe that edges in the superior 10% account for the 79% of flows between pairs of nodes and those in the superior 25% account for 94% of flows, confirming the concentration of visits in few museums. Among these museums, there are the paths across Galleria degli Uffizi, Opera del Duomo
Graph 1. The co-visits museum networks (Source: our elaboration)
(OPA), Galleria dell’Accademia, Palazzo Vecchio, and Pitti Boboli (along any
direction), followed by Basilica di San Lorenzo and Cappelle Medicee.
It is possible then to analyze some measures of SNA. A first index is the
density, that is the ratio between a network observed ties and potential ties
(if each network is fully connected). Transitivity provides the proportion of
two-stars that close in triangles. Reciprocity is the ratio between mutual dyads
and the total number of dyads (in other words, when two nodes are mutually connected, they are transitive). All these measures vary from 0 to 1.
The analyzed network is highly dense (0.849) and transitive (0.953). In fact, flows of tourists tend to move in a bidirectional way between museums as outlined by the reciprocity coefficient (0.905), and the share of complete triads (i.e. triples of nodes linked with bidirectional edges) that amounts to 62.7%.
It is then possible to reduce graph 1, limiting the number of museums with at least 1,000 co-visits. Graph 2 presents the network of co-visitors (at least 1,000 co-visits in each couple of museums) with the in/out degree.
Graph 2. The network of co-visitors (at least 1000 co-visits): in/out degree (
Source
: our elaboration)
Graph 2b: Outdegree
Graph 2a presents museums sized with in-degree, i.e. the number of the received flow of visitors, while graph 2b represents museums sized with of out-degree, i.e. the flow of sending visitors to other museums53.
Graph 2 represents 15 museums that have at least 1,000 co-visits in the network, highlighting the network of main museums in the city. The most important museums are those already identified in the previous analysis; however, graph 2 allows to graphically illustrate a different sender and receiver behavior of the museums’ co-visits network.
Whether in the first graph (2a in-degree), the size of a node (i.e. museum) is larger than in the second figure (2b out-degree), then it means that many co-visits leave from that museum and it could be considered as the main attraction from which depart to visit other attractions.
In fact, it is possible to grasp the museums that are the main attractions of Florence, i.e. the largest nodes in graph 2b (outdegree) such as the Galleria dell’Accademia and Galleria degli Uffizi. These are the museums that have a
larger size in the graph 2b, showing the first two museums that tourists usually visit in Florence. Then, these museums have important outgoing flows and visitors move from these attractions to museums such as Santa Croce, OPA
and Cappelle Medicee. In fact, these last museums show a negative balance
of incoming/outgoing visitors, having a greater size in Indegree (2a) than Outdegree (2b). In fact, they receive more visitors’ flows than they send to others. Marketing and policy actions could be planned considering this direction of the visitors’ flows in the local museums.
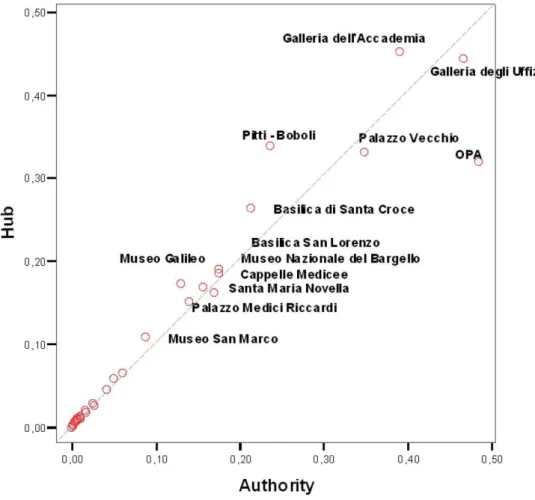
In order to highlight this phenomenon, two common measures can be applied to assess the importance of each node in terms of its capability of building incoming and outgoing links such as the authority and hub scores. The authority score defines the importance of a node by how many nodes point to
it, whereas the hub score defines the importance of a node by how many nodes
it points to.
Figure 2 displays the authority and hub scores computed for the 40 Florentine museums. We observe that many museums have low scores on both the dimensions (range 0.00-0.20) and a small sub-set of museums have intermediate scores (around 0.40). Only a few museums present high values (> 0:70) of authority and hub scores: Galleria degli Uffizi (authority = 0.979;
hub = 0.964), Galleria dell’Accademia (authority = 0.808; hub = 1.000), Opera del Duomo (authority = 1.000; hub = 0.708), and Palazzo Vecchio (authority
= 0.720; hub = 0.732); Pitti – Boboli and Basilica di Santa Croce follow with
medium-high scores.
Finally, the last part of this analysis concerns the possibility of building ego networks to analyze the sub-networks of some specific museums. An
ego-53 In this sense, Firenze Card reports an order of the museums visited going from the first
network is a network constituted by a focal node (“ego”), the nodes to which it is directly connected (called “alter”) and the bonds, if any, between the ego and alter. These networks are also known as personal networks or ego-centric networks54. Ego-network can be obtained by extracting a sub-network from a
full network and allows us to focus on the relationships of a single node instead of an entire network.
In Graph 3 some ego-networks of the main museums of Florence are presented. The ego-network of the most important museums is very similar to the main one (for example Uffizi and Palazzo Pitti ego-networks) (3b and 3d).
This analysis, on the other hand, is interesting for less important museums or for small museums. We can take for example one important museum, but not
54 Everett, Borgatti 2005.
in the very first position for visitors. The sub-network of the Bargello Museum
(3a) highlights where the main movements of visitors come from and how the co-visits network is made up. The network is made up of 5 nodes (beyond the ego) and highlights, for example, where this museum could carry out targeted communication strategies since at the moment visitors mainly come from the main circuit of museums in Florence.
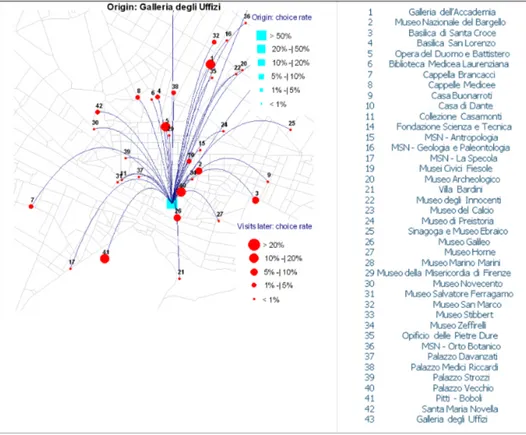
Finally, it is also possible to geo-localize the flows of tourists in the territory and to map the ego-network of a museum within the city. In figure 3, for example, the ego-network of the Uffizi Gallery is presented with the outgoing
flows of visitors. As said, this museum is one of the main attractors of the city and from there departs all the visitors’ flows to visit the other museums. This kind of analysis can be useful to policymakers and urban planners because it can allow better management of parts of the city that are overcrowded or improve public transports for peripheral attractions penalized by geographical distance.
Graph 3. Some ego-networks (Source: our elaboration)
Graph 3a: The ego-network of Bargello Graph 3b: The ego-network of Uffizi
5. Conclusions
This paper has aimed to enlarge the study of new technologies for monitoring visitors’ flows in cities of art. Based on the data collected by the Firenze Card, the proposed study has investigated the museums’ co-visits networks in Florence for understanding the visitors’ flows within the city, finding the great attractors, describing the networks of minor museums and which museums receive or send more visitors to others.
As highlighted above, the cluster of museums in Florence has some great attractors which are Uffizi, Galleria dell’Accademia and OPA. The analysis
of the ego-networks shows the constant presence of these attractors in the networks of the observed museums. This suggests that, in general, the Firenze Card holders organize their tourist path within the city by visiting those great attractors and choosing some minor museums. It confirms that the presence of
relevant attractions counts for the choice of a destination and may influence visiting also other closer and minor sites55.
Furthermore, the study of the ego-networks of minor museums can give minor museums an indication of the network they are part of and suggest reflections on which visitors’ engagement strategy may be planned to be more attractive. A deeper knowledge of the specific museums that constitute minor museums’ networks may increase collaboration between institutions and lead towards joint initiatives. Furthermore, it can provide indications on what actions could be necessary to extend and manage the tourist flows of the great attractors who remain however a constant part of the visit routines in the cities of art.
A second reflection regards the geographical position of the museums that count the most co-visits within the Florence co-visit network. These are mainly museums located in the city center. This, on the one hand, depends on the geographical setting of the attractions in the city of Florence, many of which are geographically close and located in the historical center. However, on the other hand, it can also confirm that an efficient transport system can be crucial in the choice of intra-destination movements, as highlighted in the literature56.
This can help policymakers to reflect on the importance of supporting cultural institutions with efficient infrastructures, such a public transport able to reach peripheral attractions penalized by geographical distance.
Third, helpful insights may come from analyzing visitors’ data. These, first, highlight that the average age of the holders of the Firenze Card is 44 years old and they are from 25 years old to upwards. Therefore, it emerges that the buyers of the Florence Card are mostly adults and the youngers, 18-25 years old, are absent. This trend is in line with other studies on museums in Florence that highlight the difficulty for Florentine museums to engage younger visitors and pone questions to the managers of museums on rethinking their cultural offer and develop innovative instruments to make visits more attractive57.
Moreover, the data show that, in the case of the standard Firenze Card, the duration is 72 hours. Over this period, 75% of people visit at most 9 museums, while the average of the visited museum is around 7. This means that around 2.3 museums are visited per day. This indication can be useful for policymakers and museum management in order to understand how the use of the Firenze Card can affect the duration and quality of the visit. This requires reflecting on the objectives of museums and local institutions regarding the development of the cultural sector, to establish priorities in terms of economics, cultural, environmental or social aspects.
In general, the proposed study confirms that new technologies can provide tools for the collection and monitoring of visitors’ flows through innovative
55 Padrón-Ávila, Hernández-Martín 2019. 56 Lew, McKercher 2006.
methodologies. This is the case of museum cards and the study of co-visit itineraries. Usually, tourist cards are studied as useful marketing tools for the profiling of users in support of policies aimed at increasing tourist flows, through a “user-driven” approach58. In our case, we have studied museum cards
and co-visit networks through a “museum-driven” vision. This perspective underlines how digital technologies are crucial tools to provide indications for the resolution of problems related to the congestion of tourist flows, to identify the weak nodes of the museum networks, in order to promote a more sustainable cultural offer59. In light of the increase in the importance of
sustainable tourism, museum cards offer a tool for monitoring tourist flows in congested cities of art. The study of the co-visit network can provide useful tools to address the problems related to the carrying capacity of the cities of art, developing alternative itineraries and spreading the tourist flows between the most important museums and the smaller ones.
In this regard, policymakers should rethink urban mobility and suggest alternative solutions to encourage visits to peripheral museums. These can be represented by investments in sustainable mobility, such as discounts for the use of bike-sharing or free bikes for reaching peripherical sites to being part of the advantages of city museums passes. In addition, they should promote alternative tourist routes in order to enhance other aspects of the local cultural heritage, related to nature sites or food and wine tourism. This may enlarge collaborations with actors of tourism sectors through discounts in restaurants and hotels that encourage the visitor to cross the borders of the city center.
The article represents a first attempt to discuss museum cards in the context of new technologies and the monitoring of tourist flows. However, the analysis presents also some limitations. A first limitation is related to the selection of Florence as the case study. A benchmarking study with other cities and museum cards could enlarge the knowledge developed in this article and opens interesting research opportunities. A second limit is related to the limited access to the dataset of the Firenze Card. In fact, due to privacy reasons, the access to the comprehensive dataset of the Firenze Card was restricted and this partly limited the empirical analysis of this work. However, future research may involve a specific type of visitors to make in-depth consumers’ profiling and identify which features drive the choice of cards’ holders. Furthermore, through the analysis of the ego-network of specific museums, it could be possible to study the visitors’ flows into and out of the visits network to trace a path of co-visits and understand the factors that influence the choice of one destination rather than another. Moreover, the analysis of the use of online applications and the exploration of the data collected through satisfaction questionnaires may
58 Pechlaner, Abfalter 2005; Bertacchini et al. 2019. 59 Scuttari et al. 2013; Della Lucia, Franch 2017.
give insights on how new technologies may improve stakeholder engagement and dialogue with visitors60.
Despite these limitations, studies of this kind can provide both new methodologies for investigating tourist flows and more precise indications for leading museum management and policymakers towards more sustainable management of cities of art. Moreover, the global health emergency of Covid-19 and the sudden changes in tourism flows have shed light on the importance of digital technologies for museums and cities of art. The current state of emergency and future scenarios require rethinking the role of technology for the management of tourism flows and the visits to cultural sites. Thus, monitoring tourist flows becomes even more important than before, considering a scenario where numbers of visitors should be reduced in order to ensure safety. As a recent report61 on post-Covid-19 touristic policies underlines, a challenge for
the future of the tourism sector is to innovate and restructure the whole tourism industry. In this context, new technologies play a crucial role. The emergency should represent an opportunity for a transition toward new forms of sustainable tourism. However, this requires to implement multilevel governance for the management of destinations and requires to seriously consider technological transfer and entrepreneurship in the tourism sector.
References / Riferimenti bibliografici
Bacci S., Bertaccini B., Dinelli R., Giusti A., Petrucci A. (2019a), A network analysis of museum preferences: the Firenzecard experience, in Smart Statistics for Smart Applications, Book of Short Papers SIS 2019 (Milan,
Italy, June 18-21, 2019), edited by G. Arbia, S. Peluso, A. Pini, G. Rivellini, Torino: Pearson, pp. 653-658, <https://it.pearson.com/content/dam/region- core/italy/pearson-italy/pdf/Dirigenti%20e%20istituzioni/ISTITUZIONI-HE-PDF-sis2019_V4.pdf>, 03.08.2020.
Bacci S., Bertaccini B., Petrucci A. (2019b), Museum preferences analysis: an item response model applied to network data, in Statistics for Health and Well-being, Book of Short Papers of the ASA Conference 2019 (Brescia,
Italy, September 25-27, 2019), edited by M. Carpita, L. Fabbris, Brescia: CLEUP, pp. 21-24.
Baggio J.A., Baggio R. (2020), Modelling and Simulations for Tourism and Hospitality: An Introduction, Bristol: Channel View Publications, <https://
doi.org/10.21832/9781845417437>.
60 Bellucci et al. 2019; Bellucci et al. forthcoming. 61 Bellini et al. 2020.
Bellini N., Campostrini S., Pasquinelli C., Trunfio M. (2020), “Ripartenza” o “rinascimento”? Le politiche del turismo oltre l’emergenza, «Vision – The
Post Covid Series», <https://www.thinktank.vision/images/2020/Paper_ Turismo.pdf>, 03.08.2020.
Bellucci M., Biagi S., Manetti G. (2019), Dialogic accounting and stakeholder engagement through social media: the case of top-ranked Universities,
«The Review of Higher Education», 42, n. 3, pp. 1145-1184, <https://doi. org/10.1353/rhe.2019.0032>.
Bellucci M., Manetti G., Sibilio B. (forthcoming), Dalla rendicontazione alla comunicazione dialogica: il caso delle fabbricerie italiane, in I musei Ecclesiastici. Proposte di valorizzazione, a cura di B. Sibilio, A. Matacena,
Milano: Franco Angeli.
Benckendorff P., Zehrer A. (2013), A network analysis of tourism research,
«Annals of Tourism Research», 43, n. 10, pp. 121-49, <https://doi. org/10.1016/j.annals.2013.04.005>.
Beritelli P., Buffa F., Martini U. (2015), The coordinating DMO or coordinators in the DMO?–an alternative perspective with the help of network analysis,
«Tourism Review», 70, n. 1, pp. 24-42, <https://doi.org/10.1108/TR-04-2014-0018>.
Bertacchini E., Morando F. (2013), The Future of Museums in the Digital Age: New Models of Access and Use of Digital Collections, «International
Journal of Arts Management», 15, n. 2, pp. 60-72.
Bertacchini E., Nuccio M., Durio A. (2019), Proximity tourism and cultural amenities: Evidence from a regional museum card, «Tourism Economics»,
November, <https://doi.org/10.1177/1354816619890230>.
Capone F. (2016), Tourist Clusters, Destinations and Competitiveness, London:
Routledge, <https://doi.org/10.4324/9781315709536>.
Capone F., Sartori A., Lazzeretti L. (2016), Small firms and the digitization of cultural heritage. The case of Centrica and the Uffizi Gallery, in Proceeding of the Sinergie Annual Italian Management Conference (Udine, Italy, 9-10
June 2016), pp. 535-547.
Casanueva C., Gallego Á., García-Sánchez M.R. (2016), Social network analysis in tourism, «Current Issues in Tourism», 19, n. 12, pp. 1190-1209,
<https://doi.org/10.1080/13683500.2014.990422>.
Casas-Mendez B., Fragnelli V., Garcìa-Jurado I. (2014), A survey of allocation rules for the museum pass problem, «Journal of Cultural Economics», 38, n.
2, pp. 191-205, <https://doi.org/10.1007/s10824-013-9202-1>.
Cerquetti M. (2016), More is better! Current issues and challenges for museum audience development: A literature review, «Journal of Cultural Management
& Policy», 6, n. 1, pp. 30-43.
Cunningham S. (2002), From cultural to creative industries: theory, industry and policy implications, «Media International Australia incorporating
Culture and Policy», 102, n. 1, pp. 54-65, <https://doi.org/10.1177/132987 8X0210200107>.
D’Orazio S. (2017), Museo reale e museo digitale: il caso del Museo Archeologico Regionale “A. Salinas” un anno dopo la riapertura, «IL CAPITALE
CULTURALE. Studies on the Value of Cultural Heritage», n. 16, pp.
399-419, <https://doi.org/10.13138/2039-2362/1647>.
Della Lucia M., Franch M. (2017), The effects of local context on World Heritage Site management: the Dolomites Natural World Heritage Site, Italy, «Journal of Sustainable Tourism», 25, n. 12, pp. 1756-1775, <https://
doi.org/10.1080/09669582.2017.1316727>.
Edwards D., Griffin T. (2013), Understanding tourists’ spatial behaviour: GPS tracking as an aid to sustainable destination management, «Journal of
Sustainable Tourism», 21, n. 4, pp. 580-595, <https://doi.org/10.1080/096 69582.2013.776063>.
Everett M., Borgatti S.P. (2005), Ego network betweenness, «Social Networks»,
27, n. 1, pp. 31-38, <https://doi.org/10.1016/j.socnet.2004.11.007>.
Ferraro V. (2011), Restyling museum role and activities: European best practices towards a new strategic fit, «IL CAPITALE CULTURALE. Studies on the value of Cultural Heritage», n. 2, pp. 133-177.
Fissi S., Gori E., Romolini A., Contri M. (2019), Stakeholder engagement: verso un utilizzo dei Social Media nei musei italiani?, «Management Control», n.
1, pp. 145-160, <https://doi.org/10.3280/MACO2019-SU1008>.
Ganzaroli A., De Noni I., van Baalen P. (2017), Vicious advice: Analyzing the impact of TripAdvisor on the quality of restaurants as part of the cultural heritage of Venice, «Tourism Management», n. 61, pp. 501-510, <https://
doi.org/10.1016/j.tourman.2017.03.019>.
Ginsburgh V., Zang I. (2001), Sharing the Income of a Museum Pass Program,
«Museum management and curatorship», 19, n. 4, pp. 371-383, <https:// doi.org/10.1080/09647770100501904>.
Gstraunthaler T., Piber M. (2012), The Performance of Museums and Other Cultural Institutions, «International Studies of Management and
Organization», 42, n. 2, pp. 29-42, <https://doi.org/10.2753/IMO0020-8825420202>.
Jung T., tom Dieck M.C., Lee H., Chung N. (2016), Effects of virtual reality and augmented reality on visitor experiences in museum, in Information and communication technologies in tourism 2016, edited by A. Inversini, R.
Schegg, Cham: Springer, pp. 621-635, <https://doi.org/10.1007/978-3-319-28231-2_45>.
Lazzeretti L. (2004), Art Cities, Cultural Districts and Museums, Firenze:
Firenze University Press, <https://doi.org/10.26530/OAPEN_356366>. Lazzeretti L. (2013), Creative Industries and Innovation in Europe. Concepts,
Measures and Comparative Case Studies, London: Routledge, <https://doi.
Lazzeretti L., Sartori A. (2016), Digitisation of Cultural Heritage and Business Model Innovation: The Case of the Uffizi Gallery in Florence, «IL CAPITALE
CULTURALE. Studies on the Value of Cultural Heritage», n. 14, pp.
945-970, <http://dx.doi.org/10.13138/2039-2362/1436>.
Lew A., McKercher B. (2006), Modeling Tourist Movements: A Local Destination Analysis, «Annals of tourism research», 33, n. 2, pp. 403-423,
<https://doi.org/10.1016/j.annals.2005.12.002>.
Li J., Xu L., Tang L., Li L. (2018), Big data in tourism research: a literature review, «Tourism Management», n. 68, pp. 301-323, <https://doi.
org/10.1016/j.tourman.2018.03.009>.
Manetti G., Bellucci M. (2016), The use of social media for engaging stakeholders in sustainability reporting, Accounting, «Auditing, Auditing &
Accountability Journal», 29, n. 6, pp. 985-1011, <https://doi.org/10.1108/ AAAJ-08-2014-1797>.
Marine-Roig E., Clavé S.A. (2015), Tourism analytics with massive user-generated content: A case study of Barcelona, «Journal of Destination
Marketing & Management», 4, n. 3, pp. 162-172, <https://doi.org/10.1016/j. jdmm.2015.06.004>.
Marty P.F. (2008), Museum websites and museum visitors: digital museum resources and their use, «Museum Management and Curatorship», 23, n. 1,
pp. 81-99, <https://doi.org/10.1080/09647770701865410>.
Marty P.F., Jones K.B. (2008), Museum informatics: People, information, and technology in museums, London-New York: Routledge.
Mckercher B., Lau G. (2008), Movement Patterns of Tourists within a Destination, «Tourism Geographies», 10, n. 3, pp. 355-374, <https://doi.or
g/10.1080/14616680802236352>.
Miah S.J., Vu H.Q., Gammack J., McGrath M. (2017), A Big Data Analytics Method for Tourist Behaviour Analysis, «Information & Management», 54,
n. 6, pp. 771-785, <https://doi.org/10.1016/j.im.2016.11.011>.
Oliva S., Lazzeretti L. (2020), Natural history museums: the role of education for humanistic tourism, in Humanistic Tourism: Values, Norms and Dignity,
edited by E. Guidici, M. Della Lucia, London: Routledge.
Padrón-Ávila H., Hernández-Martín R. (2019), Why do tourists differ in their likelihood to visit attractions? The case of Lanzarote, «International Journal
of Tourism Research», 21, n. 6, pp. 790-800, <https://doi.org/10.1002/ jtr.2305>.
Parry R. (2007), Recoding the Museum: Digital Heritage and the Technologies of Change, London: Routledge, <https://doi.org/10.4324/9780203347485>.
Pechlaner H., Abfalter D. (2005), Cultural tourism packages: the role of smart cards in the Alps, «International Cultural Tourism: Management,
Implications and Cases», edited by M. Sigala, D. Leslie, Oxford: Elsevier Butterworth Heinemann, pp. 40-50, <https://doi.org/10.1016/B978-0-7506-6312-0.50007-8>.
Raun J., Ahas R., Tiru M. (2016), Measuring tourism destinations using mobile tracking data, «Tourism Management», n. 57, pp. 202-212, <https://doi.
org/10.1016/j.tourman.2016.06.006>.
Rivera R. (2016), A dynamic linear model to forecast hotel registrations in Puerto Rico using Google Trends data, «Tourism Management», n. 57, pp.
12-20, <https://doi.org/10.1016/j.tourman.2016.04.008>. Scott J. (2011), Social Network Analysis, London: Sage.
Scuderi R., Dalle Nogare C. (2018), Mapping tourist consumption behaviour from destination card data: what do sequences of activities reveal?,
«International Journal of Tourism Research», 20, n. 5, pp. 554-565, <https:// doi.org/10.1002/jtr.2205>.
Scuttari A., Della Lucia M.D., Martini U. (2013), Integrated planning for sustainable tourism and mobility. A tourism traffic analysis in Italy’s South Tyrol region, «Journal of Sustainable Tourism», 21, n. 4, pp. 614-637,
<https://doi.org/10.1080/09669582.2013.786083>.
Shoval N., Isaacson M. (2007), Tracking tourists in the digital age, «Annals
of Tourism Research», 34, n. 1, pp. 141-159, <https://doi.org/10.1016/j. annals.2006.07.007>.
Sibilio B., Manetti G. (2014), Il dialogo fra musei e stakeholders tramite Internet: il caso delle Soprintendenze Speciali per il patrimonio storico, artistico ed etnoantropologico e per i Poli museali, «IL CAPITALE CULTURALE. Studies on the Value of Cultural Heritage», n. 9, pp. 123-153.
Smith M., Richards G. (2013), The Routledge Handbook of Cultural Tourism,
London: Routledge, <https://doi.org/10.4324/9780203120958>.
Solima L. (2018), Il gaming per i musei. L’esperienza del MANN, «Economia
della Cultura», 28, n. 3, pp. 275-290.
Stepchenkova S., Mills J. (2010), Destination Image: A Meta-Analysis of 2000-2007 Research, «Journal of Hospitality Marketing & Management», 19, n.
6, pp. 575-609, <https://doi.org/10.1080/19368623.2010.493071>.
Van Aalst I., Boogaarts I. (2002), From Museum to Mass Entertainment: The Evolution of the Role of Museums in Cities, «European urban and regional
studies», 9, n. 3, pp. 195-209, <https://doi.org/10.1177/096977640200900 301>.
van der Werff S., Koopmans C., Boyer C. (2014), The effects of the Dutch museum pass on museum visits and museum revenues, «SEO Discussion
Paper», n. 79, Amsterdam: SEO Economisch Onderzoek.
van der Zee E., Bertocchi D., Vanneste D. (2020), Distribution of tourists within urban heritage destinations: a hot spot/cold spot analysis of TripAdvisor data as support for destination management, «Current Issues in Tourism»,
23, n. 2, pp. 175-196, <https://doi.org/10.1080/13683500.2018.1491955>. Ye Q., Li T., Law R. (2013), A Coauthorship Network Analysis of
Hospitality & Tourism Research», 37, n. 1, pp. 51-76, <https://doi. org/10.1177/1096348011425500>.
Zoltan J., McKercher B. (2015), Analysing intra-destination movements and activity participation of tourists through destination card consumption,
«Tourism Geographies», 17, n. 1, pp. 19-35, <https://doi.org/10.1080/1461 6688.2014.927523>.
eum edizioni università di macerata
Department of Education, Cultural Heritage and Tourism
University of Macerata
Direttore / Editor in-chief Pietro Petraroia
Co-direttori / Co-editors
Tommy D. Andersson, University of Gothenburg, Svezia Elio Borgonovi, Università Bocconi di Milano
Rosanna Cioffi, Seconda Università di Napoli Stefano Della Torre, Politecnico di Milano
Michela di Macco, Università di Roma “La Sapienza” Daniele Manacorda, Università degli Studi di Roma Tre Serge Noiret, European University Institute
Tonino Pencarelli, Università di Urbino "Carlo Bo"
Angelo R. Pupino, Università degli Studi di Napoli L'Orientale Girolamo Sciullo, Università di Bologna
Texts by
Giuliana Altea, Francesco Bartolini, Elisa Bernard, Giuseppe Buonaccorso, Francesco Capone, Giuseppe Capriotti, Eliana Carrara, Mirco Carrattieri, Mara Cerquetti, Michele Dantini, Pierluigi Feliciati, Angela Maria La Delfa,
Rita Pamela Ladogana, Luciana Lazzeretti, Sonia Merli, Enrico Nicosia, Silvia Notarfonso, Stefania Oliva, Caterina Paparello, Claudio Pavone, Sabina Pavone, Pietro Petraroia, Alessandra Petrucci, Francesco Rocchetti, Daniele Sacco, Gaia Salvatori