Age Structure, Income Distribution and Economic Growth
36
0
0
Testo completo
(2) All rights reserved. No part of this paper may be reproduced in any form without permission of the authors.. © 2002 Rafael Gómez and David K. Foot Printed in Italy in May 2002 European University Institute Badia Fiesolana I – 50016 San Domenico (FI) Italy. RSC 2002/36 © 2002 Rafael Gómez and David K. Foot.
(3) ABSTRACT* A recent body of empirical cross-country research has confirmed that income equality is positively related to economic growth. This paper provides an explanatory channel for this observed relationship. The novelty of its approach consists in the use of demographic channels to account for cross-country differentials in economic growth and income distribution. The paper builds upon three empirical regularities that have emerged in the recent growth literature. The first, is that when one controls for such factors as initial level of GDP per capita and education, income inequality is negatively related to long run growth. Second, income distribution is affected by age structure, with a younger working age population positively related to income inequality. Finally, age structure also plays upon the level of economic growth independent of its role through income distribution. In this paper we argue that these associations cannot be confirmed solely via the use of cross-country growth regressions. In order to determine the direction of causation one has to formalise the economic mechanisms that account for the empirical results. In our overview of the theory we analyse four models that have emerged as the most plausible transmission mechanisms linking inequality to slower growth. In each instance we demonstrate how a consideration of demographic age structure can compliment the four mainstream accounts Keywords: inequality, growth, demographics, redistribution JEL Classification: D72, D74, O15, P16. *. Paper presented at the Canadian Economics Association Meetings, McGill University, Montreal, June 2001. The authors would like to thank those who discussed and commented on the ideas contained in this paper, in particular colleagues that participated in the November, 2000 pre-conference seminar in Montreal and the official conference in Ottawa on January 27th 2001. Both events were sponsored by the IRPP-CSLS project on the linkages between economic growth and income inequality. In particular we thank Tim Sargent for valuable comments. Latest Version: May 2001.
(4)
(5) 1. INTRODUCTION. One of the more challenging goals in macroeconomics is to explain the variation in economic growth that one observes across countries over the same period of time. In this regard, Solow’s (1956) neo-classical growth model and its prediction of absolute convergence has served economists well. Absolute convergence refers to the proposition that regardless of initial conditions, all economies approach the same steady state level of income and growth per person. Despite its powerful intuitive appeal, the Solow model has a problem. When it is estimated via the use of cross-country regressions, it performs rather poorly (Mankiw, 1995). As a result of its empirical failure economists have abandoned their belief in absolute convergence and today most adhere to a less restrictive proposition termed conditional convergence. Conditional convergence makes two alternative predictions regarding income and economic performance. First, depending on initial conditions such as individual rates of saving and population growth, countries will reach different steady state levels of income per person. Second, depending on any initial deviation from their own steady state, countries will display differing rates of economic growth. These predictions are in accordance with what is generally observed in cross-country empirical work. Over the past decade attempts have been made to link differences in initial conditions with subsequent variations in economic growth. Typically the empirical papers estimate regressions on samples of 50 to 100 countries where the dependent variable, in most cases, is each country’s average growth rate of income per capita. On the right-hand side, a host of independent variables measured at the starting point of the growth period attempt to account for observed differences in subsequent rates of economic performance. Summarising the results of this literature has proved to be a rather daunting task (Temple, 1999; Lloyd-Ellis 2001). For our purposes, however, only one finding is worth noting: when factors such as the initial level of income and human capital are held constant, countries with more egalitarian distributions of income tend to grow faster than otherwise similar counterparts. Empirically, this finding has been independently confirmed in several recent studies (Aghion et al, 1999).1. 1. One dissenting voice has been Forbes (2000), who has recently criticised these crosscountry results using a new data set. A more subtle result is provided by Barro (1999) who finds that the negative effect of inequality on growth is significant for poorer countries but vanishes above a certain GDP per capita threshold..
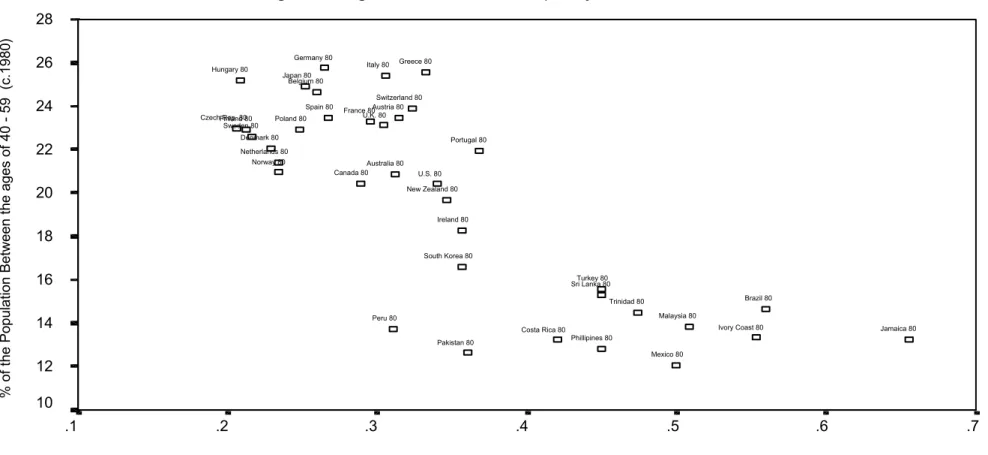
(6) Stemming from the observation that income inequality and growth are inversely related, the modern literature has sought to provide explanatory channels whereby this relation can occur. Theoretically, four channels have been advanced and they can be categorised into two broad classes of models. The (1) agency cost and (2) credit constraint approaches are purely economic, while the (3) fiscal policy and (4) social instability models are political economic in nature. This paper contends that both the politico-economic and the economic-based explanations have underlying demographic determinants that have not been fully explored in the literature. There is, of course, a fairly straightforward connection between age structure and economic growth. Recent empirical evidence has demonstrated that across countries and over time, younger relative cohort sizes tend to be associated with higher inequality (Higgins and Willimason, 1999). A graphical illustration may prove useful. Figure 1 plots the relation between income inequality and the percentage of the mature working age population (e.g., those aged 40-59) across 38 countries for the early 1980s. It shows an inverse relationship between income inequality and mature working age populations, with a cluster of OECD economies in the top left-hand quadrant and lower income countries occupying the lower right hand portion of the graph.2 If the link between inequality and growth is to be believed, then age structure indirectly affects growth by first influencing income distribution. In this paper, however, we restrict our attention to the direct channels linking age structure to economic performance. In more precise terms, our argument is that age structure and growth are related via the same four mechanisms that link inequality to performance in the modern growth literature.3. 2. The inverse relationship between mature populations and inequality is found in similar scatterplots for 1960, 1970 and 1990 and in regressions where we control for country fixed effects, education and levels of economic development. 3 Demographic age structure is a better exogenous (explanatory variable) than income distribution since it is primarily determined by fertility rates 20 to 65 years previously.. 4.
(7) Figure 1 Age Structure and Inequality. Figure 2: Age Structure and Inequality. 5. % of the Population Between the ages of 40 - 59 (c.1980). 28 Germany 80. 26. Hungary 80. 24. Spain 80 CzechFinland Rep. 8080 Sweden 80. Italy 80. Greece 80. Japan 80 Belgium 80. Poland 80. Switzerland 80 Austria 80 France 80 U.K. 80. Denmark 80. 22. Netherlands 80 Norway 80. Portugal 80 Australia 80 Canada 80. 20. U.S. 80 New Zealand 80. Ireland 80. 18 South Korea 80. 16. Turkey 80 Sri Lanka 80 Brazil 80. Trinidad 80 Malaysia 80. Peru 80. 14. Ivory Coast 80. Costa Rica 80. Jamaica 80. Phillipines 80. Pakistan 80. Mexico 80. 12 10 .1. .2. .3. .4. .5. .6. .7. Income Inequality (Gini Ratio c.1980). Source: Calculations based on data from Deininger and Squire (1996) data set and United Nations World Population Prospects 1998..
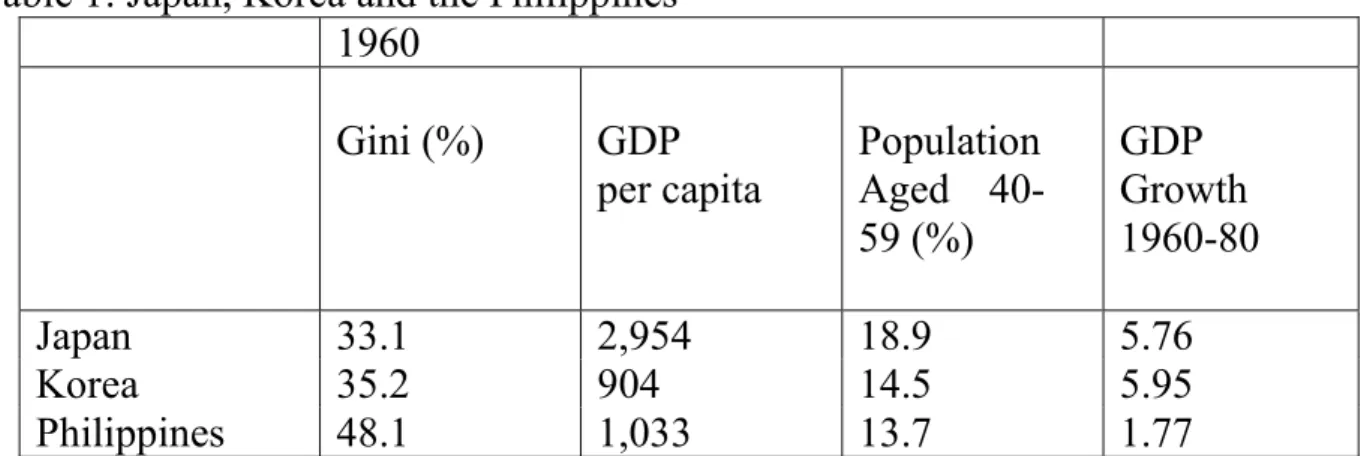
(8) This paper is organised as follows. After presenting an illustrative case study and an overview of the relevant historical literature linking inequality to economic performance, Section 2 sets out the basic questions explored in our theoretical framework. Section 3 presents the intuition behind the agency cost, credit constraint, fiscal policy and social instability models, which link inequality to economic growth. We then, in the same section, demonstrate how in each case considerations of age structure provide complimentary transmission mechanisms to those in the inequality growth models. Section 4 summarises the theoretical arguments and assesses their strengths against the empirical literature surveyed. In Section 5 we conclude our discussion.. 2 LINKING INCOME STRUCTURE TO GROWTH. DISTRIBUTION. AND. AGE. Our overview of the literature first explores the link between inequality and growth beginning with early theories and moving on to those that are currently employed. Given the number of recent literature reviews (Fereira, 1999; Temple, 1999; Aghion et al., 1999 and Lloyd-Ellis, 2001), we sketch out rather than synthesise the logic of modern studies. Our focus is on the manner in which demographic considerations – in particular cross-national variations in age structure -- can add explanatory power to the four modern channels on offer. We do this with special attention paid to Canadian and OECD cases where appropriate. 2.1. A Tale of Three Countries: Japan, Korea and the Philippines. To introduce the theme of this section we shall revisit, in a slightly amended fashion, a case raised by both Lucas (1993) and Benabou (1996) at the beginning of their respective papers. During the early sixties, Japan, South Korea and the Philippines were similar with respect to many major economic measures (e.g., GDP per capita, population size, primary and secondary school enrolment). Japan was clearly the outlier in the group with GDP per capita roughly triple that of Korea and double that of the Philippines. But if anything, based on conditional convergence criteria, this should have made Japan’s per-capita economic growth rate lower relative to the two other economies. However, this was not the case, as Japan over the next 20 years grew faster than the Philippines, and over the same period Korea experienced triple the growth of the Philippines. How was this possible? The answer, according to Benabou (1996), resides in looking beyond first moments (e.g., averages) and instead looking to the distribution of income. As pointed out by Benabou and as reproduced in Table 1, South Korea was considerably more egalitarian than the Philippines in 1960, with a Gini. 6.
(9) ratio that was 40 percent lower, while Japan was even more equal still with a Gini ratio slightly lower than that of Korea’s. But there was another difference not mentioned by either Benabou or Lucas. Much like the distribution of income, the distribution of the population was more highly skewed in the Philippines towards a younger age-cohort. Although not as dramatic as the Gini ratio differences, the relative cohort size -- the ratio of young to older adults in the population -- was larger in the Philippines than in South Korea, with Japan possessing the most mature workforce of all three as measured by the percentage of the population between 40 and 59 years of age.4 Table 1: Japan, Korea and the Philippines 1960. Japan Korea Philippines. Gini (%). GDP per capita. Population Aged 4059 (%). GDP Growth 1960-80. 33.1 35.2 48.1. 2,954 904 1,033. 18.9 14.5 13.7. 5.76 5.95 1.77. Source: Calculations based on data from Penn World Tables Mark 5.6, Deininger and Squire (1996) data set; United Nations World Population Prospects 1998.. Naturally this particular example does not constitute proof that either greater initial equality or larger initial mature working-age populations are associated with faster economic growth. The example does, however, highlight that age structure and income distributions are two potentially very important determinants of cross-country economic performance. 2.2. The Link Between Inequality and Growth: A Historical Perspective. The analysis of the relationship between income distribution and economic growth has undergone a number of phases. In some reviews of the economic growth literature it is commonly assumed that Persson and Tabellini (1992) 4. The percentage of the working age population is the appropriate demographic variable when one is looking at the impacts of income distribution on economic growth, since income earnings peak at these ages. This is true regardless of whether one considers 40-59 year olds as a percentage of the working age population or the total population. Note however, that this would not be the case if one was examining the demographic impact of the affect of wealth distribution on economic performance since much of the wealth in any population is owned by the 60+ population.. 7.
(10) were the first to link initial distributions of income with subsequent levels of economic growth. While this might be true of their empirical work, theoretically this line of argument dates back to a much earlier period. 5 Beginning with Keynes (1936), the emphasis was first placed on the issue of how income distribution could affect aggregate demand. Kaldor (1956), building upon the work of Klein (1947) and Harrod (1939), shifted attention to the relationship between distribution and growth, and in the process established what has come to be known as the pro-equality argument. Though these theories are fast approaching their 50th and in some cases 60th anniversaries, they have not been completely forgotten. Leightner (1992), for example, in a relatively recent study, uses a model very similar to Kaldor and finds empirical support for it.6 Over the past decade roughly 15 studies that have sought to answer the question of whether inequality is bad for growth. In a majority of cases (though not all) the results confirm that inequality is indeed detrimental to growth. Interestingly, the modern literature shares a similarity with more traditional institutional arguments.7 The link centres on the role that imperfections play in the market. The imperfections pointed to by modem research take the form of financial and credit market discontinuities rather than social barriers. The modern approaches, though differing in their transmission mechanisms, all emphasise that growth is the result of investment in physical or human capital. 3. MODERN PERSPECTIVES ON INEQUALITY AND GROWTH: CAN AGE STRUCTURE ‘ADD VALUE’? Four models share the lead role in accounting for the empirical regularities regarding income distribution and economic growth described above. They are: (1) fiscal policy channels; (2) social conflict channels; (3) agency cost models; and (4) capital market imperfection models with human capital spillovers. Given 5. Even from an empirical perspective, the equity-efficiency trade-off was questioned much earlier. See Osberg (1984). 6 Leightner’s model is slightly different in that it does not treat inequality as we generally do, namely as the distribution of income among the population. Rather he examines the inequality of factor shares between capital and labour. The pro-equality arguments runs something like the following: (1) labour has a higher marginal propensity to consume (MPC) out of income than does capital; (2) if labour has a higher MPC, then increasing the share of total income going to labour will induce greater consumption; (3) consumption today increases investment; (4) if investment increases, then so does economic growth; (5) therefore, increasing the share of total national income going to labour increases economic growth. 7 During the seventies and eighties, macro economists lost interest in issues of distribution. During a 1987 symposium devoted to the issue of the productivity and economic growth slowdown, not one paper mentioned income distribution as a possible determinant. Moreover all the participants ignored one of the major events of this century, the baby boom. See Fischer (1988).. 8.
(11) that four recent studies (Fereira, 1999; Temple, 1999; Aghion et al, 1999; and Lloyd-Ellis, 2001) have summarised the literature in this area, we provide the intuition behind the four models rather than fully reviewing their content. In each case we critically assess the models both theoretically and empirically and then point to the demographic linkages present in each. Political Economy Channels: The Fiscal Policy Approach Like their economic counterparts discussed later in the text, the modern politico-economic approach assumes that growth is the result of investment in physical or human capital. Two major political channels – the fiscal policy and social conflict model – attempt to account for the observed relation between inequality and growth. We begin with the former. The fiscal policy theories have been simultaneously advanced by Persson and Tabellini (1994) and Alesina and Rodrik (1994). In both cases they have developed theoretical models that explain why highly concentrated wealth distributions are conducive to lower rates of economic performance. Both arguments are quite similar and follow the logic of public choice theory. Alesina and Rodrik (1994) begin by assuming that voter preferences influence government policies. When income inequality is quite large, vast segments of the population are more likely to tax growth-promoting activities and press for state transfers. Growth promoting activities are simply defined by the authors as investments in physical and human capital. Policies that maximise growth are optimal only for a government that cares about investors. The higher the inequality of wealth and income, the higher the rate of taxation and fiscal redistribution, and consequently the lower the growth rate. While intuitively appealing and certainly in line with the tenets of mainstream economic thinking, these models suffer from a curious flaw: the evidence runs opposite to that predicted by median voter models. Among advanced countries, pre-tax inequality has a significantly negative effect on every major category of social transfers as a fraction of GDP (Rodriguez, 1998; Gomez and Meltz, 2001). More surprisingly, the effect of transfers on growth is actually positive in most studies (Benabou, 2000). The channel linking higher ex-ante inequality to lower ex-post tax rates is simple and relies on the well established phenomena that voting propensities, along with every reported form of political activity, increase with income (Rosenstone and Hensen, 1993; Benabou, 2000). The poor simply participate and vote less than the rich. This may explain why economies with more. 9.
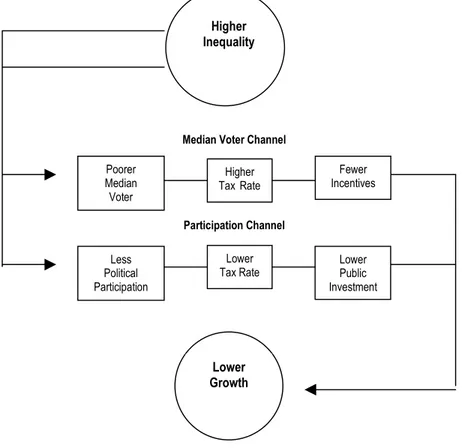
(12) compressed earnings distributions also tend to have higher voter turnout (IDEA, 2001).8 Furthermore, it may be that for this reason many countries are below their optimal tax threshold; the region where higher taxes combined with productive public spending will lead to higher growth. The idea of an optimal tax threshold rests on the notion that because richer agents can more easily substitute private alternatives for public goods and because lower income agents are more dependent on State expenditures in services like health, education, public transport and basic infrastructure, public expenditure can play a simultaneously equalising and performance enhancing role (Ferreira, 1995). As a result, inequality may indeed cause lower growth for fiscal policy reasons, but only because inequality leads to (1) less political participation amongst the poor, (2) lower taxes and (3) less public investment. This implies an alternative fiscal policy mechanism than the one currently espoused by Alesina et al (1994). Figure 3 contrasts the two political-economic channels discussed above.. 8. There has been very little systematic work (theoretical or empirical) done on the determinants of political participation and voter turnout.. 10.
(13) Figure 3: Two Alternative Fiscal Policy Channels Linking Inequality to Lower Growth. Higher Inequality. Median Voter Channel Poorer Median Voter. Higher Tax Rate. Fewer Incentives. Participation Channel Less Political Participation. Lower Tax Rate. Lower Growth. 11. Lower Public Investment.
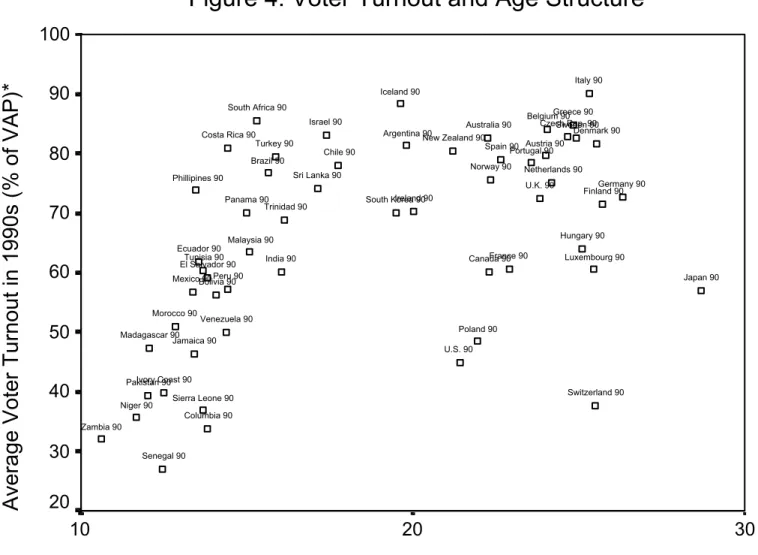
(14) Figure 4: Voter Turnout and Age Structure. 12. Average Voter Turnout in 1990s (% of VAP)*. 100 Italy 90. 90. Iceland 90 South Africa 90 Israel 90 Costa Rica 90 Turkey 90. 80. Brazil 90. Norway 90. Sri Lanka 90. Phillipines 90. Ireland South Korea 9090. Morocco 90. 50. Germany 90 Finland 90. Hungary 90. Malaysia 90 Ecuador 90 Tunisia 90 India 90 El Salvador 90 Peru 90 MexicoBolivia 90 90. 60. Netherlands 90 U.K. 90. Panama 90 Trinidad 90. 70. Chile 90. Greece 90 Belgium 90 Czech Rep. 90 Australia 90 Sweden 90 Denmark 90 Argentina 90 New Zealand 90 Austria 90 Spain 90 Portugal 90. France Canada 90 90. Luxembourg 90 Japan 90. Venezuela 90 Poland 90. Madagascar 90 Jamaica 90. U.S. 90. Ivory Coast Pakistan 90 90. 40. Niger 90. Switzerland 90. Sierra Leone 90 Columbia 90. Zambia 90. 30 20 10. Senegal 90. 20. Percentage of the Population Aged 40-59 (c. 1990) Source: Calculations based on data from IDEA (2001); United Nations World Population Prospects 1998.. 30.
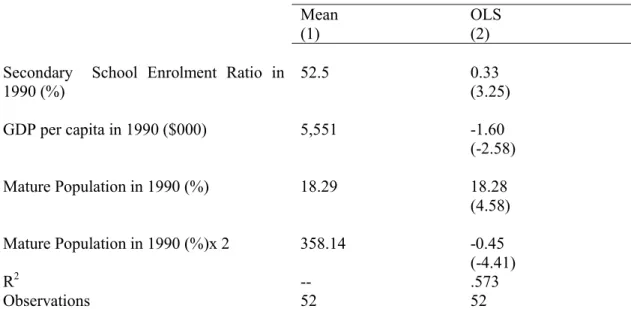
(15) Political Economy Channels and Age Structure There are two ways in which demographic considerations can enhance the fiscal policy picture presented above. The first builds upon the observation that political participation is positively related to age.9 As shown in Table 3 below, for Canada it is the case that conditional on income, the propensity to vote in a federal election rises as voters become older. Given this micro-relation, one could generalise and predict that at the macro-economic level, greater proportions of mature-aged voters in a population will increase voter turnout and political participation. Figure 4 reveals that over the low-to-medium range, countries with more mature populations (e.g., the proportion of the voting age population aged 40-59) do indeed exhibit greater voter turnout. Empirically, the relationship appears much like a logistic function with voter turnout rising with age and then declining as it reaches an asymptote when approaching 100 percent. 10 A more precise estimate of this turning point is found when we regress the proportion of those aged 40-59 and its square in 1990 against voter turnout in the 1990s for 52 countries. Table 2 shows that a robust and highly significant relation exists between voter turnout and mature age populations even after controlling for levels of economic development and education. Voter turnout amongst the voting aged population (VAP) peaks when the proportion of voters aged 4059 constitutes roughly 23 per cent of the population. In this paper we do not offer a theory as to why voter turnout appears to increase and then flatten as countries age; all we suggest is that age structure has to be part of any fiscal policy explanation that purports to account for the effect of inequality on voting propensities and political pressure to redistribute income. The second link between demography and fiscal policy rests upon the observation that attitudes towards redistribution and demand for public expenditures differ significantly across age groups. Table 3 shows that in 9. There is of course a simultaneity problem in that the two variables (market income and age) march hand in hand, and so it is hard to disentangle the effects of each. 10 Several countries stand out and do not follow the pattern mentioned above. Switzerland, in particular, has a very low voter turnout despite being one of the oldest countries in the OECD. This apparent anomaly can be explained by the fact that these are data for federal elections and in Switzerland the federal government has much less power than in other countries such as the UK. Other particularly notable outliers such as the U.S and Japan can be explained by other country specific effects such as lack of automatic voter registration in the U.S. and a post war electoral system that gives the incumbent Japanese political party huge advantages.. 13.
(16) Canada the young (18-24) and the old (65+) tend to be the most supportive of public transfers and tend to place a higher priority on public spending over deficit reduction than otherwise comparable 25-64 year olds. The group with least demand for redistribution or public services, and hence the most susceptible to calls for lower taxes, is the 25-64 age group. Those aged 35-54, raising families and presumably in need of the most after-tax disposable income, reside at the heart of that age group. In Canada during the mid nineties the entire baby boom generation (those born between 1947 to 1966) moved into their thirties.11 In 1998 this totalled 9.9 million people, or 32.4 percent of the Canadian population (Foot and Stoffman, 2000). That means that one third of the population are boomers entering their family formation years and for that reason alone, when that group gets interested in a particular idea (e.g., reducing taxes or the deficit) the rest of society has to take notice. Table 2 – Voter Turnout and Age Structure Across Countries Dependent Variable: Average Voter Turnout in 1990s Mean (1) Secondary 1990 (%). School Enrolment Ratio in 52.5. OLS (2) 0.33 (3.25). GDP per capita in 1990 ($000). 5,551. -1.60 (-2.58). Mature Population in 1990 (%). 18.29. 18.28 (4.58). Mature Population in 1990 (%)x 2. 358.14. R2 Observations. -52. -0.45 (-4.41) .573 52. Note: The dependent variable is average voter turnout amongst voting age population in the 1990s (mean=64.9). The t-statistics are in parentheses. Mature populations defined as proportion of the population aged 40-59. Calculations based on data from Penn World Tables Mark 5.6; Institute for Democracy and Economic Assistance (2001); United Nations World Population Prospects 1998.. Table 3: Probability of Political Participation and Political Orientation by Age in Canada. 11. It is important to note that Canada’s baby boom was the largest in the western world. In fact only three other Western countries – the United States, Australia, and New Zealand – had large booms after the war.. 14.
(17) Age 18-24 % 59.0. 25-34 % 86.1. 35-44 % 87.0. 45-54 % 91.5. 55-64 % 94.5. 65+ % 92.2. 1. Voted in Last Federal Election 2. Gov’t Should Reduce 53.6 43.8 44.5 41.9 40.3 47.4 Inequality 3. Deficit Reduction Major 40.7 49.5 51.7 47.8 56.1 42.3 Priority Source: Calculations based on Lipset and Meltz (1996) Angus Reid Survey. Proportions based on controls for income and education.. Social Conflict Channels A second politico-economic model has been advanced by Alesina and Perotti (1993, 1996). Here the link between inequality and growth does not depend on fiscal policy, but rather inequality fuels political and social discontent, which can take on varied forms from riots and coups to increased property crime. The creation of socio-political instability, in turn, reduces investment and ultimately hinders economic growth. 12 Although this channel seems better suited to highly unstable and unequal developing economies, it has also been confirmed in studies of the effect of urban inequalities on productivity in the U.S. and in OECD countries. In the city-based literature, Benabou (1996) has shown that disparities in the ratio of suburban to urban incomes lowers output and wages in the entire metropolitan region. He also shows that in metropolitan areas with greater income inequality, average household income is lower even amongst the most affluent. Numerous studies in the U.S. have also shown that poverty and inequality are powerful predictors of homicide, violent crime and other forms of non-political unrest (Kennedy et al. 1998). Time series evidence reveals that the hollowing out of America’s urban core during the seventies, eighties and early nineties was partly induced by growing inner city crime and a flight of workers and jobs to the suburbs (South and Crowder, 1997). The channel linking such social problems, especially violence and homicide, to greater income inequality involves the concept of social capital (e.g., trust and civic participation), which undermined by large gaps between rich and poor. In a study by Kawachi et al. (1997) income inequality across U.S. states was 12. Criminologists have long seen this connection as well. In the sociological literature, it is termed ‘relative deprivation theory.’ In an early study Blau and Blau (1982) discovered that in the U.S., income inequality in a Standard Metropolitan Area (SMA) substantially raised its rate of criminal violence.. 15.
(18) strongly correlated with violent crime (r = 0.76) as well as measures of social capital, such as per capita group membership (r = -0.40) and lack of social trust (r = 73). In other contexts, there is evidence that greater inequality impairs a national government’s ability to adopt optimal policies to cope with major external shocks (Rodrik, 1998). Co-operation from various stakeholders is essential for the undertaking of successful macro-economic stabilisation and such consensus is often facilitated by a greater degree of income equality (Bruno and Easterly, 1998). Once again we find that popular support for redistribution decreases with inequality, at least over a certain range. In short, progressive policies and their consequent social stability meet with a wider consensus in a fairly homogenous society, but face stronger opposition in an unequal one. Social Conflict Channels and Age Structure Widespread social discontent is responsive to labour market incentives and this crucial insight needs to be incorporated into models of inequality, instability and growth. In a standard time allocation model paid employment is the alternative to protest or crime. Therefore, private and social forms of discontent (e.g., property crime or public protest) should respond to changes in wages and unemployment probabilities. The propensity to engage in property crime, for example, has decidedly demographic implications. The likelihood of committing a violent crime -- a form of private discontent popular in many U.S. states -- increases with age until a person reaches their mid-twenties and then declines. Though levels of crime differ markedly across countries, the inverse relationship between age and crime is quite robust. So strong is this demographic relationship in fact, that most epidemiological data linking crime to any other exogenous cause has to be standardised for age (Kennedy et al., 1998). The age distribution of crime could be related to deviant attitudes, as some of the criminology literature attempts to argue, or it may be a labour market phenomenon responding to wages and the probability of being employed. Wages and employment rates represent the opportunity costs of committing a crime or of protesting, and wages and employment rates rise steeply over the lifecycle.13 13. Note that this same logic can be applied to the opportunity cost of shirking at the firm level, which rises with the wage (which itself is correlated positively to age). Generalising, we can say that the opportunity cost of shirking rises with age.. 16.
(19) Examining the period of highest crime in the U.S. -- the twenty-five year period from the late 1970s to the late 1980s – reveals that it was a time when the last leg of the baby boom passed through its late teens and early twenties. It was also a time when wages fell substantially for young men (Katz and Murphy, 1992). Both effects, therefore, reinforced each other as larger younger age cohorts pushed wages down thus lowering the opportunity cost of crime, while at the same time the tail end of the baby boom entered into their peak crime participation years (Grogger, 1998). The effects of these patterns of deviance on economic performance have not been estimated with any degree of accuracy. However, persuasive examples abound. In Japan there was violent labour unrest in the late fifties and early sixties (Kenney and Florida, 1988), a time when nearly 36 percent of the Japanese population was aged 15-34. In the U.S., the abandonment of inner cities that occurred during the eighties and early nineties was strongly attributed to rising crime rates (South and Crowder, 1997), but it also coincided with the period in which 15-34 year olds comprised 35 and 32 percent of the population respectively. During the relatively tranquil 1950s, the percentage of 15-34 year olds was only 25 percent. Attaching an economic value to the social disruption brought about by youth crime and unrest is difficult. The L.A. riots and the social unrest and property crime that struck most major American in the early nineties had an appreciable economic cost. 14 DiPasquale and Glaeser (1998) estimated the costs of one day of rioting to be 440 million dollars in L.A. alone. Agency Cost Models The intuition behind agency cost models and their link to growth theory is derived from the economics of information and appears in several works by Joseph Stiglitz (Furman and Stiglitz, 1998; Greenwald and Stiglitz, 1986). Inequalities in income and wealth generally require principals (owners of assets) to delegate the use of their assets to subordinates (agents). Since most transactions are undertaken with imperfect and incomplete information, it is very costly to specify a perfect contract in which all the actions of the agent are accounted for in each contingency. Even if such a contract were specified, it would be very difficult to monitor and enforce. This is the heart of the principal-agent problem that creates agency costs. Agency costs and the steps taken to mitigate them (like closer monitoring) affect output in a number of 14. Of course it also led to several responses on the part of authorities; major federal public outlays for crime control and substantial investments in inner city redevelopment that have produced what some have called an ‘urban renaissance’ in the U.S.. 17.
(20) ways.15 More precisely, if inequality positively affects agency costs then it will also be the case that economic performance will be impaired. The elements of the above channel that lead from higher inequality to lower growth are difficult to test for several reasons. First, the model implies that asset inequality is the cause of higher agency costs, and so in the absence of asset data, one has to use income inequality as a proxy. Second, one would have to establish the agency cost link first and then look at the reduced form linking inequality and growth as an indirect confirmation of its effect on performance. Finally, there may be a number of steps taken to reduce agency costs (e.g., hiring of private security) that are not efficient, but that add to estimates of GDP and hence appear beneficial to estimates of economic growth. Despite these problems there is evidence that agency costs do impair economic performance.16 Within, as well as across, an advanced economy there is evidence that low wages and higher monitoring are systematically related (Gordon, D., 1996).17 The micro-foundation for this relationship stems from the fact that when principals pay a lower wage they decrease the cost of shirking. Consequently, in the presence of imperfect information effort has to be sustained by monitoring agents more closely. Agency Cost Models and Age Structure How can considerations of age structure enhance the agency cost channel? Firstly, there is evidence that monitoring costs are higher in establishments employing younger workers. This is related to the opportunity cost of shirking which is lower for young workers, both because they earn a lower wage and because they possess less firm specific capital. Figure 5 uses micro-data from the Canadian General Social Survey on Work and Retirement (Cycle 9) and 15. For details see Furman and Stigltz (1998). Within lower income economics that are dominated by agricultural activity, output per acre is 16 percent higher on owner-occupied land than on sharecropped land. Sharecropping contracts are widespread and ‘solve’ the problem of costly monitoring by ensuring the tenant has an incentive to work. However, by imposing in effect a marginal tax rate (of between 30-90 percent in some cases) these contracts lead to an under-supply of effort and under investment in the land. If there was a more equitable distribution of assets (land and wealth) the result could be an improvement in agricultural productivity (Furman and Stigltz, 1998). 17 Using an economy wide index of supervisory intensity, Gordon (1994) found that the ratio of administrative and managerial workers over the sum of clerical, service and production workers in his sample of 12 economies was negatively related to average wage levels: in other words remuneration and supervisory intensity are traded off. For more on the Canadian pattern between supervisory burdens and wages see Gomez (2001). 16. 18.
(21) shows a discernible negative relationship between the probability of being highly supervised at work and age of worker.18 For example, a worker aged 15-19 is 50 percent more likely to be supervised closely than a comparable 50 year old. Evidence in the U.S. also shows that larger younger working age cohorts put downward pressure on wage levels (Macunovich, 1998). This observation combined with the contention that low wage growth among bottom earners leads firms to misallocate labour in the form of overstaffing in low skill occupations (Gordon, R., 1996), produces an age-based channel for increased agency costs that also includes wage dispersion. The argument is simple, in a country with plenty of young workers relative to older ones, unskilled and semiskilled labour is in abundant supply. Firms faced with such a relaxed labour constraint have a lower incentive to substitute youth labour (which is cheap) with new technology (which is expensive). Such a production technology lowers labour productivity, widens wage dispersion and increases agency costs, as cheap labour has to be monitored more closely. This demographic effect appears in its reduced form when we regress inequality and economic growth and find that the two are inversely related.. 18. The inverse relationship between monitoring and age of worker remains after controlling for wage levels and a host of demographic and firm level controls (Gomez and Wald, 2001).. 19.
(22) Figure 5: The Probability of Being Highly Supervised as a Function of Age P 0.7 0.6 0.5 0.4 0.3 15-19. 20-29. 30-39. 40-49. 50-59. 60+. Age Source: Calculations based on Canadian General Social Survey, Cycle 9: Work and Retirement.. Capital Market Imperfections and Human Capital Spillovers Perhaps the most direct channel linking distribution to performance is the one that begins with the tautological observation that the poor have fewer resources than the rich, and thus may never fully exploit their productive potential. Stated more formally, productive opportunities vary along a wealth distribution which inhibits all agents from investing in their most productive activities, despite having similar underlying capacities and effort functions. Education would presumably be the easiest solution out of the poverty trap. Though it varies across countries, it is well known that the return to higher education is decidedly positive.19 Nevertheless, poor agents may be credit constrained and therefore not able to meet the minimum fixed cost (e.g., the tuition fee or the opportunity cost in forgone wages) needed to undertake such an investment, primarily because human capital cannot act as collateral. The likelihood of credit constraints harming efficiency would be reduced if capital markets were perfect. But capital markets, even in advanced 19. The premium to an additional year of schooling is only 3 percent in Sweden versus 15 percent in the U.S.. 20.
(23) economies, are far from perfect. Just as lending is pro-cyclical (e.g., rather than offering a life line during downturns, debts are called back during bad times) it is also pro-collateral in that the more money you inherit the more you can borrow. Second, even with no borrowing constraints, the absence of insurance markets through which individuals can divest themselves of risk reduces an individual’s willingness to invest in education through loans even when they are available. Therefore, if financial markets are imperfect and borrowing is difficult or impossible, then those who inherit a large initial endowment of wealth and do not need to borrow are better able to invest in human capital. If the number of these people is relatively small, then an unequal distribution of wealth and income will adversely affect the aggregate amount of investment in human capital. Consequently, long run growth will be lower. The intuition above is borrowed from a model by Galor and Zeira (1993) and rests upon a slightly problematic assumption that social mobility is non-existent, or "that rich families remain rich and poor families remain poor". While Galor and Zeira leave this question unanswered, other researchers working within the financial imperfection paradigm, most notably Durlauf (1994) and Benabou (1994), have shown how inequality can persist across generations and how this same inequality affects subsequent economic growth. Benabou (1996), for example, uses a rather simple model to demonstrate how small differences in education, preferences, or initial endowments of wealth, when combined with imperfect borrowing markets, lead to a high degree of stratification. Stratification makes inequality in education and income more persistent across generations, and this social polarisation leads to the formation of ghettos and large pockets of poverty. These areas can be very inefficient, both from the Pareto criteria and for growth in long run aggregate output. Benabou (1994) suggests a simple way of capturing the interdependence between rich and poor agents, by expressing individual output or marginal product, y(h), as a function of (1). y(h) = G (h, H),. where H is an economy-wide index of human capital and G is an aggregator of some kind. The implication of (1) is rather simple. Living in areas or working in firms with more egalitarian distributions of income raises general levels of human capital. If the aggregator is such and if H is negatively related to income inequality, then individual marginal products may differ even if personal human capital levels remain the same. Put simply, two people of equal ability are not equally as productive depending on the environment in. 21.
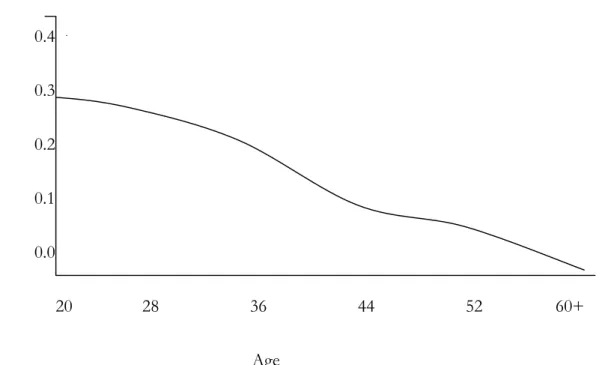
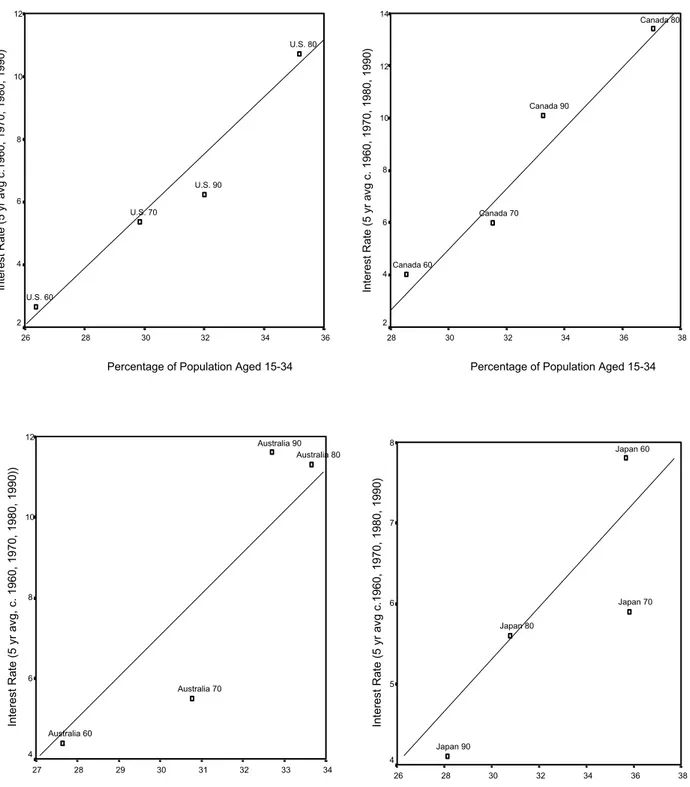
(24) which they work and/or live.20 From an applied perspective one can see how complementarities in the labour market - for example the combination of well-educated mangers coupled with workers with low levels of training may not be very efficient and can lead to conflict at work. In a dynamic setting, imperfect capital markets prevent successive generations from improving their human capital requirements. Ultimately this also prevents workers from acquiring the necessary skills and can lead to the formation of ghettos and poverty traps. Capital Market Imperfections and Age Structure The link between age structure and capital market imperfections rests upon a well known empirical regularity. Borrowing constraints are more binding the younger one is (Japelli, 1990). Figure 6 shows the probability of being liquidity constrained as a function of age. In the U.S., it is roughly 25 percent until the consumer is 30 years old and then the probability of being liquidity constrained declines during middle age and approaches zero in later years. If we use this stylised fact, we begin to see how some economies have managed to combine lucky demographics with sound polices, in that their economic take-off coincided with a period in which one of their initial conditions was a high saver to borrower ratio. Whilst it is true that saving rates are high amongst all groups in most East Asian economies, they are still higher for older than for younger groups. Japan, for example, had a relatively large mature working age population from the late 1970s onward, which meant that the young and more impoverished in Japan faced lower borrowing constraints during this period than those living in countries that experienced large baby booms after World War II (e.g., Canada, United States and Australia). These countries faced the opposite problem in the late seventies and early eighties, in that they had a small number of savers relative to borrowers exacerbating the stringency of loan provision and pushing up interest rates (Foot and Stoffman, 2000). Figure 7 shows the relationship between nominal interest rates and age structure across these four economies. We see how a greater percentage of consumers in their peak liquidity-constrained years (15-34) are positively related to the preferred bank-lending rate. Japan experienced its relative credit 20. Evidence of these positive social interaction effects abounds. One of the most interesting studies (from a Canadian perspective) by Idson and Kahane (2000), examines the effects on individual hockey players of playing on teams with low variance in average talent versus ones with higher variance. The results confirm that ‘team mates’ matter no matter how able individuals are. Wayne Gretzky may have been the best hockey player in the world, but he was better when he played with Mark Messier and Paul Coffey in Edmonton than when he played with Chris Kontos and Dale Degray in Los Angeles.. 22.
(25) crunch in 1960 whereas in Canada, Australia and the U.S. the ratio of borrowers to lenders was greatest in the early eighties and early nineties, corresponding to the years when prime lending rates were highest and when domestic output fell. Figure 6: The Probability of Being Liquidity Constrained as a Function of Age P 0.4 0.3 0.2 0.1 0.0 20. 28. 36. 44. 52. 60+. Age Source: Calculations based on Jappelli (1990: 229).. The fact that interest rates tend to be higher when there is a greater percentage of the population in their peak liquidity constrained years (15-34) has serious implications for central bank policies21 and the equity-efficiency debate in Canada, especially as it relates to tuition for higher education, which is slowly mirroring privatised systems south of the border. As is evidenced in the U.S., even the provision of loans will not compensate for the risk that is associated with investing in education as a way out of poverty, and so participation rates into post-secondary education can be expected to fall in line with those south of the border. This will, holding other things constant, increase the wage premium associated with additional years of schooling and thus exacerbate the inequality of income.. 21. Interestingly, if one compares interest rate polices in Canada and the U.S. in the early nineties one finds that despite facing near identical demographic pressures, Canada’s interest rate was on average 4.5 percentage points higher from 1988 to 1992. This also coincided with the John Crow era in Canada and the early Greenspan era in the U.S. A tentative conclusion is that Canada could have managed with lower interest rates, as in the U.S. For more on this debate see Fortin (1999, 2000).. 23.
(26) Figure 7: Interest Rates and Age Structure: U.S., Canada, Australia and Japan. 12. 14. Interest Rate (5 yr avg c. 1960, 1970, 1980, 1990). Interest Rate (5 yr avg c.1960, 1970, 1980, 1990). U.S. 80. 10. 8. U.S. 90 6 U.S. 70. 4. Canada 80. 12. Canada 90 10. 8. Canada 70 6. Canada 60 4. U.S. 60 2. 2 26. 28. 30. 32. 34. 36. 28. 30. Percentage of Population Aged 15-34. 34. 36. 38. Percentage of Population Aged 15-34. 8. Australia 90 Australia 80. Interest Rate (5 yr avg c.1960, 1970, 1980, 1990). Interest Rate (5 yr avg, c. 1960, 1970, 1980, 1990)). 12. 32. 10. 8. 6 Australia 70. Japan 60. 7. Japan 70. 6 Japan 80. 5. Australia 60 Japan 90. 4 27. 4 28. 29. 30. 31. 32. 33. 34. Percentage of Population Aged 15-34. 26. 28. 30. 32. 34. 36. Percentage of Population Aged 15-34. Sources: Calculations based on World Population Prospects 1998, United Nations; and nominal interest rate data from the International Monetary Fund (IMF) Database.. 24. 38.
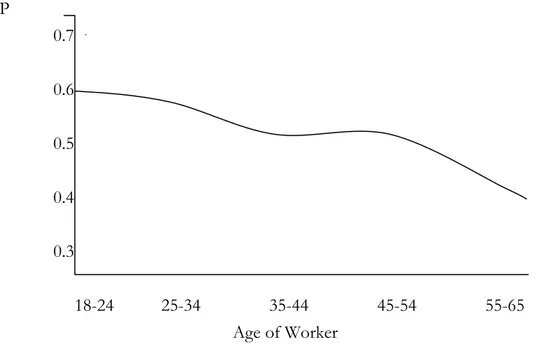
(27) Human Capital Spillovers and Age Structure Our second demographic observation has implications for personnel functions within firms. It was argued earlier that within firms inequality can have negative consequences for productivity because it leads to a combination of social and productive friction at the workplace. A large ratio of younger to older workers within a firm can produce similar effcects, although the channels are more speculative and will only be modelled in a very stylized fashion here. In the absence of tenure and in the presence of performance based payment and promotion systems, firms will increasingly be faced with the problem of ensuring that competition among employees does not inhibit cooperation and the sharing of productive knowledge. Already, we know that workers differ in their preference for performance based systems of promotion. In Figure 8 the probability P of favouring meritocracy over seniority is displayed for different age categories of workers in Canada. Not surprisingly it shows that P declines as workers get older. Figure 8: The Probability of Favouring Meritocracy over Seniority as Function of Age P 0.7 0.6 0.5 0.4 0.3 18-24. 25-34. 35-44 Age of Worker. 45-54. 55-65. Source: Calculations based on Lipset and Meltz (1996) Angus Reid Survey. Probability estimates based on controls for income and education.. Since the key to most firm-level performance is striking the proper balance between co-operation and competition, having employees share ideas about how to work more efficiently is good. However, having them share ideas on how to collude so as to restrict output is bad. Similarly, having employees. 25.
(28) compete for promotions on the basis of who is the best works well in settings where hierarchical structures still prevail, whereas having workers drag down the productivity of others in order to win promotional tournaments in environments where co-operation is essential, is not so beneficial. With these examples in mind, age dispersion within an organisation can not only bifurcate the earnings distribution but it can have negative consequences for co-operation in the presence of strong performance incentives. This is so if older workers are either uninsured against job loss -- arising perhaps from the passing on of valuable information to younger colleagues -- or if there is no stringent screening and monitoring mechanism in place to weed out ‘hawkish’ personality types from the more ‘dovish’.22 4.. Age Structure and Models of Inequality and Growth: A Summary. What can we conclude from our summary of the inequality-growth relation and its connection to demographic age structure? Our paper began by noting that inequality has a straightforward, though indirect, connection to economic growth via its role in influencing income distribution. Specifically, inequality tends to be lower on average, in mature populations, defined here as countries whose proportion of people aged 40-59 is relatively high. We then focused on the more interesting connection between age structure and the four existing transmission mechanisms linking inequality to growth. In each case we found that a demographic channel linked age structure to growth. These relations are summarised in Figure 9, and in more detail in the four points below: 1. The opportunity cost of time has implications for theories of social unrest and agency cost models linking higher inequality to lower growth. Expected wages and the probability of being unemployed decline over a person’s lifecycle, thus lowering the opportunity cost of work alternatives. Two work alternatives, the propensity to shirk, or commit crime and cause social unrest (see Figure 5) have notable demographic determinants that decline as individuals get older. These behaviours increase monitoring costs and negatively affect growth and investment, but though their attribution in the literature to income inequality we feel is correct, we also argue that these channels should be expanded to include demographic antecedents and interaction effects as well. 2. The opportunity cost approach does have its limitations for it fails to predict the lack of political participation amongst the poor and young and the consequent low taxation and high inequality equilibrium that is observed across countries (and which is captured in our amended fiscal 22. The intuition here is more rigorously formalised in Lazear (1998). 26.
(29) policy model, see Figure 3). From a dynamic setting, one can understand why the poor and the young may be less willing to tax high income or mature segments of the population in order to finance their public-good requirements. The expectation among the poor and young that they will move out of low incomes and into higher marginal tax categories may inhibit their expected opposition to right-wing dynasties (Benabou, 1998). On balance, though, the data (see Table 3) seems to suggest that lack of political participation, rather than a lower desire for redistribution, is the cause of the median voter model’s failure to account for relatively less redistribution in unequal societies. 3. Credit constraint models demonstrate how initial disparities in income and wealth are perpetuated over time, thus inhibiting the productive potential of a society to be realised. What is missing from these models is a channel demonstrating why these inequalities form in the first place. One could argue that initial endowments in talent and skill are one cause. A more plausible channel from our perspective is the timing of secular growth cycles and the set of age related initial conditions present at time to. A relatively large mature working age population lowers inequality, creates a higher saver to borrower ratio that lowers interest rates (see Figures 6 and 7) and thus decreases credit constraints. This allows those equally able, but poorer or younger, to borrow and invest in the most productive activities a society has to offer (e.g., education, training, and entrepreneurship). 4. Finally we demostrated how individual worker and firm performance. could be harmed by inequality, in that heterogeneity (e.g., workers of low skill working alongside those with high skill) can lower individual productivity. This is because workers of equal ability and skill are not as productive in different environments. Environments characterised by wide income disparities fare relatively poorly as compared to more egalitarian settings because of the social disruptions that occur when inequality is high. This notion was extended to include bifurcated age distributions within firms. Given certain assumptions, it can be shown that frictions between young and mature workers arise under performance-based systems of rewards. These systems exacerbate wage dispersion among workers employed in the same firm or performing similar tasks, thus leading to rent seeking activities and engendering responses ranging from the benign (information hoarding) to the pathological (co-worker sabotage).. 27.
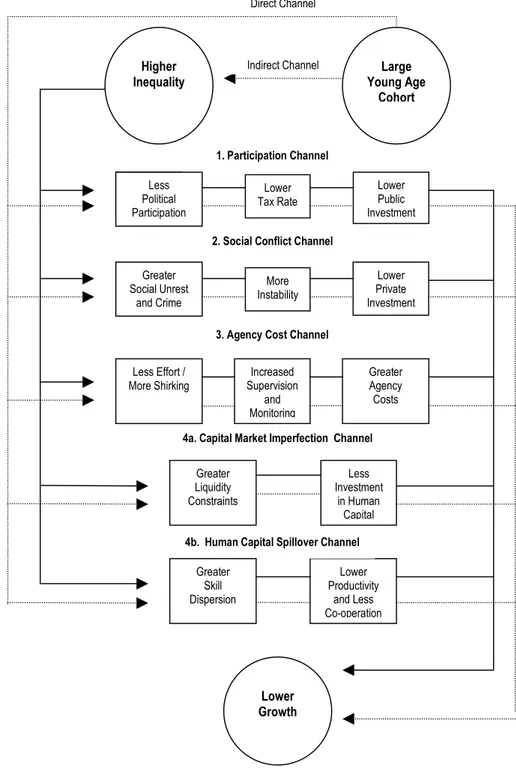
(30) Figure 9: Age Structure and Channels Linking Inequality to Lower Growth. Direct Channel. Indirect Channel. Higher Inequality. Large Young Age Cohort. 1. Participation Channel Less Political Participation. Lower Public Investment. Lower Tax Rate 2. Social Conflict Channel. Greater Social Unrest and Crime. Lower Private Investment. More Instability 3. Agency Cost Channel. Less Effort / More Shirking. Increased Supervision and Monitoring. Greater Agency Costs. 4a. Capital Market Imperfection Channel Greater Liquidity Constraints. Less Investment in Human Capital. 4b. Human Capital Spillover Channel Greater Skill Dispersion. Lower Productivity and Less Co-operation. Lower Growth. 5. CONCLUSIONS. This paper was concerned with explaining the inverse relation between income inequality and economic growth. The approach used was straightforward. We began by describing the logic of four models that modern literature has proposed as being the most likely transmission mechanisms linking inequality to slower growth. We then showed how a demographic explanation complemented each of the four mainstream accounts. In this. 28.
(31) paper we assumed that age structure had an obvious, though indirect, effect on economic growth through its impact on income distribution. But independent of its effect on income distribution, our review of theory suggests that age structure has direct effects on economic performance. By lowering credit constraints and generating larger stocks of human capital, or by increasing agency costs, economic performance can be significantly affected by variations in demographic age structure. Stylised evidence and illustrations demonstrated how national age structures heavily weighted with younger working age cohorts could induce effects as diverse as lower political participation, greater social unrest and higher interest rates. These conclusions have both positive and normative implications. From a positive perspective, they help explain the divergent growth paths of many countries with otherwise similar initial economic and social conditions. From a normative point of view, rather than objecting to income inequality solely on the basis of equity criteria, this research suggests that considerable efficiency losses can be incurred if a country allows for large disparities of income to persist. The findings also suggest that appropriate government intervention can simultaneously achieve more equality and faster economic growth, but only up to a point conditioned on the age structure of the population. As our theoretical discussion pointed out, a number of alternative models can generate a similar negative relation between growth and income inequality. In this paper, we found that income inequality increases when the composition of the workforce grows younger. Thus, appropriate government policies should attempt to counteract these tendencies perhaps through minimum wage legislation or training and apprenticeship programs for younger workers. Rafael Gomez, London School of Economics ([email protected]) David K. Foot, University of Toronto ([email protected]). 29.
(32) REFERENCES Aghion, P., E. Caroli and C. Garćia-Peňalosa. 1999. “Inequality and Economic Growth: The Perspective of the New Growth Theories," Journal of Economic Literature, 37, pp. 1615-1660. Alesina, A.. and R. Perotti. 1993. “Income Distribution, Political Instability, and Investment”. NBER Working Paper 4486. Cambridge, MA: National Bureau of Economic Research. Alesina, A. and R. Perotti. 1996. “Income Distribution, Political Instability, and Investment,” European Economic Review, 40(6), pp. 1203-28. Alesina, A.. and D. Rodrik. 1992. “Distribution, Political Conflict, and Economic Growth” in A. Cukierman (ed.) Political Economy, Growth, and Business Cycles. Cambridge: MIT Press, pp. 23-49. ____________________ 1994. “Distribution Politics and Economic Growth,” Quarterly Journal of Economics, 109, p.456-490. Barber, C. L. 1978. “On the Origins of the Great Depression,” Southern Economic Journal, 44, pp. 432-456. Barlow, R. 1994. “Population Growth and Economic Growth: Some more Correlation’s,” Population and Development Review, 20(3), pp. 503-529. Barro, R. 1991. “Economic Growth in a Cross Section of Countries,” Quarterly Journal of Economics, 106, pp. 407-443. _______ 1999. “Inequality, Growth and Investment,” NBER Working Paper 7038. Cambridge, MA: National Bureau of Economic Research. Benabou, R. 1994. “Human Capital, Inequality and Growth: A Local Perspective,” European Economic Review, 38(4), pp. 817-826. _________ 1996. "Unequal Societies," NBER Working Paper 5583. Cambridge, MA: National Bureau of Economic Research. _________ 1998. "Social Mobility and The demand for Redistribution: The POUM Hypothesis" NBER Working Paper 6795. Cambridge, MA: National Bureau of Economic Research. _________ 2000. "Unequal Societies: Income Distribution and the Social Contract," American Economic Review, 90(1), pp. 96-129. Blau, J. and P. Blau. 1982. “ The Cost of Inequality: Metropolitan Structure and Violent Crime”. American Sociological Review. 47 (February): pp.114129. Bourguignon, F. and C. Morrisson. 1990. “Income Distribution, Development and Foreign Trade,” European Economic Review, 34(6), pp. 1113-1133.. 30.
(33) Bruno, M. and W. Easterly. 1998. “Inflation Crises and Long-Run Growth,” Journal of Monetary Economics, 41(1) pp.3-26. Chang, R. 1994. “Income Inequality and Economic Growth,” Economic Review, Federal Reserve Bank of Atlanta, July/August, pp. 1-10. Deininger, K and L. Squire. 1996. “A New Data Set Measuring Income Inequality.” World bank Economic Review, 10(3), pp.565-91. Durlauf, S. 1994. “Spillovers, Stratification and Inequality,” European Economic Review, 38(4), pp. 817-826. Easterlin, R. 1987. Birth and Fortune. Chicago: University of Chicago Press. _________ 1968. Population, Labour Force, and Long Swings in Economic Growth. New York: National Bureau of Economic Research. Fair, R. C. and K. M. Dominguez. 1991. “Effects of Changing U.S. Age distribution on Macroeconomic Equations,” American Economic Review, 81 (5), pp. 1276-1294. Ferreira, F. 1995. “Roads to Equality: Wealth Distribution Dynamics with Public-Private Capital Complementarity” LSE-STICERD Discussion Paper TE/95/286. Ferreira, F. 1995. “Roads to Equality: Wealth Distribution Dynamics with Public-Private Capital Complementarity” LSE-STICERD Discussion Paper TE/95/286. _________. 1999. “Inequality and Economic Performance: A Brief Overview To Theories of Growth and Distribution.” www.worldbank.org/poverty/inequal/index.htm Fischer, S. 1988. “Symposium on the Slowdown in Productivity Growth,” Journal of Economic Perspectives,” 2 (4), pp.3-7. Foot, D. K. and D. Stoffman. 2000. Boom, Bust and Echo: 2000. Toronto: Stoddart Publishing. Forbes, K. J. 2000. “A Reassessment of the Relationship Between Inequality and Growth,” American Economic Review, 90(4), pp. 869-887. Fortin, P. 1999. “The great Canadian Slump, a Rejoinder to Freedmnan and Macklem,” Canadian Journal of Economics, 32 (4), 1082-92. _________ 2000. “Macroeconomic Unemployment and Unemployment,” Canadian Public Policy, 26(1), pp.S126-S130.. Structural. Friedman, M. (1979). Free To Choose. New York: Touchstone Books. Furman, J. and J. E. Stiglitz. 1998 “Economic Crises: Evidence and Insights from East Asia,” Brookings Papers on Economic Activity, (2), pp. 1-114.. 31.
(34) Galor, O. and J. Zeira. 1993. “Income Distribution and Macroeconomics,” Review of Economic Studies, 60, pp. 35-52. Gomez, R. and S. Wald. 2001. “Is There an Inverse Relationship Between Supervision and Wages? Evidence from the Canadian General Social Survey.” University of Toronto, Working Paper. Gomez, R. and N. Meltz. 2001. "The Zero Sum Illusion: Industrial relations and Modern Economic Approaches to Growth and Income Distribution", Paper presented in the IRPP-CSLS Conference in January 2001, Ottawa, Ontario Gordon, D. 1996. Fat and Mean: The Corporate Squeeze of Working Americans and the Myth of Managerial Downsizing. New York: Free Press. Gordon, R. 1996. “Problems in the Measurement and Performance of Service Sector Productivity in the U.S.” NBER Working Paper, no.5519. Greenwald, B. C. and J. E. Stiglitz. 1986. “Imperfect Information, Credit Markets and Unemployment,” NBER Working Paper 2093. Cambridge, MA: National Bureau of Economic Research. Greenwald, B. C. and J. E. Stiglitz. 1986. “Externalities in Economies with Imperfect Information and Incomplete Markets,” Quarterly Journal of Economics, 101(2), pp. 229-64. Grogger, J. 1998 “Market Wages and Youth Crime,” Journal of Labor Economics, 16(4), pp. 756-791. Gupta, G. 1984. “Income Distribution,” Southern Economic Journal, 51, pp. 459-468. Harrod, R. 1939. “An Essay in Dynamic Theory,” Economic Journal, 49, pp. 14-33 Higgins, Matthew and J.G. Williamson. 1999. Explaining Inequality the World Round. Mimeo. Harvard University. Institute for Democracy and Economic Assistance (IDEA). 2001. www.idea.int. Idson, T. L. and L. H. Kahane. 2000. “Team Effects on Compensation: An Application to Salary Determination in the National Hockey League,” Economic Inquiry, 38(2), pp. 345-57. Jappelli, T. 1990. “Who is Credit Constrained in the U.S. Economy?” Quarterly Journal of Economics, 105 (1), pp.219-234. Kaldor, N. 1956. “Alternative Theories of Distribution,” Review of Economic Studies, 23(2), pp.94-100.. 32.
(35) Katz, L. F., K. M. Murphy. 1992. “ Changes in Relative Wages, 19631987: Supply and Demand Factors,” Quarterly Journal of Economics, 107(1), pp. 35-78. Kawachi, I, BP Kennedy, K. Lochner, and S.D. Prothrow. 1997. “Social capital, Income Inequality and Mortality.” American Journal of Public Health, 87, pp.1491-8. Kenney, M and R. Florida. 1988. “Beyond Mass Production: Production and the Labour Process in Japan,” Politics and Society, 16(1), pp.121-158. Kennedy, B., I. Kawachi, S.D.Prothrow, K. Lochner, and V. Gupta. 1998. “Social Capital, Income Inequality, and Firearm Violent Crime,” Social Science and Medicine, 47(1), pp.7-17. Keynes, J. M. 1937. “Economic Consequences of Declining Population Growth,” Eugenics Review, 29, April, 13-17. Keynes, J. M. 1936. The General Theory of Employment, Interest and Money. London: Macmillan Press Ltd. Klein, L. 1947. “Theories of Effective Demand and Employment,” Journal of Political Economy, pp. 138-177. Kuznets, S. 1955. “Economic Growth and Income Inequality,” American Economic Review, 34(1), March, pp. 1-28. Lazear, E. P. 1998. Personnel Economics for Managers. New York: Wiley. Leightner, J. 1992. “The Compatibility of Growth and Increased Inequality,” The Journal of Development Studies, 29, pp. 49-71. Lloyd-Ellis, H. .2001. "On the Impact of Inequality on Productivity Growth in the Short and Long Run: A Synthesis", Paper presented in the IRPP-CSLS Conference in January 2001, Ottawa, Ontario Lucas, R. 1993. “On the Mechanics of Economic Development,” Journal of Monetary Economics, 22, pp.3-42. Macunovich, D. J. 1998. “Relative Cohort Size and Inequality in the United States,” American Economic Review, 88(2), pp. 259-264. Mankiw, G. 1995. “The Growth of Nations,” Brookings Papers on Economic Activity, 1, pp. 275-323. Myrdal, G. 1968. Asian Drama. New York: Twentieth Century Fund. Malberg, B. 1994. “Age Structure Effects of Economic Growth,” Scandinavian Economic History Review, 42(3), pp. 279-295. Osberg, L. 1984. Economic Inequality in the U.S. New York: M.E. Sharpe. Perotti, R. 1994. “Income Distribution and Investment,” European Economic Review, 38, pp. 827-835.. 33.
(36) Persson, T. and G. Tabellini. 1992. “Growth, Distribution, and Politics” in A. Cukierman (ed.) Political Economy, Growth, and Business Cycles. Cambridge (MA): MIT Press, pp. 3-22. _____________________ 1994. “Is Inequality Harmful for Growth?” American Economic Review, 84, pp.600-622. Rodriguez, F. 1998. “Inequality, Redistribution and Rent-Seeking.” Ph.D. Dissertation, Harvard University. Rodrik, D. 1998. “Where Did All the Growth Go? External Shocks, Social Conflict, and Growth Collapses”, NBER Working Paper 6350. Cambridge, MA: National Bureau of Economic Research, p. 1-27. Rosenston, S. and J. Hansen. 1993. Mobilisation, Participation and Democracy in America. Nw York: MacMillan, 1993. Solow, R. 1956. “A Contribution to the Theory of Economic Growth,” Quarterly Journal of Economics, 70, pp. 65-94. South, S. J. and K. D. Crowder (1997) “Residential mobility between Cities and Suburbs: Race, Suburbanization, and Back-to the-City Moves,” Demography, pp. 525-538. Stack, S. 1984. “Income Inequality and Property Crime,” Criminology, 22 (2), May, P.229-257. Temple, J. 1999. "The New Growth Evidence," Journal of Economic Literature, 37, pp. 112-156. Tilak, G. 1991. “Comparative Development Indicators” in T. Psacharopoulos (ed.) Essays on Poverty, Equity and Growth. World Bank: Pergamon Press, pp. 360-379. Weiss, A. 1995. “Human Capital vs. Signalling Explanation of Wages,” Journal of Economic Perspectives, 9(4), pp. 133-154.. 34.
(37)
Figura
+7

Documenti correlati
Recent research on the mechanisms of HIV active entry into the cell nucleus showed that the interaction between the HIV PIC and components of the nuclear import machinery plays a
Here we investigate these issues by first comparing bootstrap based significance test results for single feature information values including different bias corrections, and
Recombinant factor VIIa concentrate versus plasma-derived concentrates for treating acute bleeding episodes in people with haemophilia and inhibitors (Review).. Matino D, Makris M,
Precisa- mente alla fine della strada, «appo la pietra del pesce», secondo Matteo Camera, dove è la loro loggia, già presente in età sveva, fatta ampliare nel 1269 da Carlo
The fourth class of reachability problem in the IMDP semantics concerns determining whether the probability of reaching a certain set of states from the current state is equal to 1
It is possible to precisely determine the target displacement by exploiting a combination of SFCW signal modulation and differential phase measurements [10].. As already mentioned,
meetings; Demonstrative forms are demonstrations, strikes and public symbolic actions; Disruptive Forms are blockages, blitzes, squatting, street or square occupations and
