Geostatistics – a tool applied to the distribution
of Legionella pneumophila in a hospital water
system
Pasqualina Laganà
1, Umberto Moscato
2, Andrea Poscia
2, Daniele Ignazio La Milia
2,
Stefania Boccia
2, Emanuela Avventuroso
1, Santi Delia
11 Department of Biomedical and Dental Sciences and Morphofunctional Imaging. Section of Biotechnologies and
Medicine Preventive. University of Messina, Italy
2 Department of Public Health – Università Cattolica del Sacro Cuore – Rome, Italy
Laganà P, Moscato U, Poscia A, La Milia DI, Boccia S, Avventuroso E, Delia S. Geostatistics – a tool applied to the distribution of Legionella
pneumophila in a hospital water system. Ann Agric Environ Med. 2015; 22(4): 655–660. doi: 10.5604/12321966.1185769 Abstract
Introduction. Legionnaires’ disease is normally acquired by inhalation of legionellae from a contaminated environmental
source. Water systems of large buildings, such as hospitals, are often contaminated with legionellae and therefore represent a potential risk for the hospital population. The aim of this study was to evaluate the potential contamination of Legionella
pneumophila (LP) in a large hospital in Italy through georeferential statistical analysis to assess the possible sources of
dispersion and, consequently, the risk of exposure for both health care staff and patients.
Materials and Method. LP serogroups 1 and 2–14 distribution was considered in the wards housed on two consecutive
floors of the hospital building. On the basis of information provided by 53 bacteriological analysis, a ‘random’ grid of points was chosen and spatial geostatistics or FAIk Kriging was applied and compared with the results of classical statistical analysis.
Results. Over 50% of the examined samples were positive for Legionella pneumophila. LP 1 was isolated in 69% of samples
from the ground floor and in 60% of sample from the first floor; LP 2–14 in 36% of sample from the ground floor and 24% from the first. The iso-estimation maps show clearly the most contaminated pipe and the difference in the diffusion of the different L. pneumophila serogroups.
Conclusion. Experimental work has demonstrated that geostatistical methods applied to the microbiological analysis of
water matrices allows a better modeling of the phenomenon under study, a greater potential for risk management and a greater choice of methods of prevention and environmental recovery to be put in place with respect to the classical statistical analysis.
Key words
Legionella pneumophila; hospital; water systems; Geostatistics; Kriging
INTRODUCTION
Legionnaires’ disease is normally acquired by inhalation or aspiration of legionellae from a contaminated environmental source. Water systems of large buildings, such as hospitals, are often contaminated with legionellae and therefore represent a potential hazard to patients and health care staff [1, 2, 3, 4, 5, 6]. Several papers have shown a clear association between the presence of legionellae in hot water systems and the occurrence of legionellosis [7, 8, 9, 10, 11].For risk evaluation of nosocomial Legionella infection, surveillance of hospital water systems is needed with traditional culture techniques or molecular typing methods [12, 13, 14, 15, 16].
In hospital as well as other health care facilities, waterborne diseases may originate from bacterial colonization of water pipes, cooling towers, spa pools, taps, showers, and water supplies [17, 18, 19, 20, 21, 22]. Several reports have concerned the epidemiological surveillance of pathogenic bacteria in Italian hospitals [23, 24, 25, 26, 27, 28]. Istituto Superiore di Sanità (ISS, National Institute of Health), reported that
during 2011 in Italy nosocomial cases of legionellosis were 65 (6.4%) of total cases reported, of which 33 (50.8%) were of certain nosocomial origin, and 32 (49.2%) possibly of nosocomial origin [29].
Water systems represent suitable environments for the growth and multiplication of Legionella spp., Gram-negative bacteria which survive at different pHs and temperatures [30, 31, 32, 33, 34, 35]. This is encouraged by water temperatures below 50oC, areas of stagnation and sludge formation,
the presence of amoebae and other bacteria [36], and the materials used in the piping.
In hospitals, the problem of Legionellosis should be tackled and managed with the methodology of Risk Analysis, the logic of which suggests that when it is not possible to eliminate the hazard, it is necessary to rely on risk control. For
Legionella this results into control of three basic parameters:
(1) the amount of the germ in the water, through analytical monitoring; (2) the presence of virulence factors in isolated strains; (3) the receptivity in the guests.
Being able to estimate the distribution of Legionella in a healthcare facility allows extension of the remediation areas also not monitored but adjacent to premises controlled by elimination, or reducing; thus, the risk of infection in patients, health workers and in visitors.
This study evaluates the distribution of Legionella
pneumophila serogroup 1 and serogroups 2–14 in some Address for correspondence: Pasqualina Laganà Department of Biomedical
Sciences and Images Morphological and Functional. Section of Biotechnologies and Medicine Preventive. University of Messina, AOU G. Martino, Torre Biol. 3°p Via C. Valeria snc, 98125 Messina, Italy
E-mail: [email protected]
hospital wards to assess the risk of exposure for both health care staff and patients. Also, it was evaluated the dispersion in the air in relation to the critical points identified, and hypotheses formulated for the determination of possible sources of dispersion according to the water supply facilities.
Geostatistics was applied in the study. It is a discipline that deals with evaluating the spatial autocorrelation of the data, attempting to verify whether observations carried out on neighbouring points actually have a lower variability compared to observations made between distant points. The objective, therefore, is to evaluate the effect of the position of the measuring point on the variability of the data observed. Apart from evaluating the spatial variability, geostatistical features of spatial interpolation techniques that can provide estimates on the value of a variable in a position where the measurement was not made on the basis of the detected data of neighbouring points.
MATERIALS AND METHOD
Sampling. The water distribution system of the ground and
first floors of pavilion E of the ‘G. Martino’ University Hospital in Messina, Italy, was examined for Legionella pneumophila 1 and L. pneumophila 2–14. Incoming cold groundwater is provided by the municipality and disinfected with chlorine dioxide, the water reaches the hospital by means of one pipeline, which leads to a centralized tank where the water is stored. The water does not undergo further chlorination after it is collected from the Messina town pipeline. From the centralized tank, the cold water is distributed to each building by electric-motor pumps which send it through a pipeline that runs across the basements of all the buildings. Under each building there is a boiler which produces heated water (average temperature of approximately 13–48 °C) that rises again to supply the wards located at each floor.
Samples of the heated water were collected after flushing for 5–10 min, and sterilization of the water tap, at the start of daily activities from taps using 1 L-sterile glass bottles. Care was taken to take samples both from floors and wards located both on the left and right sides inside each building to obtain a representative sampling of the hygienic-sanitary conditions.
Isolation and identification of Legionella spp. To recover Legionella spp. from water samples the standard procedures
reported in the Italian Guidelines for the prevention and control of legionellosis (Gazzetta Ufficiale della Repubblica
Italiana, No.103, 5 May, 2000) were used. 1 L water samples
were concentrated to 10 mL through 0.2 µm porosity membrane filters, and incubated at 50 °C for 30 min in a thermostatic bath. Concentrated and unconcentrated samples were spread on duplicate plates of Buffered Charcoal-Yeast Extract (BCYE) Agar Base Medium (Oxoid, Ltd., Milan, Italy), incubated for 10 days at 36–37 °C in a moist chamber with 2.5% CO2. The suspected colonies were isolated and confirmed as Legionella spp. after screening their inability to grow on a culture medium without cysteine. Legionella spp. counts were reported in colony forming units/litre (CFU/L) according to the number of colonies per plate and to the dilutions performed on the original sample. The isolates were further identified as L. pneumophila serogroup 1,
L. pneumophila serogroups 2–14, or Legionella spp using
the microagglutination Legionella Latex Test Kit (Oxoid).
Statistics. The data obtained were analyzed by means of
classical statistics by Stata/IC 12.1 for Mac. Data distribution was evaluated according to Shapiro-Wilk test. Differences in distribution of Legionella (by floors, or according to the serogroups) have been evaluated by rank-sum test for independent samples, while the correlation between time of isolation and CFU was tested by the rho Spearman coefficient. A P value 0.05 was considered statistically significant.
Geostatistics. Sampling points were chosen with a ‘random’
system according to elaborations of geostatistical models. Geostatistics offers a wide variety of useful methods to model the processes of pollutants diffusion as a result of random (aleatory) functions [37]. In fact, the geostatistical methods analyze the behaviour of microorganisms (analysis variables), their spatial correlations, and draw the spatial structure of their variability in order to estimate the current values that are not directly measured (biological, physical or chemical) in different matrices (air, water or soil), or in order to predict the expected future levels of pollutants in the matrices themselves [38, 39].
The directional variograms are processed according to the results of the sampling technique called ‘Croix de Sondage’ and the variogram models are proposed as spatial structures of the variability in particle sampled areas [40]. Placing the sampling points at regular distances so as to form a cross – the croix de sondage – which allowed development of the spacing between sampling points, defined as neighborhood
areas, in which the phenomenon could be described as not
yet ‘independent’.
A ‘random’ grid of points was chosen, then, according to the distance between points thus calculated (spatial geostatistics or FAIk Kriging) of variogram models previously processed, so that the points were included in a spacing between 4 and 7 mt with an over estimate of 10 meters. This choice was made to ensure the most accurate and, at the same time, prudential estimation [41].
The parameters of this model consist in the distance beyond which the measured values should be considered to be independent from the observed phenomenon (defined range), and the variance between independent samples (defined
sill). In addition, the spatial structure of variability that
differs from the observed values, is defined geometrically
anisotropic (otherwise assume isotropic values ). Finally, the
expected values of the sampling grid nodes were processed through the software Faipack (DOS version, Release 1.00 – X.93), an automatic software tool for performing linear geostatistical analysis of spatial data) [38, 39] in relation to an interpolation bi/three-dimensional. This allows the building of a continuous function random on the plane z = f(x,y), based on the Z values of the microorganisms sampling performed, fixing the sampling time (t) as a function of the algorithm limt→∞ T=0, in order that the data interpolation can be performed as a random function of the only inferential spatial relationship [41, 42, 43, 44, 45]. Maps of estimated values are thus generated which are useful for describing the areas of Legionella spread contamination in the hospital water pipe system.
RESULTS
Over 50% of the 53 examined samples were Legionella positive. L. pneumophila 1 were isolated in 69% of samples from the ground floor and in 60% of samples from the first floor; L. pneumophila 2–14 in 36% of samples from the ground floor and 24% from the first one (Tab. 1, 2).
Despite the high level of L. pneumophila 1 and 2–14 found in the water distribution system of the pavilion, no cases of Legionnaires’ disease had been reported among patients or among health care workers. Table 3 shows in detail the wards and sampling sites, and min-max of serogroups isolated.
The mean concentration of Legionella did not show significant differences between floors (p>0.05). Also, the different serogroups of L. pneumophila (1 vs. 2–14) did not show any significant difference in the distribution on the same floor, even if on the first floor there was a higher CFU of L. pneumophila 2–14 than L. pneumophila 1.
Analysis of the trend of Legionella CFU in different years showed a significant increase in the concentrations of
Legionella in the latest samples (rho = 0.31; p<0.01), with the
maximum CFU in the samples from two years ago (200.000 CFU) due to Legionella 2–14 isolation (rho 0.25; p>0.05) (Fig. 1).
Geostatistics. The presence of an apparent trend in the values
authorizes the evaluation of the phenomenon according to a non-stationary model, and therefore the use of the FAI-k with the construction of the model of directional variogram (Tab. 4).
It is noteworthy that the main structure of the model of the parameters’ spatial variability is the same for all the measurements carried out, and that the proposed values of range and anisotropy show small differences in their variability, where the value expressed by the sill appears to be more dispersed around the central value of reference. However, the Indicative Goodness of Fit (IGF), which gives a measure of how well the model ‘adjusts’ to the directional variograms, lies almost in all models in the vicinity of its optimal value equivalent to 0.
Observing the difficulty to ‘filter’ the trends estimated and applying the theories of universal kriking, the use of the FAI-k has allowed, in this study, the generation of models of Covariance Generalized of the order K-type variable from 0 – 1 (non-stationary models) (Tab. 5), with Jackknife chosen according to the following calculation algorithm:
To facilitate understanding of the Geostatistical results obtained, Figures 2 and 3 concordant estimation maps with their geostatistical parameters of linear kriking evaluation of sampling models.
Table 1. Proportion of Legionella 1 and 2-14 isolated from the samples drawn from the water distribution system of ground and first floor of the pavilions E
Legionella Proportion Std. Err. [CI 95%]
L. pneumophila total 79.20% 5.60% 67.90% 90.50%
L. pneumophila 1 62.20% 6.70% 48.80% 75.70%
L. pneumophila 2–14 24.50% 5.90% 12.50% 36.50%
Table 2. C.F.U. mean, SD, minimum, maximum and number of observation; overall and by Legionella Serogroups and building floors
Floor Legionella mean sd min max Obs
0 LP1 4632.813 10283.91 0 40000 16
LP2-14 4143.75 12546.87 0 50000 16
1 LP1 2586.486 8366.971 0 50000 37
LP2-14 6046.351 21445.38 0 100000 37
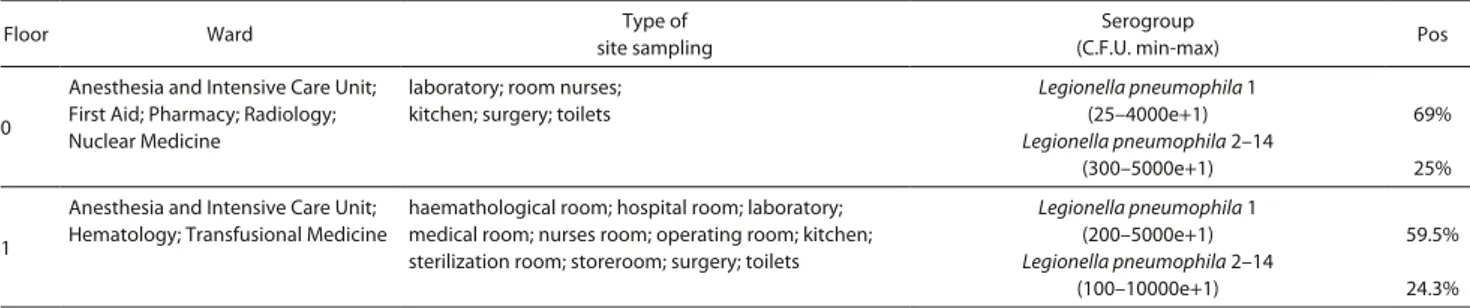
Table 3. Floor, ward, sampling sites, serogroup isolates and percentage of Legionella isolated from water distribution system
Floor Ward site samplingType of (C.F.U. min-max)Serogroup Pos
0
Anesthesia and Intensive Care Unit; First Aid; Pharmacy; Radiology; Nuclear Medicine
laboratory; room nurses; kitchen; surgery; toilets
Legionella pneumophila 1 (25–4000e+1) Legionella pneumophila 2–14 (300–5000e+1) 69% 25% 1
Anesthesia and Intensive Care Unit; Hematology; Transfusional Medicine
haemathological room; hospital room; laboratory; medical room; nurses room; operating room; kitchen; sterilization room; storeroom; surgery; toilets
Legionella pneumophila 1 (200–5000e+1) Legionella pneumophila 2–14 (100–10000e+1) 59.5% 24.3%
Table 4. Directional variogram model showing parameters for each
L. pneumophila 1 and L. pneumophila 2–14 considered in the study Legionella
Specie Sill Anisotropy Model Range Nugget IGF
1 14.3106 2.0 Gaussian 613.9 4.0608 0.0289
2–14 2.96245 1.0 Gaussian 612.2 5.0407 0.0320
DISCUSSION
Although classical statistics is very helpful to organize and interpret data from the samples drawn from the water pipe distribution system, it would be appropriate to combine such statistics with other tools in order to better understand the way of colonization of Legionella and, therefore, to highlight the situations that require more thorough investigation. For this reason, combining the methods of classical statistical analysis with the techniques of georeferencing analysis may be of particular use to understand the source of the contamination, because it is possible to put together the information about the maintenance of the pipe system (i.e. restructuring interventions, changes in materials over time) and the results of routine monitoring activity.
In particular in this study, statistical descriptive classical analysis, while showing differentiated values of the Legionella’s concentration at different water sampling points, even in the same hospital wards and on the same floors, represents an alert index useful for intervention on
a water plant, instead of cannot ‘estimate’ the probability of risk of the spread of the contamination in the environment and, ultimately, risk to the patient. It also allows a limited range of choices for the management and prevention of the risk, not allowing estimation of the possible real source of bacterial contamination in the water plant and, consequently, implementing the choices for more effective prevention.
In this sense, the plans analysis of departments and water sampling points, overlaid with maps of geostatistical iso-estimation, is used to assess the degree of risk at the point of sampling and in its surroundings, both risk assessments applied to the closed circles. In the presented study, the level of risk related to Legionella pneumophila 1 and 2–14 apparently seems low for the hospital departments assessed, and analysis of the maps would lead to the implementation, as well as the known preventive measures (de-calcification, sanitization with chlorine agents, etc.), a more accurate assessment of the state of the water system, and consider replacing some of its components (valves, end portion of the water pipe system, sanitation in recirculation water pipes in the interested
Table 5. Models of Legionella spatial diffusion Generalized Covariance
LP 1 K order Average Rank Quadratic Errors NuggetB0 LinearB1 CubicB3 SplineBs Jackknife » 1
Floor 0 0 1.625 1.0E+8 0.000 -2.936E+06 0.000 0.000 0.944519
Floor 1 1 2.028 1.1E+8 0.000 -6.083E+06 0.000 0.000 1.160316
L. pneumophila 2-14 K order Average Rank Quadratic Errors NuggetB0 LinearB1 CubicB3 SplineBs Jackknife » 1
Floor 0 1 1.750 1.9E+8 0.000 0.000 3.5705E+03 0.000 1.356938
Floor 1 0 1.861 5.2E+8 0.000 -1.342E+07 0.000 0.000 1.328014
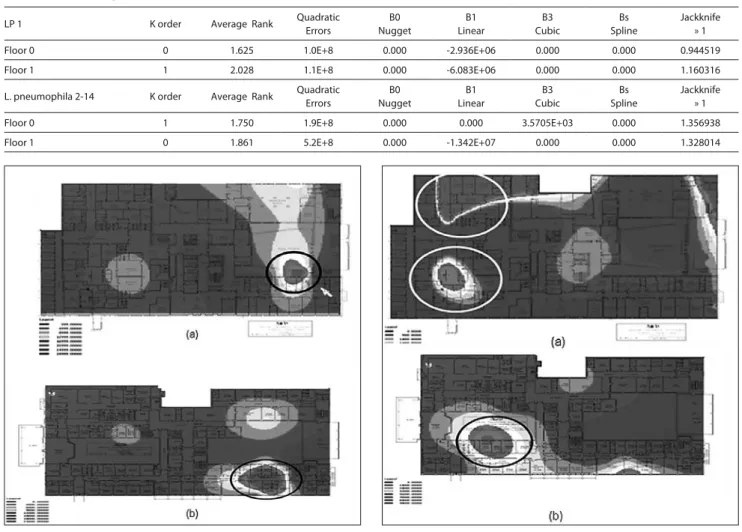
Figure 2 (a). Map showing the estimation of distribution of LP 1 on the ground
floor using geostatistical analysis. The various concentrations of C.F.U. isolated: each gradient of grey refers to different range. The sections in the circle show the Nuclear Medicine and Radiology wards, corresponding to the highest levels of
L. pneumophila 1.
Figure 2 (b). Estimation of the distribution of LP 1 on the first floor. The sections in
the circle shows the Haematology and Transfusional Medicine wards, corresponding to the highest levels of L. pneumophila 1. There is a remarkable correlation between the ground floor and the first floor.
Figure 3 (a). Estimation of the distribution of LP 2-14 on the ground floor using
geostatistical analysis. Various concentrations of C.F.U. isolated: each gradient of grey refers to a different range. Sections in the white circle show the First Aid, Anaesthesia and Intensive Care wards, corresponding to the highest levels of L.
pneumophila 2-14.
Figure 3 (b). Estimation of the distribution of LP 2-14 on the first floor. Sections
in the black circle show the First Aid ward, corresponding to the highest levels of
L. pneumophila 2-14. There is a remarkable correlation between the ground floor
departments concerned, etc.), as well as increase the level of active epidemiological surveillance on patients and staff of the departments concerned.
The good performance of the IGF, the K-order always in a range between 0 – 1 (anisotropic Gaussian model) and the Jackknife around 1 for the majority of the analysis performed, indicate values of an accurate estimate of the model with respect to real sampling, with an excellent reliability interpolation of the neighbourhood areas on octants selected for the graphics processing maps of iso-estimate.
The advantages of the study are represented, therefore, by the demonstration that geostatistical methods applied to microbiological analysis of water matrices allows a better modeling of the phenomenon under study, a greater potential for risk management and a greater choice of methods of prevention and recovery of the environment to be put in place with respect to the classical statistical analysis alone, which, moreover, allows evaluation of the sampling point, but not to estimate the surrounding areas. An even smaller number of samples useful for determining the model applicability in all hospital scenarios, although the statistical analyses are reliable and indicate a high level of significance, the small number of sample units useful for determining the model applicability still represents a limit of the presented study. Moreover, the projections estimation for areas far from sampling points, based on the number of available samples, do not appear to be more than 96%, which renders the study an significant object to the limit value of ≤ 0.05, but no higher.
The speculative hypotheses compared in this study are represented by the implementation of the samples, with analysis of all floors of the building in relation to the spatial distribution of the water, studying the correlation between water pipes and Legionella through an assessment of spreading, and, finally, not in the air of hospital environments but within the water system, in order to identify the sources of risk and the spread of Legionella ‘reservoirs’.
Short Geostatistical Glossary
Anisotropic/Isotropic: anisotropic is the property of
being directionally dependent, as opposed to isotropy, which implies identical properties in all directions.
Geostatistics: a discipline introduced in the 1960s by
Matheron in the geo-mining ambit, in order to allow a content estimate of particular minerals in soils from a few samples distributed in space. From the 1990s – 2000 onwards the geostatistic has been applied to environmental parameters, to assess the probability of spread in dynamic complex matrices of the pollutants or of the microorganisms.
Interpolation: a method of constructing new data points
within the range of a discrete set of known data points.
Jackknife: a re-sampling technique especially useful for
variance and bias estimation.
Kriging: a geostatistical technique that allows interpolation
of the value of a magnitude considering the values that it assumes in the near points.
Variogram: a basic tool by which the linear geostatistical
studies andcharacterizes the spatial variability.
REFERENCES
1. Kool JL, Bergmire-Sweat D, Butler JC, Brown EW, Peabody DJ, Massi DS, et al. Hospital characteristics associated with colonization of water systems by Legionella and risk of nosocomial legionnaires’ disease: a
cohort study of 15 hospitals. Infect Control Hosp Epidemiol. 1999; 20: 798–805.
2. Rudbeck M, Viskum S, Mølbak K, Uldum SA. Legionella antibodies in a Danish hospital staff with known occupational exposure. J Environ Public Health. 2009: 812829
3. Delia S, Merlino G, Mauro A, Laganà P. L. pneumophila in a hospital environment. Preliminary results. Riv Ital Igiene 1990; 50: 54–67. 4. Delia S, Merlino G, Laganà P. L. pneumophila in a hospital environment.
Final results. Riv Ital Igiene 1991; 51: 143–150.
5. Delia S, Laganà P. Environmental research of L. pneumophila at the Polyclinic of Messina. Riv Ital Igiene 1995; 55: 149–156.
6. Delia S, Laganà P. Unusual sources of L. pneumophila in a hospital environment. Annali di Igiene e Med. Prev. e di Comunità 2002; 14: 443–6.
7. Angelbeck JA, Ortolano GA, Canonica FP, Cervia JS. Hospital water. A source of concern for infections. Manag Infect Control. 2006; 6: 44–54. 8. Kusnetsov J, Torvinen E, Perola O, Nousiainen T, Katila ML.
Colonization of hospital water systems by Legionellae, mycobacteria and other heterotrophic bacteria potentially hazardous to risk group patients. Acta Pathol Microbiol Immunol Scand. 2003; 111: 546–556. 9. Anaissie EJ, Penzak SR, Dignani MC. The hospital water supply as a
source of nosocomial infections: a plea for action. Arch Intern Med. 2002; 162: 1483–1492.
10. Osawa K, Shigemura K, Abe Y, Jikimoto T, Yoshida H, Fujisawa M, Arakawa S. A case of nosocomial Legionella pneumonia associated with a contaminated hospital cooling tower. J Infect Chemother. 2014 Jan; 20(1): 6.
11. Røysted W, Simonsen Ø, Jenkins A, Sarjomaa M, Svendsen MV, Ragnhildstveit E, Tveten Y, Kanestrøm A, Waage H, Ringstad J. Etiology and risk factors of community-acquired pneumonia in hospitalized patients in Norway. Clin Respir J. 2015 Mar 12
12. Fard SY, Nomanpour B, Fatolahzadeh B, Mobarez AM, Darban-Sarokhalil D, Fooladi AA et al. Hospital acquired pneumonia: comparison of culture and real-time PCR assays for detection of
Legionella pneumophila from respiratory specimens at Tehran
Hospitals. Acta Microbiol Immunol Hung. 2012 Sep; 59(3): 355–65. 13. Mekkour M, Ben Driss E, Tai J, Squinazi F, Forey F, Jarraud S, Cohen
N. Molecular typing of Legionella pneumophila strains isolated from environment in Morocco. Cell Mol Biol. (Noisy-le-grand). 2012 Jun 30; 58 Suppl: OL1709–14.
14. Mérault N, Rusniok C, Jarraud S, Gomez-Valero L, Cazalet C, Marin M, et al. Specific real-time PCR for simultaneous detection and identification of Legionella pneumophila serogroup 1 in water and clinical samples. Appl Environ Microbiol. 2011 Mar;77(5): 1708–17. 15. Knirsch CA, Jakob K, Schoonmaker D, Kiehlbauch JA, Wong
SJ, Della-Latta P, et al. An outbreak of Legionella micdadei pneumonia in transplant patients: evaluation, molecular epidemiology, and control. Am J Med. 2000 Mar; 108(4): 290–5.
16. Wellinghausen N, Frost C and Marre R. Detection of Legionellae in Hospital Water Samples by Quantitative Real-Time LightCycler PCR. Applied Environ Microbiol. 2001; p. 3985–3993.
17. Cordes LG, Wiesenthal AM, Gorman GW, Phair JP, Sommers HM, Brown A, et al. Isolation of Legionella pneumophila from hospital shower heads. Ann Intern Med. 1981; 94: 195–197.
18. Goetz AM, Stout JE, Jacobs SL, Fisher MA, Ponzer RE, Drenning S, et al. Nosocomial legionnaires’ disease discovered in community hospitals following cultures of the water system: seek and ye shall find. Am J Infect Control. 1998; 26: 8–11.
19. Laganà P, Delia S. Environmental sources of Legionella pneumophila: incubators in a Premature Unit. J Prev Med Hyg. 2000; 41: 34–36. 20. Leoni E, De Luca G, Legnani PP, Sacchetti R, Stampi S, Zanetti F.
Legionella waterline colonization: detection of Legionella species in
domestic, hotel and hospital hot water systems. J Appl Microbiol. 2005; 98: 373–379.
21. Perola O, Kauppinen J, Kusnetsov J, Heikkinen J, Jokinen C, Katila ML. Nosocomial Legionella pneumophila serogroup 5 outbreak associated with persistent colonization of a hospital water system. Acta Pathol Microbiol Immunol Scand. 2002; 110: 863–868.
22. Stojek NM, Szymanska J, Dutkiewicz J. Gram-negative bacteria in water distribution systems of hospitals. Ann Agric Environ Med. 2008; 15: 135–142.
23. Boccia S, Laurenti P, Borella P, Moscato U, Capalbo G, Cambieri A, et al. Prospective three year surveillance for nosocomial and environmental
Legionella: implications for infection control. Infect Control Hosp
Epidemiol. 2006; 27: 459–465.
24. Ditommaso S, Giacomuzzi M, Biasin C, Gentile M, Maggiorotto G, Ruggenini Moiraghi A et al. Legionellosis Collaborating Group.
Incidence of Legionellosis in hospitals contaminated by Legionella
pneumophila other than serogroup 1. Infect Control Hosp Epidemiol.
2007; 28: 509–511.
25. Ditommaso S, Giacomuzzi M, Rivera SR, Raso R, Ferrero P, Zotti CM. Virulence of Legionella pneumophila strains isolated from hospital water system and healthcare-associated Legionnaires’ disease in Northern Italy between 2004 and 2009. BMC Infect Dis. 2014 Sep 5; 14: 483.
26. Laurenti P, Quaranta G, Branca G, Tumbarello M, Capoluongo E, Orsini M, et al. Epidemiological monitoring of legionellosis: a case-control study in an university general hospital. Ig Sanità Pubbl. 2003; 59: 203–214.
27. Pignato S, Coniglio MA, Faro G, Cantaro P, Carini SA, Mangano G, et al. Legionella contamination in the hospital environment. Monitoring of the hot water distribution systems of three hospitals in Catania (Italy). Ig Sanità Pubbl. 2006; 62: 635–652.
28. Triassi M, Di Popolo A, Ribera D’Alcalà G, Albanese Z, Cuccurullo S, Montegrosso S, et al. Clinical and environmental distribution of
Legionella pneumophila in a university hospital in Italy: efficacy of
ultraviolet disinfection. J Hosp Infect. 2006; 62: 494–501.
29. Rota MC, Caporali MG, Napoli C, Bella A, Giannitelli S, Mandarino G, et al. Rapporto annuale sulla legionellosi in Italia nel 2011. Notiz. Ist. Super. Sanità 2012; 25: 17–23.
30. Fields BS. Legionella in the environment. In: Hoffman P, Friedman H, Bendinelli M. Legionella pneumophila. Pathogenesis and Immunity. New York, Springer, 2007.p.85–94.
31. Liu WK, Healing DE, Yeomans JT, Elliot TS. Monitoring of hospital water supplies for Legionella. J Hosp Infect. 1993; 24: 1–9.
32. Marchesi I, Marchegiano P, Bargellini A, Cencetti S, Frezza G, Miselli M, et al. Effectiveness of different methods to control Legionella in the water supply: ten-year experience in an Italian university hospital. J Hosp Infect. 2011; 77: 47–51.
33. Montagna MT, Napoli C, Tatò D, Spilotros G, Barbuti G, Barbuti S, et al. Clinical-environmental surveillance of legionellosis: an experience in Southern Italy. Eur J Epidemiol. 2006; 21: 325–331.
34. O’Neill E, Humphreysa H. Surveillance of hospital water and primary prevention of nosocomial legionellosis: what is the evidence? J Hosp Infect. 2005; 59: 273–279.
35. Bédard E, Fey S, Charron D, Lalancette C, Cantin P, Dolcé P, Laferrière C, Déziel E, Prévost M. Temperature diagnostic to identify high risk areas and optimize Legionella pneumophila surveillance in hot water distribution systems. Water Res. 2015 Mar 15; 71: 244–56.
36. Laganà P, Caruso G, Piccione D, Gioffrè ME, Pino R, Delia S. Legionella spp., amoebae and not-fermenting Gram negative bacteria in an Italian university hospital water system. Ann Agric Environ Med. 2014; 21(3): 489–93.
37. Rohuani S, Wackernagel H. Multivariate geostatistical approach to space-time data analysis. Water Resources Research. 1990; 26(4): 585–91.
38. Raspa G, Bruno R. Papers on Applied Geostatistics. Comett Workshop “Geostatistics for Environment”, 1995: Rome.
39. Capelli G, Moscato U, Sturniolo A et Al.. Assessment of Thermal Discomfort in a Hospital Ward: a Geostatistical Approach. In: Yoshizawa S, Kimura K, Ikeda K, Tanabe S, Iwata T (eds.). Indoor
Air ‘96. “The 7th International Conference on Indoor Air Quality and
Climate”. Proceedings of the 7th International Conference on Indoor
Air Quality and Climate. Nagoya (Japan), 21–26 July 1996. Nagoya 1996, 589–594.
40. PannatierY. Variowin 2.1 – User’guide Institute of Mineralogy, University of Lausanne, 1994, Switzerland.
41. Bruno R, Raspa G. The practice of linear geostatistics. Guerini Studio, Milano 1994.
42. Poscia A, Tuti F, Di Donato M, et al. Air particulate monitoring and geostatistical analysis: a new approach to risk assessment in clean room. In: Proceedings of The 2nd joint European Public Health Conference. 2009. Eur J Public Health, p209.
43. Moscato U, Canonaco D, Porcelli D, de Belvis AG. Benzene, Toluene and Xylenes pollution: a geostatistical method to assess spatial distribution of BTX and citizens exposure. ISEE/ISEA Joint Conference. Boston MA, 15–19 August 1998. Epidemiology 1998; 9(4): p. 290.
44. Moscato U, La Torre G, La Torre F et al. Aromatic hydrocarbons outdoor and indoor pollution in Rome. Proceedings of The 66h International Symposium on Advanced Environmental Monitoring. June 27–30, 2006, Heidelberg, Germany.
45. Moscato U, La Pietra L, Ricciardi G. Polveri e Cantieri in ospedale. Atti del XXXIV Corso Cantieri in Ospedale Erice, Sicilia, 3–6 Marzo 2007. Annali di Igiene 2007; 19 s1 al N.5. Settembre –Ottobre: 173-191.